 Explore
 Validate
 Learn
LearnMA5-16236
antibody from Invitrogen Antibodies
Targeting: TLR5
FLJ10052, MGC126430, MGC126431, SLEB1, TIL3
 Flow cytometry
Antibody data
- Antibody Data
- Antigen structure
- References [1]
- Comments [0]
- Validations
- Flow cytometry [2]
- Other assay [3]
Submit
Validation data
Reference
Comment
Report error
- Product number
- MA5-16236 - Provider product page

- Provider
- Invitrogen Antibodies
- Product name
- TLR5 Monoclonal Antibody (85B152.5), PE
- Antibody type
- Monoclonal
- Antigen
- Synthetic peptide
- Reactivity
- Human, Mouse, Canine
- Host
- Mouse
- Conjugate
- Yellow dye
- Isotype
- IgG
- Antibody clone number
- 85B152.5
- Vial size
- 100 µL
- Concentration
- 0.51 mg/mL
- Storage
- 4° C, store in dark
Submitted references Hsp90 Inhibition Reduces TLR5 Surface Expression and NF-κB Activation in Human Myeloid Leukemia THP-1 Cells.
Na BH, Hoang TX, Kim JY
BioMed research international 2018;2018:4319369
BioMed research international 2018;2018:4319369
No comments: Submit comment
Supportive validation
- Submitted by
- Invitrogen Antibodies (provider)
- Main image

- Experimental details
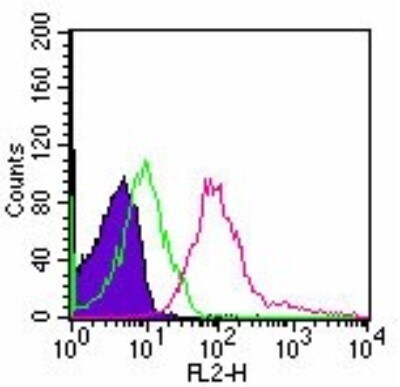
- Flow cytometry of TLR5 in 10^6 human lymphocytes. Samples were incubated in TLR5 monoclonal antibody (Product # MA5-16236) using a dilution of 0.5 µg. The shaded histogram represents cells without antibody, green represents isotype control antibody, and red represents TLR5 antibody.
- Conjugate
- Yellow dye
- Submitted by
- Invitrogen Antibodies (provider)
- Main image

- Experimental details
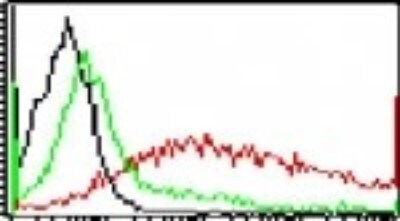
- Flow cytometry of TLR5 in 10^6 RAW cells. Samples were incubated in TLR5 monoclonal antibody (Product # MA5-16236) using a dilution of 0.5 µg. The black histogram represents cells without antibody, green represents isotype control antibody, and red represents TLR5 antibody.
- Conjugate
- Yellow dye
Supportive validation
- Submitted by
- Invitrogen Antibodies (provider)
- Main image
- Experimental details
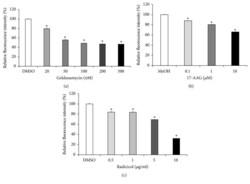
- Figure 4 Inhibition of Hsp90 reduces TLR5 cell surface expression . Cell surface expression of TLR5 in THP-1 cells was examined by flow cytometry analysis. THP-1 cells were treated with or without the Hsp90 inhibitors, (a) GA, (b) 17-AAG, and (c) radicicol at various concentrations for 24 h. Relative fluorescence intensity was measured, and data are expressed as means of relative expression ratio +- SD ( n = 6). * P < 0.05 versus DMSO- or MeOH-treated group.
- Conjugate
- Yellow dye

- Submitted by
- Invitrogen Antibodies (provider)
- Main image

- Experimental details
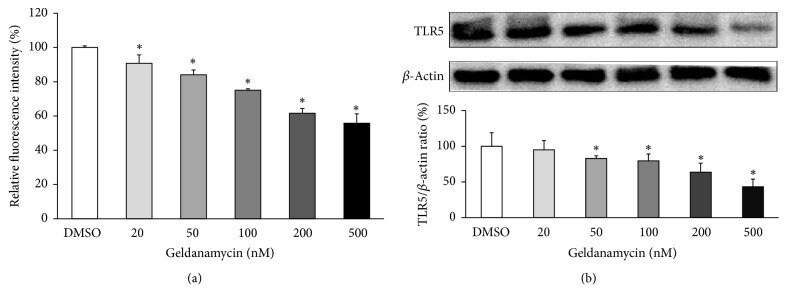
- Figure 5 Inhibition of Hsp90 reduces total protein levels of TLR5 . THP-1 cells were treated with or without the Hsp90 inhibitor GA (20, 50, 100, 200, and 500 nM) for 24 hr. The levels of TLR5 protein expression were measured by intracellular flow cytometry (a) or Western blot (b). Shown are representative blots and densitometric ratios of proteins normalized to beta -actin. Data are expressed as means of relative expression ratio +- SD ( n = 3 or 4). * P < 0.05 versus DMSO-treated group.
- Conjugate
- Yellow dye
- Submitted by
- Invitrogen Antibodies (provider)
- Main image
- Experimental details
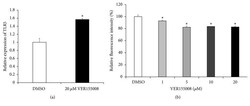
- Figure 6 Inhibition of Hsp70 enhances TLR5 mRNA expression, while reducing TLR5 surface expression . (a) The Hsp70 inhibitor VER155008 enhances TLR5 mRNA expression in THP-1 cells. Gene expression of TLR5 was determined by qRT-PCR and was normalized to that of beta -actin. THP-1 cells were treated with or without 20 mu M VER155008 for 24 h. Data are expressed as means of relative expression ratio +- SD ( n = 6). * P < 0.05 versus DMSO-treated group. (b) Cell surface expression of TLR5 in THP-1 cells was examined by flow cytometry analysis. THP-1 cells were treated with or without VER155008, at various concentrations, for 24 h. Relative fluorescence intensity was measured, and data are expressed as relative TLR5 expression +- SD ( n = 6). * P < 0.05 versus DMSO-treated group.
- Conjugate
- Yellow dye
