Explore
 Validate
 Learn
Learn Flow cytometry
Antibody data
- Antibody Data
- Antigen structure
- References [19]
- Comments [0]
- Validations
- Flow cytometry [1]
- Other assay [19]
Submit
Validation data
Reference
Comment
Report error
- Product number
- 56-7349-41 - Provider product page

- Provider
- Invitrogen Antibodies
- Product name
- TNF alpha Monoclonal Antibody (MAb11), Alexa Fluor™ 700, eBioscience™
- Antibody type
- Monoclonal
- Antigen
- Other
- Description
- Description: The MAb11 antibody reacts with human tumor necrosis factor-alpha (TNF alpha), a 17 kDa cytokine produced by monocytes, macrophages, neutrophils, NK cells and CD4+ T cells. TN alpha has cytolytic activity against a range of tumor cells and is important in immune regulation. TNF alpha forms dimers and trimers and also exists as a 26 kDa membrane bound form. The MAb11 antibody is a neutralizing antibody. Applications Reported: This MAb11 antibody has been reported for use in intracellular staining followed by flow cytometric analysis. Applications Tested: This MAb11 antibody has been pre-titrated and tested byintracellular staining and flow cytometric analysis of stimulated normal human peripheral blood cells using the Intracellular Fixation & Permeabilization Buffer Set (Product # 88-8824-00) and protocol. Please refer to Best Protocols: Protocol A: Two step protocol for (cytoplasmic) intracellular proteins located under the Resources Tab online. This can be used at 5 µL (0.25 µg) per test. A test is defined as the amount (µg) of antibody that will stain a cell sample in a final volume of 100 µL. Cell number should be determined empirically but can range from 10^5 to 10^8 cells/test. Alexa Fluor® 700 emits at 723 nm and can be excited with the red laser (633 nm). Most instruments will require a 685 LP mirror and 710/20 filter. Please make sure that your instrument is capable of detecting this fluorochrome. Excitation: 633-647 nm; Emission: 723 nm; Laser: Red Laser. Filtration: 0.2 µm post-manufacturing filtered.
- Reactivity
- Human
- Host
- Mouse
- Conjugate
- Near infrared dye
- Isotype
- IgG
- Antibody clone number
- MAb11
- Vial size
- 25 Tests
- Concentration
- 5 µL/Test
- Storage
- 4° C, store in dark, DO NOT FREEZE!
Submitted references LINC01123 promotes immune escape by sponging miR-214-3p to regulate B7-H3 in head and neck squamous-cell carcinoma.
Development of an Inflammatory CD14(+) Dendritic Cell Subset in Humanized Mice.
Effects of persistent modulation of intestinal microbiota on SIV/HIV vaccination in rhesus macaques.
Baricitinib treatment resolves lower-airway macrophage inflammation and neutrophil recruitment in SARS-CoV-2-infected rhesus macaques.
NKD2 mediates stimulation-dependent ORAI1 trafficking to augment Ca(2+) entry in T cells.
Membrane lymphotoxin-α(2)β is a novel tumor necrosis factor (TNF) receptor 2 (TNFR2) agonist.
Ghrelin ameliorates tumor-induced adipose tissue atrophy and inflammation via Ghrelin receptor-dependent and -independent pathways.
Mucosal-associated invariant T (MAIT) cells mediate protective host responses in sepsis.
Inhibition of Cholesterol Esterification Enzyme Enhances the Potency of Human Chimeric Antigen Receptor T Cells against Pancreatic Carcinoma.
CAIX Regulates GBM Motility and TAM Adhesion and Polarization through EGFR/STAT3 under Hypoxic Conditions.
CD4(+) T Cells Cross-Reactive with Dengue and Zika Viruses Protect against Zika Virus Infection.
Application of a whole blood mycobacterial growth inhibition assay to study immunity against Mycobacterium tuberculosis in a high tuberculosis burden population.
The distribution and function of human memory T cell subsets in lung cancer.
Heterogeneous Tumor-Immune Microenvironments among Differentially Growing Metastases in an Ovarian Cancer Patient.
Human Mucosa-Associated Invariant T Cells Accumulate in Colon Adenocarcinomas but Produce Reduced Amounts of IFN-γ.
Cell-mediated immune responses to respiratory syncytial virus infection: magnitude, kinetics, and correlates with morbidity and age.
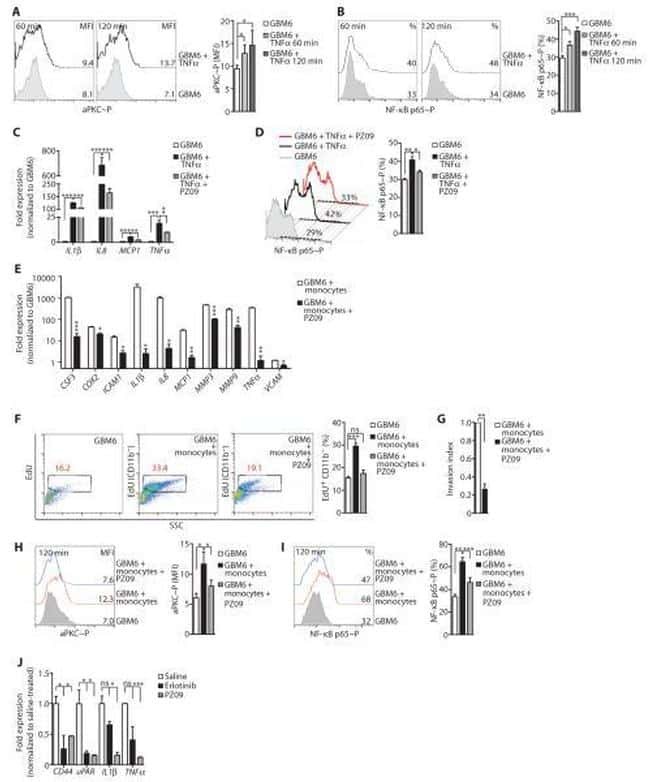
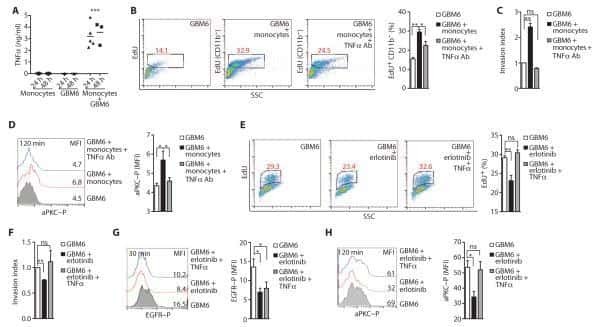
Targeting aPKC disables oncogenic signaling by both the EGFR and the proinflammatory cytokine TNFα in glioblastoma.
Functional OCT4-specific CD4(+) and CD8(+) T cells in healthy controls and ovarian cancer patients.
Association of a NOD2 gene polymorphism and T-helper 17 cells with presumed ocular toxoplasmosis.
Li H, Yang Z, Yang X, Zhang F, Wang J, Wu Z, Wanyan C, Meng Q, Gao W, Yang X, Wei J
Cell death & disease 2022 Feb 3;13(2):109
Cell death & disease 2022 Feb 3;13(2):109
Development of an Inflammatory CD14(+) Dendritic Cell Subset in Humanized Mice.
Iwabuchi R, Ide K, Terahara K, Wagatsuma R, Iwaki R, Matsunaga H, Tsunetsugu-Yokota Y, Takeyama H, Takahashi Y
Frontiers in immunology 2021;12:643040
Frontiers in immunology 2021;12:643040
Effects of persistent modulation of intestinal microbiota on SIV/HIV vaccination in rhesus macaques.
Klatt NR, Broedlow C, Osborn JM, Gustin AT, Dross S, O'Connor MA, Coronado E, Barnette P, Hensley-McBain T, Zevin AS, Muir R, Roederer A, Wangari S, Iwayama N, Ahrens CY, Smedley J, Moats C, Lynch RM, Haddad EK, Haigwood NL, Fuller DH, Manuzak JA
NPJ vaccines 2021 Mar 11;6(1):34
NPJ vaccines 2021 Mar 11;6(1):34
Baricitinib treatment resolves lower-airway macrophage inflammation and neutrophil recruitment in SARS-CoV-2-infected rhesus macaques.
Hoang TN, Pino M, Boddapati AK, Viox EG, Starke CE, Upadhyay AA, Gumber S, Nekorchuk M, Busman-Sahay K, Strongin Z, Harper JL, Tharp GK, Pellegrini KL, Kirejczyk S, Zandi K, Tao S, Horton TR, Beagle EN, Mahar EA, Lee MYH, Cohen J, Jean SM, Wood JS, Connor-Stroud F, Stammen RL, Delmas OM, Wang S, Cooney KA, Sayegh MN, Wang L, Filev PD, Weiskopf D, Silvestri G, Waggoner J, Piantadosi A, Kasturi SP, Al-Shakhshir H, Ribeiro SP, Sekaly RP, Levit RD, Estes JD, Vanderford TH, Schinazi RF, Bosinger SE, Paiardini M
Cell 2021 Jan 21;184(2):460-475.e21
Cell 2021 Jan 21;184(2):460-475.e21
NKD2 mediates stimulation-dependent ORAI1 trafficking to augment Ca(2+) entry in T cells.
Wu B, Woo JS, Vila P, Jew M, Leung J, Sun Z, Srikanth S, Gwack Y
Cell reports 2021 Aug 24;36(8):109603
Cell reports 2021 Aug 24;36(8):109603
Membrane lymphotoxin-α(2)β is a novel tumor necrosis factor (TNF) receptor 2 (TNFR2) agonist.
Kucka K, Lang I, Zhang T, Siegmund D, Medler J, Wajant H
Cell death & disease 2021 Apr 6;12(4):360
Cell death & disease 2021 Apr 6;12(4):360
Ghrelin ameliorates tumor-induced adipose tissue atrophy and inflammation via Ghrelin receptor-dependent and -independent pathways.
Liu H, Luo J, Guillory B, Chen JA, Zang P, Yoeli JK, Hernandez Y, Lee II, Anderson B, Storie M, Tewnion A, Garcia JM
Oncotarget 2020 Sep 1;11(35):3286-3302
Oncotarget 2020 Sep 1;11(35):3286-3302
Mucosal-associated invariant T (MAIT) cells mediate protective host responses in sepsis.
Trivedi S, Labuz D, Anderson CP, Araujo CV, Blair A, Middleton EA, Jensen O, Tran A, Mulvey MA, Campbell RA, Hale JS, Rondina MT, Leung DT
eLife 2020 Nov 9;9
eLife 2020 Nov 9;9
Inhibition of Cholesterol Esterification Enzyme Enhances the Potency of Human Chimeric Antigen Receptor T Cells against Pancreatic Carcinoma.
Zhao L, Liu Y, Zhao F, Jin Y, Feng J, Geng R, Sun J, Kang L, Yu L, Wei Y
Molecular therapy oncolytics 2020 Mar 27;16:262-271
Molecular therapy oncolytics 2020 Mar 27;16:262-271
CAIX Regulates GBM Motility and TAM Adhesion and Polarization through EGFR/STAT3 under Hypoxic Conditions.
Huang BR, Liu YS, Lai SW, Lin HJ, Shen CK, Yang LY, Lu DY
International journal of molecular sciences 2020 Aug 14;21(16)
International journal of molecular sciences 2020 Aug 14;21(16)
CD4(+) T Cells Cross-Reactive with Dengue and Zika Viruses Protect against Zika Virus Infection.
Wen J, Wang YT, Valentine KM, Dos Santos Alves RP, Xu Z, Regla-Nava JA, Ngono AE, Young MP, Ferreira LCS, Shresta S
Cell reports 2020 Apr 28;31(4):107566
Cell reports 2020 Apr 28;31(4):107566
Application of a whole blood mycobacterial growth inhibition assay to study immunity against Mycobacterium tuberculosis in a high tuberculosis burden population.
Baguma R, Penn-Nicholson A, Smit E, Erasmus M, Day J, Makhethe L, de Kock M, Hughes EJ, van Rooyen M, Pienaar B, Stone L, Hanekom W, Brennan MJ, Wallis RS, Hatherill M, Scriba TJ
PloS one 2017;12(9):e0184563
PloS one 2017;12(9):e0184563
The distribution and function of human memory T cell subsets in lung cancer.
Sheng SY, Gu Y, Lu CG, Zou JY, Hong H, Wang R
Immunologic research 2017 Jun;65(3):639-650
Immunologic research 2017 Jun;65(3):639-650
Heterogeneous Tumor-Immune Microenvironments among Differentially Growing Metastases in an Ovarian Cancer Patient.
Jiménez-Sánchez A, Memon D, Pourpe S, Veeraraghavan H, Li Y, Vargas HA, Gill MB, Park KJ, Zivanovic O, Konner J, Ricca J, Zamarin D, Walther T, Aghajanian C, Wolchok JD, Sala E, Merghoub T, Snyder A, Miller ML
Cell 2017 Aug 24;170(5):927-938.e20
Cell 2017 Aug 24;170(5):927-938.e20
Human Mucosa-Associated Invariant T Cells Accumulate in Colon Adenocarcinomas but Produce Reduced Amounts of IFN-γ.
Sundström P, Ahlmanner F, Akéus P, Sundquist M, Alsén S, Yrlid U, Börjesson L, Sjöling Å, Gustavsson B, Wong SB, Quiding-Järbrink M
Journal of immunology (Baltimore, Md. : 1950) 2015 Oct 1;195(7):3472-81
Journal of immunology (Baltimore, Md. : 1950) 2015 Oct 1;195(7):3472-81
Cell-mediated immune responses to respiratory syncytial virus infection: magnitude, kinetics, and correlates with morbidity and age.
Geevarghese B, Weinberg A
Human vaccines & immunotherapeutics 2014;10(4):1047-56
Human vaccines & immunotherapeutics 2014;10(4):1047-56
Targeting aPKC disables oncogenic signaling by both the EGFR and the proinflammatory cytokine TNFα in glioblastoma.
Kusne Y, Carrera-Silva EA, Perry AS, Rushing EJ, Mandell EK, Dietrich JD, Errasti AE, Gibbs D, Berens ME, Loftus JC, Hulme C, Yang W, Lu Z, Aldape K, Sanai N, Rothlin CV, Ghosh S
Science signaling 2014 Aug 12;7(338):ra75
Science signaling 2014 Aug 12;7(338):ra75
Functional OCT4-specific CD4(+) and CD8(+) T cells in healthy controls and ovarian cancer patients.
Di J, Massuger LF, Duiveman-de Boer T, Zusterzeel PL, Figdor CG, Torensma R
Oncoimmunology 2013 May 1;2(5):e24271
Oncoimmunology 2013 May 1;2(5):e24271
Association of a NOD2 gene polymorphism and T-helper 17 cells with presumed ocular toxoplasmosis.
Dutra MS, Béla SR, Peixoto-Rangel AL, Fakiola M, Cruz AG, Gazzinelli A, Quites HF, Bahia-Oliveira LM, Peixe RG, Campos WR, Higino-Rocha AC, Miller NE, Blackwell JM, Antonelli LR, Gazzinelli RT
The Journal of infectious diseases 2013 Jan 1;207(1):152-63
The Journal of infectious diseases 2013 Jan 1;207(1):152-63
No comments: Submit comment
Supportive validation
- Submitted by
- Invitrogen Antibodies (provider)
- Main image

- Experimental details
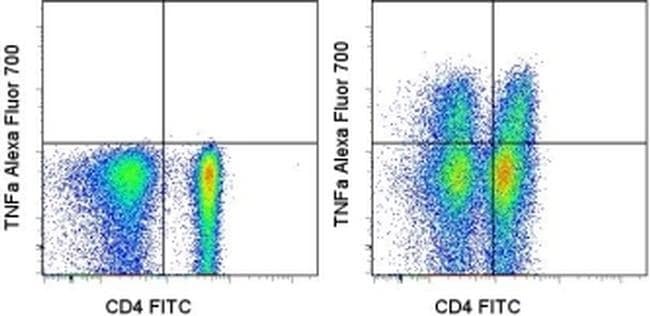
- Normal human peripheral blood cells were stimulated for 5 hours with PMA/ionomycin and Brefeldin A (right) or unstimulated (left), followed by intracellular staining with Anti-Human CD4 FITC (Product # 11-0048-42) and Anti-Human TNF alpha Alexa Fluor® 700 using the Intracellular Fixation & Permeabilization Buffer Set (Product # 88-8824-00) and protocol. Cells in the lymphocyte gate were used for analysis.
- Conjugate
- Near infrared dye
Supportive validation
- Submitted by
- Invitrogen Antibodies (provider)
- Main image

- Experimental details
- NULL
- Conjugate
- Near infrared dye
- Submitted by
- Invitrogen Antibodies (provider)
- Main image

- Experimental details
- NULL
- Conjugate
- Near infrared dye
- Submitted by
- Invitrogen Antibodies (provider)
- Main image
- Experimental details
- NULL
- Conjugate
- Near infrared dye

- Submitted by
- Invitrogen Antibodies (provider)
- Main image
- Experimental details
- NULL
- Conjugate
- Near infrared dye
- Submitted by
- Invitrogen Antibodies (provider)
- Main image
- Experimental details
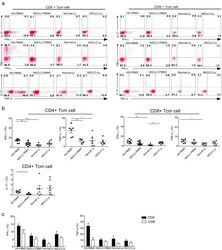
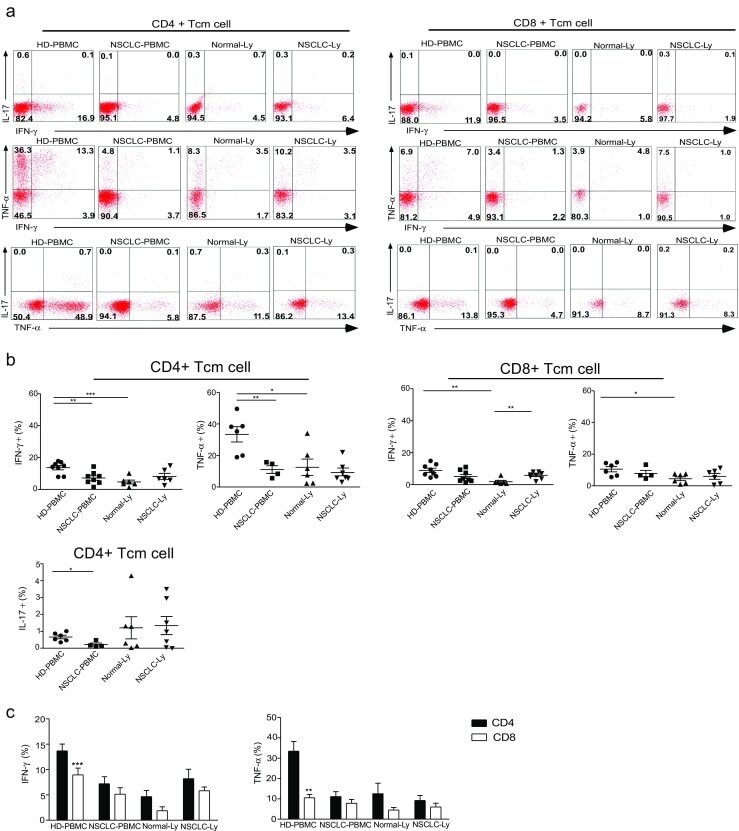
- Fig. 3 Cytokine-expressing CD4+ Tcm cells are decreased in blood of human NSCLC patients. a Flow cytometry plots showing IL-17, IFN-gamma, and TNF-alpha expression in the CD4+CD45RA-/CD45RO+CCR7+ and CD4-/CD8+CD45RA-/CD45RO+CCR7+ T cells from the blood and lymph node of the non-small cell lung cancer patients and healthy donors. b The mean frequency (+-SEM) of the IFN-gamma-expressing, TNF-alpha-expressing, and IL-17-expressing T cells gated on the CD4+ Tcm and CD4-/CD8+ Tcm cells in the blood. c The graph shows the relative frequencies of the cytokine-producing CD4+ Tcm and CD8+ Tcm cells in the HD-PBMC, LC-PBMC, Normal-Ly, and NSCLC-Ly. * p < 0.05, ** p < 0.005, *** p < 0.001; non-paired Student's t test
- Conjugate
- Near infrared dye
- Submitted by
- Invitrogen Antibodies (provider)
- Main image

- Experimental details
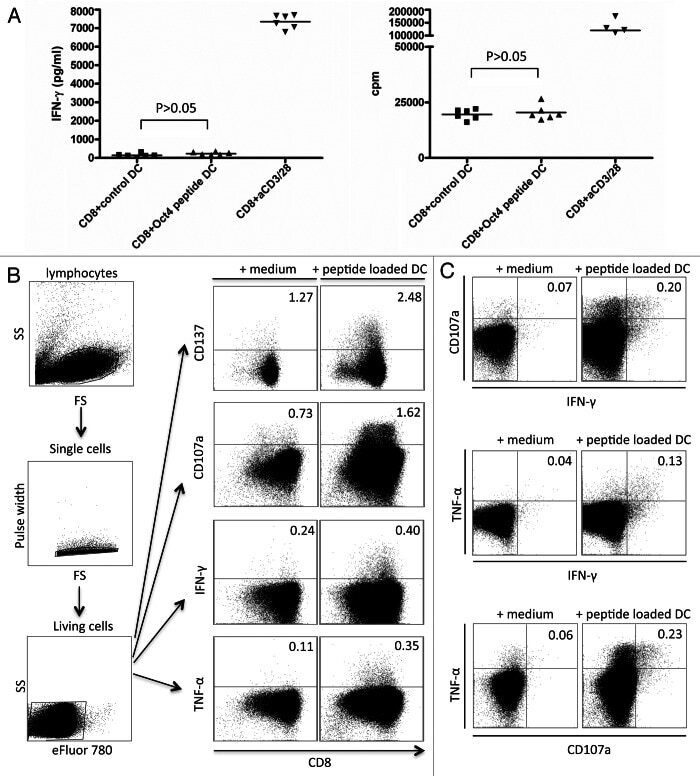
- Figure 4. Detection of OCT4-reactive CD8 + T cells. ( A-C ) MACS-sorted CD4 + cells were stimulated with autologous dendritic cells (DCs) loaded with an immunoreactive OCT4-derived peptide. CD4 + cells stimulated with anti-CD3/anti-CD28 beads and CD4 + cells exposed to unloaded DCs served as a positive and negative control condition, respectively. ( A ) Results from one representative donor showing no significant interferon gamma (IFNgamma) production (on day 3) and no antigen-dependent CD8 + T-cell proliferation (on day 6) (p > 0.05) are reported. ( B ) After 12 d of co-culture, a second stimulation was performed with -derived peptide-loaded DCs. Thereafter, peptide-specific CD8+ T cells were analyzed for their cytotoxic functions by intracellular cytokine staining and flow cytometry. The expression of activation markers by cells from one representative healthy donor is shown, together with the gating strategy. ( C ) Results from one representative donor showing the mobilization of CD107a and the expression of IFNgamma and tumor necrosis factor alpha (TNFalpha) by the same cells [gating strategy as in ( B )] are shown.
- Conjugate
- Near infrared dye
- Submitted by
- Invitrogen Antibodies (provider)
- Main image
- Experimental details
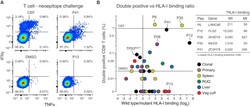
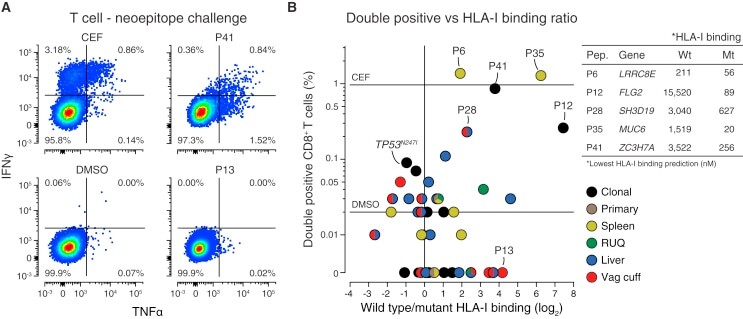
- Figure 5 Predicted Neoepitopes with Higher Mutant than Wild-Type HLA-I Binding Affinity Elicit a T Cell Response (A) Representative scatterplots of TNF-alpha and IFN-gamma intracellular cytokine staining of CD8 + T cells after 21 days of culture with CEF peptides or DMSO as positive and negative controls or the predicted mutant peptides ( Figure S6 B). CEF = Cytomegalovirus, Epstein-Barr virus, Influenza virus. (B) Percentage of CD8 + T cells with double-positive intracellular staining (TNF-alpha and IFN-gamma) after incubation with each of the 43 predicted HLA-I neoepitopes, and HLA-I predicted binding affinity wild-type to mutant ratio ( Table S5 B). Mutation in gene FLG2 E1608K (P12) was found to be clonal after manual inspection in IGV ( Table S1 A).
- Conjugate
- Near infrared dye
- Submitted by
- Invitrogen Antibodies (provider)
- Main image
- Experimental details
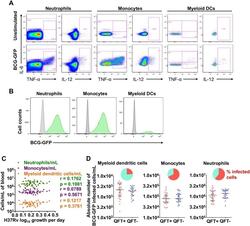
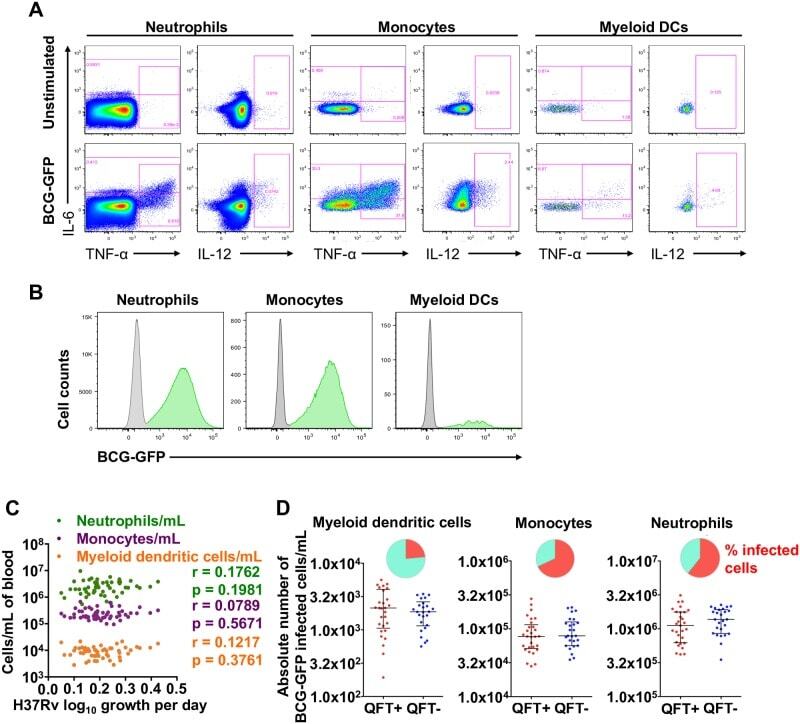
- Fig 3 Detection of GFP-expressing BCG by innate cells and association between absolute numbers of innate cells and mycobacterial growth inhibition. ( A ) Representative flow cytometry plot of IL-6, IL-12 and TNF-alpha cytokine expression by myeloid dentritic cells (mDCs), monocytes and neutrophils, measured in whole blood stimulated for 6 hours with BCG, BCG-GFP (shown) or LPS, relative to an unstimulated control sample. ( B ) Representative histograms indicating proportions of innate cells that phagocytosed BCG-GFP (green). ( C ) Absolute numbers of innate cell subsets per milliliter of unstimulated whole blood plotted against M . tb H37Rv growth. R and p values were calculated using Spearman's correlation. ( D ) Absolute numbers of BCG-GFP-positive mDCs, monocytes or neutrophils per mL of whole blood in adult individuals, stratified by QFT status. The inclusion of TruCount beads during the cell staining steps of the innate whole blood assay allowed determination of the absolute number of each subset of cells per mL of whole blood. The red and blue circles represent QFT+ and QFT- adults, respectively. Horizontal lines represent medians and whiskers, the interquartile range. Differences in absolute counts of BCG-GFP-positive innate cells between the groups were evaluated with the Mann-Whitney test (shown P values). The pie charts show relative proportions of BCG-GFP-positive cells among each innate cell subset.
- Conjugate
- Near infrared dye
- Submitted by
- Invitrogen Antibodies (provider)
- Main image
- Experimental details
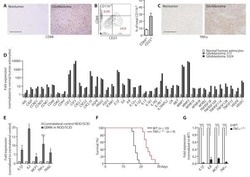
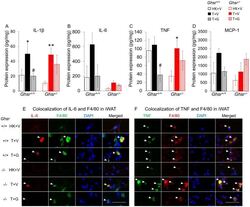
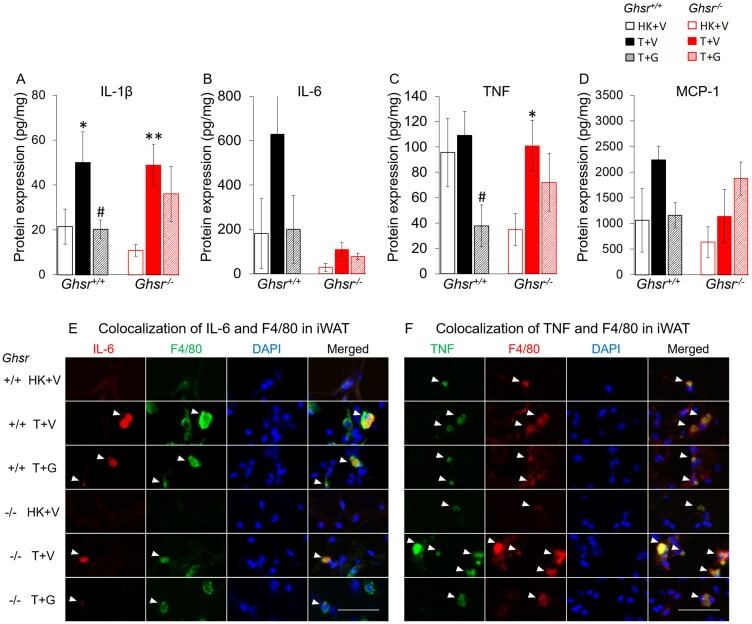
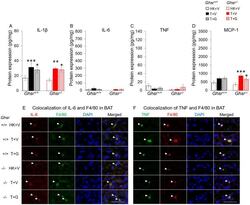
- Figure 3 Effects of ghrelin on LLC-induced changes in inflammation and macrophages in iWAT. HK+V: heat-killed + vehicle; T+V: tumor + vehicle; T+G: tumor + ghrelin. Protein levels of inflammatory markers ( A ) IL-1beta, ( B ) IL-6, and ( C ) TNF; and ( D ) macrophage marker MCP-1 in iWAT (pg/mg). Two-way ANOVA was performed to detect genotype and treatment differences. * p < 0.05; ** p < 0.01 compared to HK+V within the same genotype. # p < 0.05 compared to T+V within the same genotype. No genotype difference was detected. Data are shown as mean +- SE. n = 6-7/group. ( E and F ) Colocalization of inflammation and macrophages in iWAT. (E) Representative images of colocalization of inflammatory marker IL-6 and macrophage marker F4/80 in iWAT (IL-6 in Texas red; F4/80 in FITC green; nuclei in DAPI blue). (F) Representative images of colocalization of inflammatory marker TNF and macrophage marker F4/80 in iWAT (TNF in FITC green; F4/80 in Texas red; nuclei in DAPI blue). Positively stained inflammatory markers and colocalizations with macrophages are indicated by white arrows. Scale bars, 50 mum.
- Conjugate
- Near infrared dye
- Submitted by
- Invitrogen Antibodies (provider)
- Main image
- Experimental details
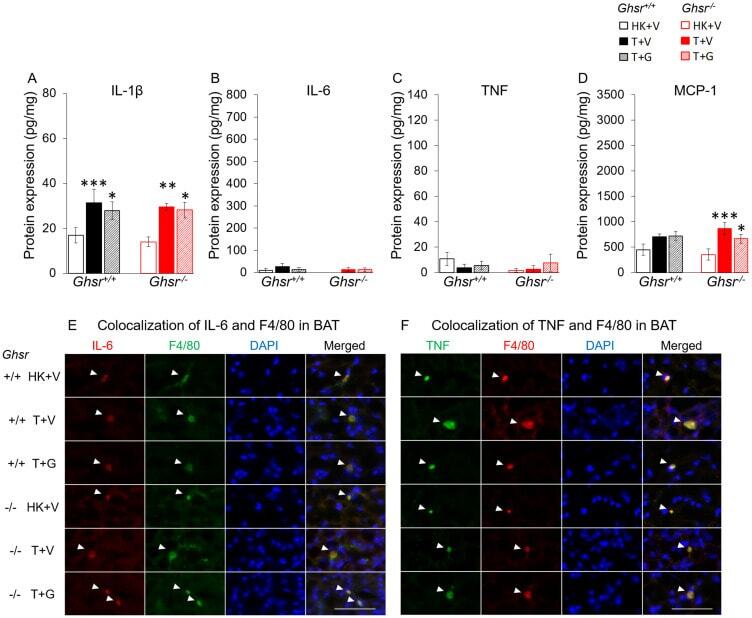
- Figure 4 Effects of ghrelin on LLC-induced changes in inflammation and macrophages in BAT. HK+V: heat-killed + vehicle; T+V: tumor + vehicle; T+G: tumor + ghrelin. Protein levels of inflammatory markers ( A ) IL-1beta, ( B ) IL-6, and ( C ) TNF; and ( D ) macrophage marker MCP-1 in BAT (pg/mg). Two-way ANOVA was performed to detect genotype and treatment differences. * p < 0.05; ** p < 0.01; *** p < 0.001 compared to HK+V within the same genotype. # p < 0.05; ### p < 0.001 compared to T+V within the same genotype. No genotype difference was detected. Data are shown as mean +- SE. n = 6-7/group. ( E and F ) Colocalization of inflammation and macrophages in BAT. (E) Representative images of colocalization of inflammatory marker IL-6 and macrophage marker F4/80 in BAT (IL-6 in Texas red; F4/80 in FITC green; nuclei in DAPI blue). (F) Representative images of colocalization of inflammatory marker TNF and macrophage marker F4/80 in BAT (TNF in FITC green; F4/80 in Texas red; nuclei in DAPI blue). Positively stained inflammatory markers and colocalizations with macrophages are indicated by white arrows. Scale bars, 50 mum.
- Conjugate
- Near infrared dye
- Submitted by
- Invitrogen Antibodies (provider)
- Main image
- Experimental details
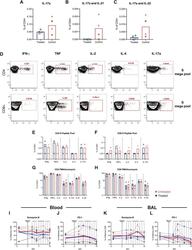
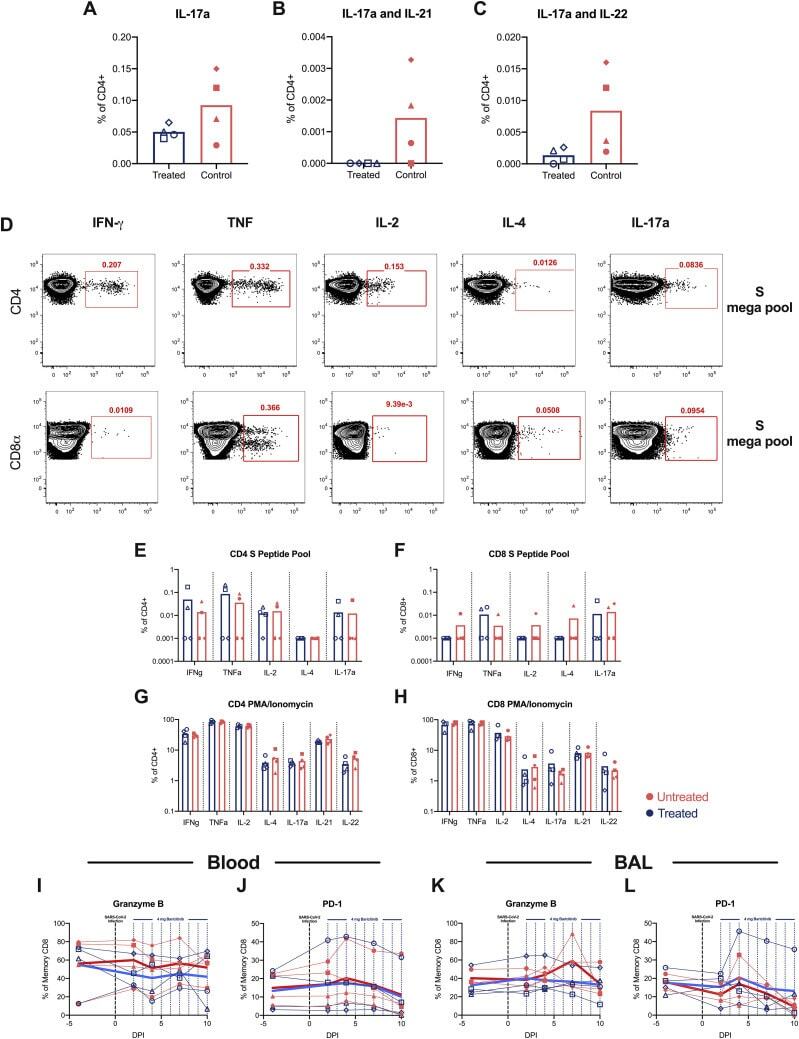
- Figure S7 Baricitinib treatment did not affect the immune T cell responses in SARS-CoV-2-infected RMs, related to Figure 6 (A-C) Frequency of circulating CD4+ T cells spontaneously (without stimulation) producing pro-inflammatory Th17 related cytokines (A) IL-17 + , (B) IL-17 + IL-21 + , (C) IL-17 + IL- 22 + at necropsy (days 10-11 after infection) in baricitinib (blue) and untreated (red) SARS-CoV-2 infected RMs. (D) Representative flow cytometry staining of IFNgamma, TNFalpha, IL-2, IL-4 and IL-17a in CD4 + and CD8 + T cells of a SARS-CoV-2 infected RM following stimulation with SARS-CoV-2 S peptide pool. IFNgamma, Unstimulated background values were subtracted from S peptide stimulated values to determine T cell cytokine. (E and F) IFNgamma, TNFalpha, IL-2, IL-4 and IL-17a frequency levels in (E) CD4 + and (F) CD8 + T cells following stimulation with SARS-CoV-2 S peptide pool. (G-L) IFNgamma, TNFalpha, IL-2, IL-4 and IL-17a frequency levels in (G) CD4 + and (H) CD8 + T cells following stimulation with PMA/Ionomycin. Values from unstimulated controls were subtracted in all cases. Granzyme B and PD-1 levels in (I and J) blood and (K and L) BAL memory CD8 + T cells measured by flow cytometry. Each symbol represents individual animals. Thick lines represent the average of the baricitinib treated (blue line), and untreated groups (red line). Bars represent the average of the treated and untreated groups. Statistical analysis was performed using a non-parametric Mann-Whitney Tes
- Conjugate
- Near infrared dye
- Submitted by
- Invitrogen Antibodies (provider)
- Main image
- Experimental details
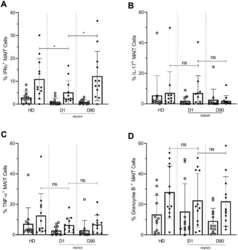
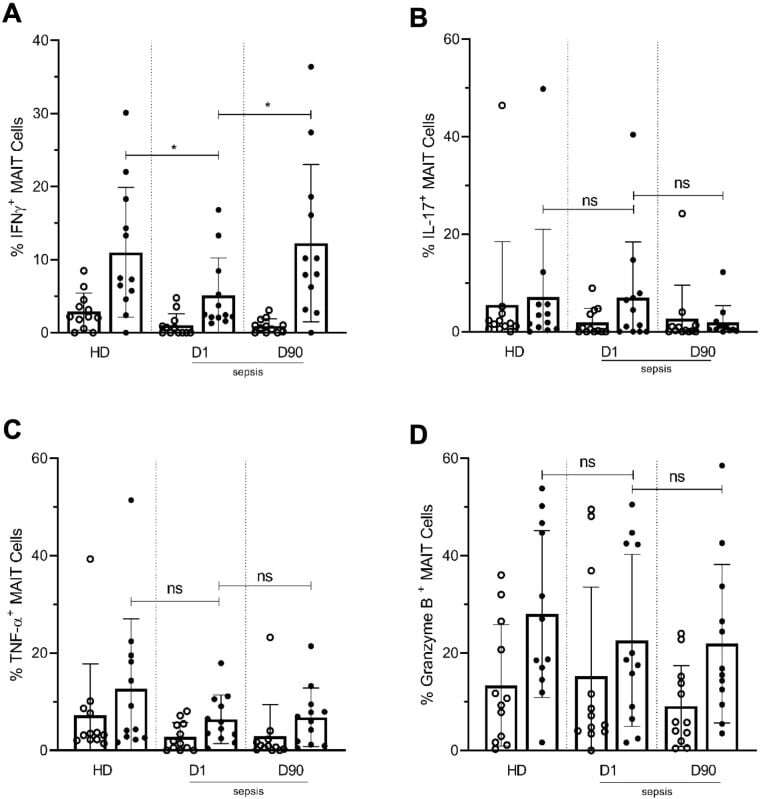
- Figure 7. Lower frequencies of IFNgamma + MAIT cells in day one septic patients compared to HD and Day 90 paired septic patients. PBMCs obtained from septic patients and healthy donors (n = 12 per group) were stimulated with E. coli at moi of 10 and intracellular expression of ( A ) IFN-gamma, ( B ) IL-17, ( C ) TNF-alpha, and ( D ) granzyme B by MAIT cells were analyzed using flow cytometry (open circle shows unstimulated and closed circle shows stimulated data). Data were expressed as mean +- SD of two independent experiments. The Mann-Whitney test was used for comparisons of HD with septic patients and the Wilcoxon test was used for comparisons of paired D1 and D90 samples. ***p
- Conjugate
- Near infrared dye
- Submitted by
- Invitrogen Antibodies (provider)
- Main image
- Experimental details
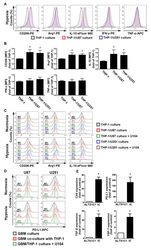
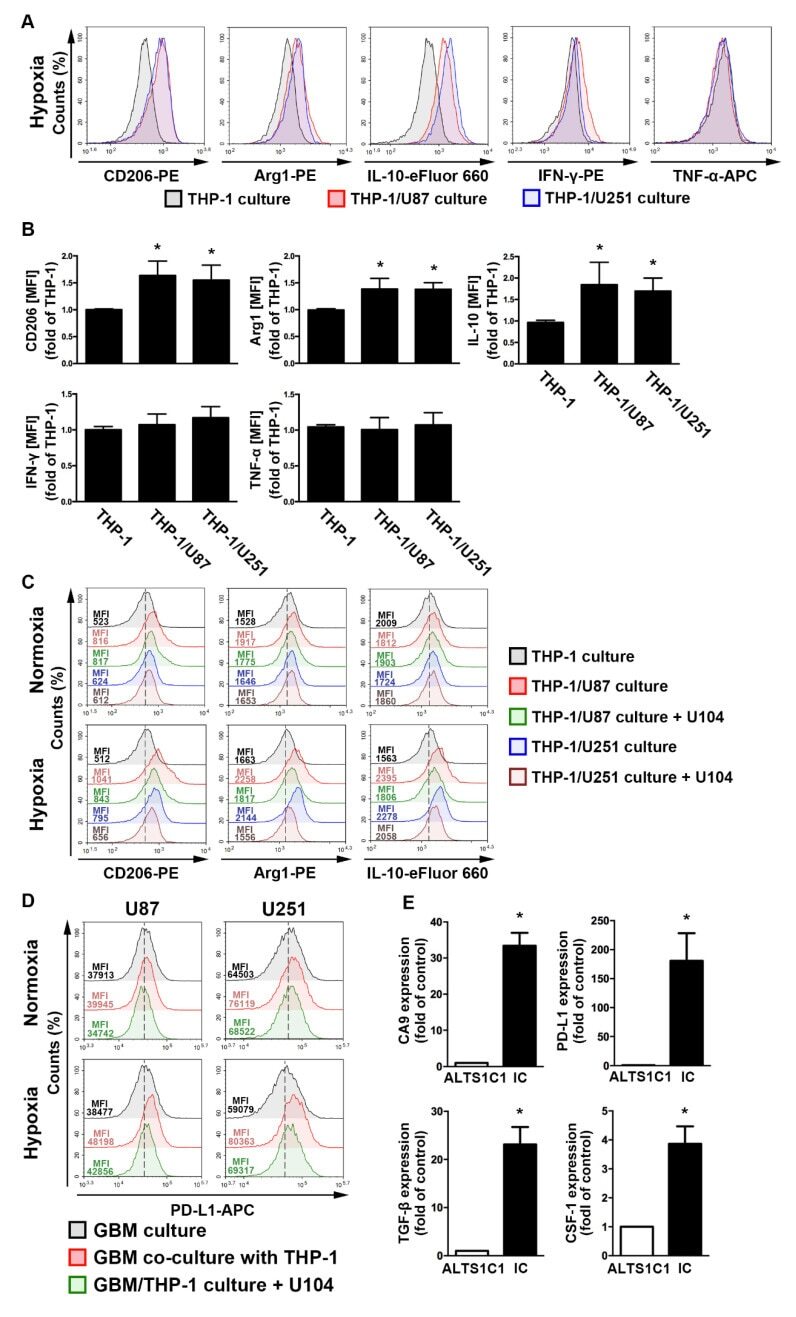
- Figure 4 The polarizations of monocyte and GBM progression in a co-cultured model under hypoxic conditions. ( A ) THP-1 monocytes were co-cultured with U87-green fluorescent protein (GFP) or U251-GFP under hypoxic conditions for 48 h. The co-cultured cells were plotted on a side scatter versus FITC. The THP-1 monocytes (GFP-negative cells) were analyzed to assess the levels of cluster of differentiation (CD) 206, arginase 1 (Arg1), interleukin (IL)-10, interferon (IFN)-gamma, and tumor necrosis factor (TNF)-alpha by flow cytometry. ( B ) The median fluorescence intensity (MFI) of CD206, Arg1, IL-10, IFN-gamma, and TNF-alpha in THP-1 monocytes in the co-cultured model under hypoxic conditions for 48 h. * p < 0.05 compared with the THP-1 monocyte group. Quantitative data are presented as the mean +- standard error (representative of n = 3). ( C ) U87-GFP and U251-GFP were treated with U104 (CAIX inhibitor) and subsequently co-cultured with THP-1 monocytes under hypoxic conditions for 48 h. THP-1 monocytes (GFP-negative cells) were analyzed to assess the levels of CD206, Arg1, and IL-10 by flow cytometry. ( D ) U87-GFP or U251-GFP was treated with U104 and subsequently co-cultured with THP-1 monocytes under hypoxic conditions for 48 h. The co-cultured cells were plotted on a side scatter versus FITC. The GFP-positive gated GBM was analyzed to assess the levels of programmed death ligand 1 (PD-L1) by flow cytometry. ( E ) The levels of CAIX, PD-L1, tumor growth factor-beta, and c
- Conjugate
- Near infrared dye
- Submitted by
- Invitrogen Antibodies (provider)
- Main image

- Experimental details
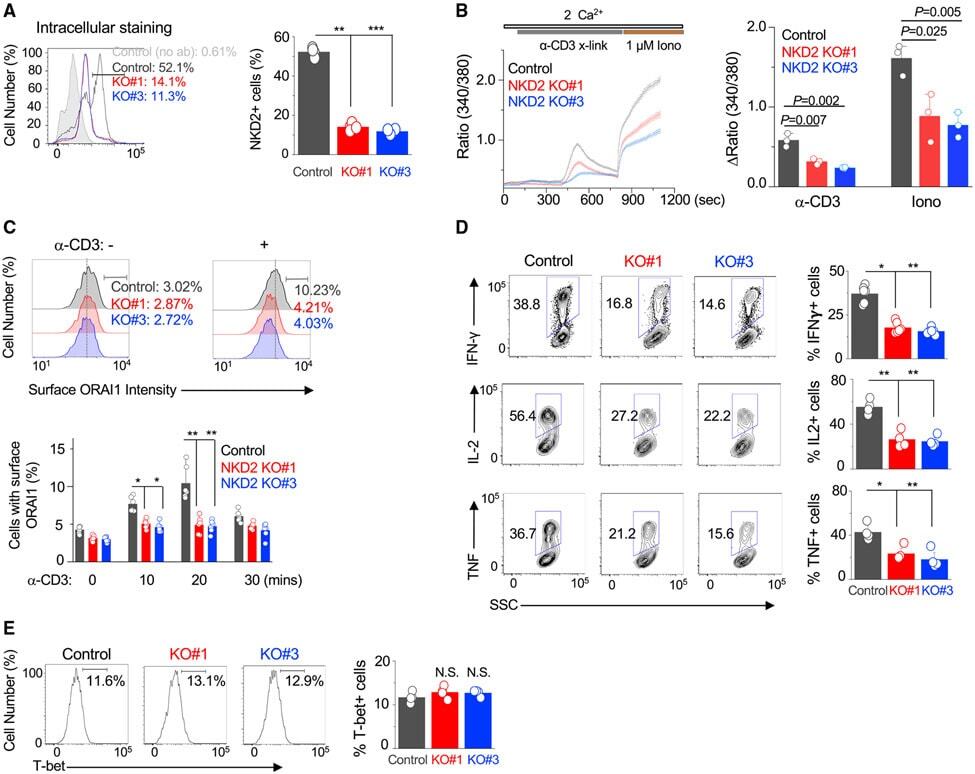
- Figure 6. NKD2-mediated ORAI1 + vesicle trafficking is crucial for the effector function of primary T cells (A) Representative histograms showing levels of NKD2 protein in primary T cells transduced with lentiviral vectors encoding scrambled sgRNA (control), NKD2 sgRNA #1, and NKD2 sgRNA #3, together with those encoding Cas9. Cells were permeabilized and stained with anti-NKD2 Ab. The bar graph (right) shows average (+-SEM) from four independent experiments. (B) Representative traces showing averaged SOCE from primary control (73 cells) and NKD2 KO (KO sgRNA #1, 82 cells; KO sgRNA #3, 71 cells) T cells after TCR stimulation using anti-CD3 Abs, followed by ionomycin treatment in the presence of external solution containing 2 mM Ca 2+ . Bar graph (right) shows averaged baseline-subtracted SOCE (+-SEM) from three independent experiments. (C) Representative histograms showing levels of newly inserted PM-resident ORAI1 protein in primary control and NKD2 KO effector T cells after TCR stimulation. Cells were transduced as described above to induce deletion of NKD2 and stimulated and stained as described in Figure 3B for detection of newly inserted PM-resident ORAI1. Bar graph (right) shows average (+-SEM) of pooled technical replicates from three independent donors. (D) Representative flow plots showing expression of IFN-gamma, IL-2, and TNF in control, NKD2 KO (sgRNA #1), and NKD2 KO (sgRNA #3) cells after re-stimulation with anti-CD3 and anti-CD28 Abs. Bar graph shows means +- SE
- Conjugate
- Near infrared dye
- Submitted by
- Invitrogen Antibodies (provider)
- Main image
- Experimental details
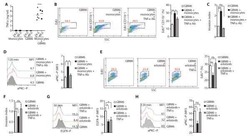
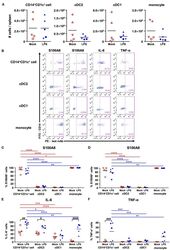
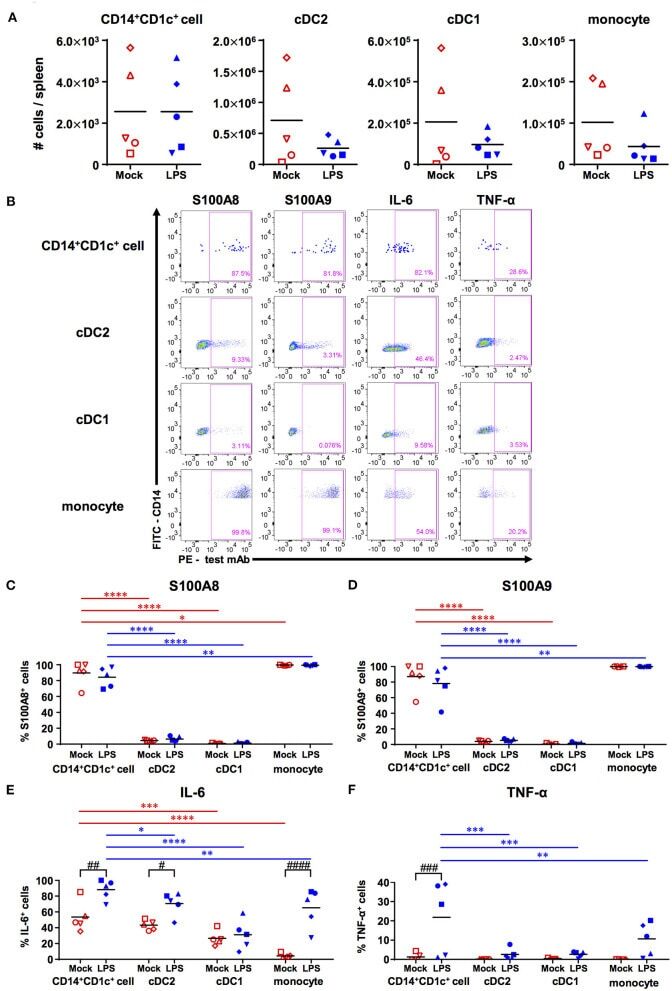
- Figure 4 Responsiveness of human dendritic cell populations in hNOJ mice against LPS-induced acute inflammation. Cells were prepared from the spleen of IVT-hNOJ mice following intraperitoneal LPS injection. (A) Individual absolute cell numbers of CD14 + CD1c + cells, cDC2s, cDC1s, and monocytes within human CD45 + cells (Mock: n = 5, LPS: n = 5). The Mann-Whitney U test was used, and no significant differences were observed. The distinct symbols show each separate hNOJ mouse. (B) Representative flow cytometry profiles of intracellular inflammation-related proteins/cytokines (S100A8, S100A9, IL-6, and TNF-alpha) in cell populations. (C-F) Individual percentages of the cells expressing (C) S100A8, (D) S100A9, (E) IL-6, and (F) TNF-alpha (Mock: n = 5, LPS: n = 5). Significant differences (* P < 0.05, ** P < 0.01, *** P < 0.001, **** P < 0.0001) between CD14 + CD1c + cells and each other subset under the same conditions (red: mock, blue: LPS) were determined using the repeated-measures two-way ANOVA followed by the Holm-Sidak's multiple comparison test. In addition, significant differences ( # P < 0.05, ## P < 0.01, ### P < 0.001, and #### P < 0.0001) between Mock and LPS conditions in same cell subsets were determined by repeated-measures two-way ANOVA followed by the Holm-Sidak's multiple comparison test. The distinct symbols show each separate hNOJ mouse.
- Conjugate
- Near infrared dye
- Submitted by
- Invitrogen Antibodies (provider)
- Main image
- Experimental details
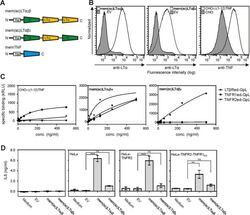
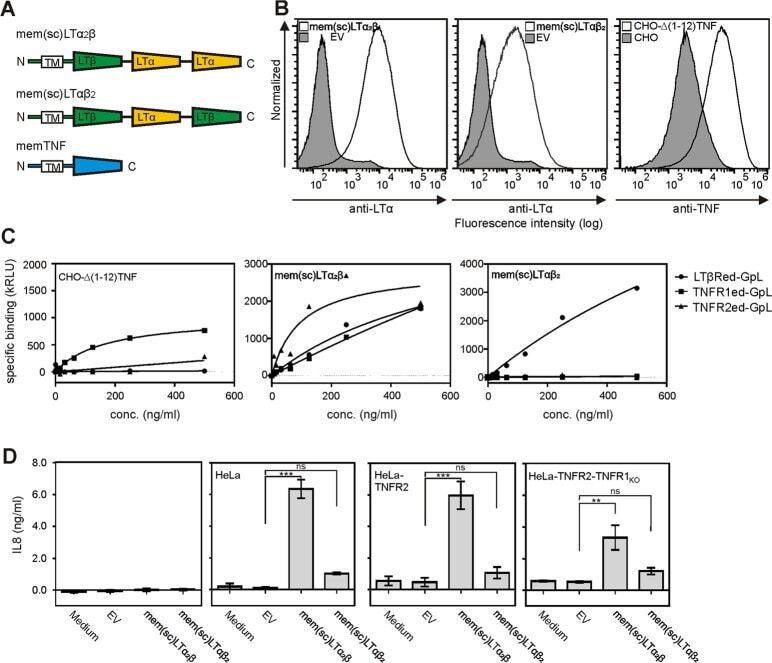
- Fig. 4 mem(sc)LTalpha 2 beta but not mem(sc)LTalphabeta 2 activate TNFR1 and TNFR2. A Scheme of single-chain encoded memLTalphabeta variants and memTNF. B Flow cytometry analysis of Flp-In HEK293 transfectants stably expressing mem(sc)LTalpha 2 beta and mem(sc)LTalphabeta 2 and of a CHO transfectant stably expressing a non-cleavable mutant of memTNF. Empty vector (EV) transfected cells served as negative controls. C The indicated Flp-In HEK293 and CHO-Delta(1-12)TNF cells were analyzed with respect to binding of TNFR1ed-GpL, TNFR2ed-GpL, and LTbetaRed-GpL. One representative experiment of three independent experiments are shown. D HeLa, HeLa-TNFR2, and HeLa-TNFR2-TNFR1 KO cells were cocultured 1:1 (50,000 cells each) with the indicated ligand transfectants. Cell culture supernatants were analyzed the next day for their IL8 content by ELISA. Shown are results from three different experiments. *** p < 0.001; ** p < 0.01; n.s., not significant, repeated-measures ANOVA.
- Conjugate
- Near infrared dye
- Submitted by
- Invitrogen Antibodies (provider)
- Main image
- Experimental details
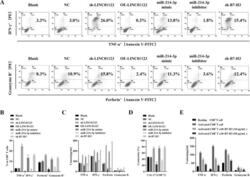
- Fig. 4 Upregulation of LINC01123 or B7-H3 or downregulation of miR-214-3p induces dysfunction of CD8 + T cells. CD8 + T cells were isolated from PBMCs using immunomagnetic beads. After activation and amplification, CD8 + T cells were cocultured with different CAL-27 cell treatment groups. A Expression of TNF-alpha, IFN-gamma, perforin, and granzyme B in CD8 + T-cell population was analyzed with flow cytometry. B Statistical analysis of the results from flow cytometry of CD8 + T cells. C Expression levels of TNF-alpha, IFN-gamma, perforin, and granzyme B in CAL-27-CD8 + T cocultured supernatants, as detected by ELISA. D CCK8 cytotoxicity test of CD8 + T cells. E ELISA was used to assess the immune activity of CD8 + T cells after recombinant human B7-H3 treatment. * P < 0.05 compared with cells without treatment. The experiment was repeated three times.
- Conjugate
- Near infrared dye

- Submitted by
- Invitrogen Antibodies (provider)
- Main image
- Experimental details
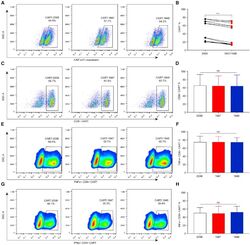
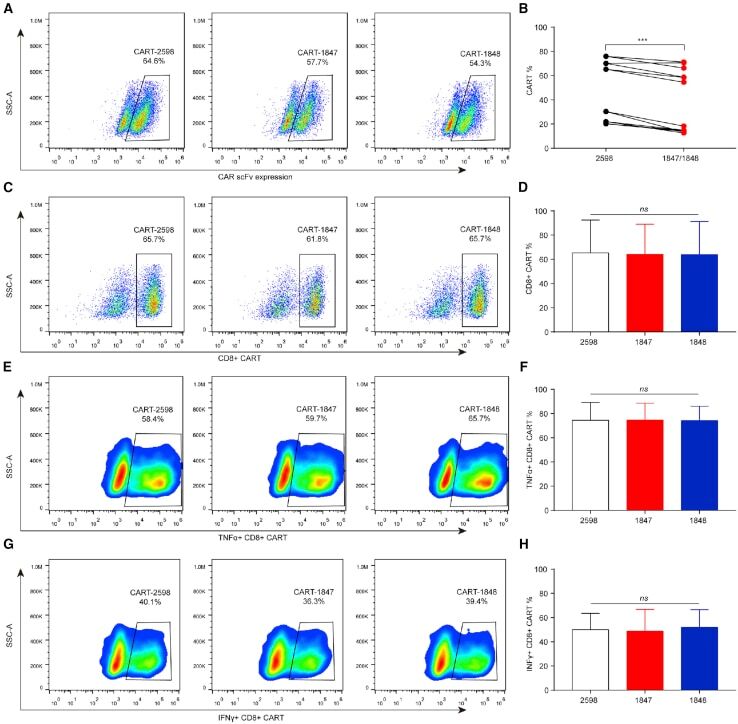
- Figure 3 The Phenotype of Anti-MLSN CAR-T Cells (A-H) Flow cytometry profile showing the (A and B) transduction efficiencies of CAR-T cells and the (C-H) percentage distribution of CD8 + , IFNgamma + CD8 + , and TNF-alpha + CD8 + targeting MSLN CAR-T cells. Representative results from one of six patients are shown. (A and B) The transduction efficiencies of CAR-T-1847 and CAR-T-1848 cells were significantly lower than that of CAR-T-2598 cells ( P < 0.001). (C-H) There were no significant differences in the percentages of CD8 + CAR-T, IFNgamma + CD8 + CAR-T, and TNFalpha + CD8 + CAR-T cells among all three groups ( P > 0.05).
- Conjugate
- Near infrared dye
- Submitted by
- Invitrogen Antibodies (provider)
- Main image
- Experimental details
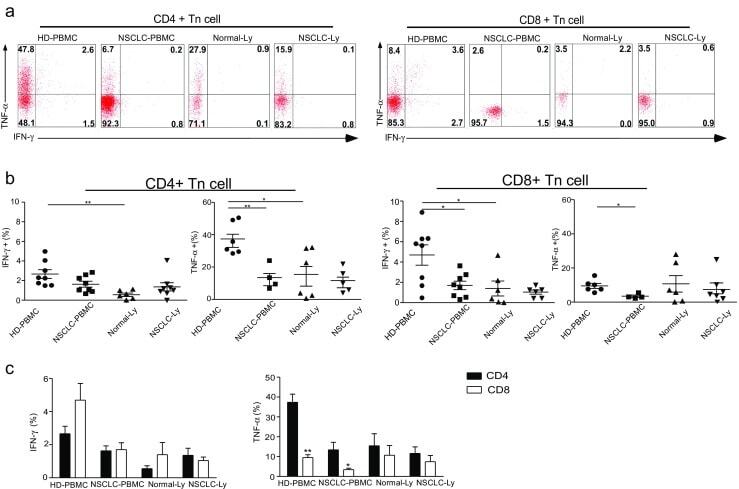
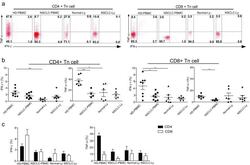
- Fig. 2 IFN-gamma and TNF-alpha production is significantly decreased in the naive CD8 T cells of NSCLC patients. PBMCs or lymphocytes isolated from the blood were stimulated for 4-6 hr with PMA + Ionomycin, and cytokine production was assessed by intracellular cytokine staining (ICS). a Representative ICS analysis of cytokine production by CD4+CD45RA+CCR7+ and CD4-/CD8+CD45RA+CCR7+ T cells in the blood relative to the unstimulated controls. The numbers in the quadrants indicate the percent of CD4+ T cells or CD8+ T cells that produced IFN-gamma, TNF-alpha, IL-17 or both cytokines. b The mean IFN-gamma and TNF-alpha production (+-SEM) of the naive CD4+ T cells ( left ) and CD8+ T cells ( right ) in the blood and lymph node from the non small cell lung cancer patients and healthy donors. * p < 0.05; ** p < 0.005; non-paired Student's t-test. c The events of IFN-gamma, TNF-alpha-expressing CD4+ Tn and CD8+ Tn cells in the blood and lymph node from non small cell lung cancer patients and healthy donors, expressed as the mean +- SEM. * p < 0.05; *** p < 0.001; Mann-Whitney test (two-tailed) and non-paired Student's t-test
- Conjugate
- Near infrared dye