Explore
 Validate
 Learn
Learn Western blot
 Immunocytochemistry
Antibody data
- Antibody Data
- Antigen structure
- References [2]
- Comments [0]
- Validations
- Immunocytochemistry [1]
- Other assay [3]
Submit
Validation data
Reference
Comment
Report error
- Product number
- 14-6519-82 - Provider product page

- Provider
- Invitrogen Antibodies
- Product name
- AGO2 Monoclonal Antibody (AGO2 11A9), eBioscience™
- Antibody type
- Monoclonal
- Antigen
- Synthetic peptide
- Description
- Description: This AGO2 11A9 monoclonal antibody recognizes human Argonaut 2 (Ago2), which has been described as a transcriptional regulator by means of RNA interference and endonucleolytic cleavage. The epitope recognized by AGO2 11A9 detects reduced Ago2 by Western Blot and stains Ago2 in the cytoplasm and nucleus in Immunocytochemistry. Ago2 monoclonal antibody (AGO2 11A9) has been validated for the following applications: Western Blot and Immunocytochemistry; AGO2 11A9 does not cross react with murine Ago2. Applications Reported: This AGO2 11A9 antibody has been reported for use in western blot and immunocytochemistry/immunofluorescence. Applications Tested: This AGO2 11A9 antibody has been tested by western blot using lysates from different human cancer cell lines and by immunocytochemistry/immunofluorescence using fixed human U-2 OS cells. This may be used at less than or equal to 4 µg/mL for western blot and at less than or equal to 1.25 µg/mL for immunocytochemistry/immunofluorescence.
- Reactivity
- Human
- Host
- Rat
- Isotype
- IgG
- Antibody clone number
- AGO2 11A9
- Vial size
- 100 μg
- Concentration
- 0.5 mg/mL
- Storage
- 4°C, do not freeze
Submitted references Silencing of Ago-2 Interacting Protein SERBP1 Relieves KCC2 Repression by miR-92 in Neurons.
No evidence for Ago2 translocation from the host erythrocyte into the Plasmodium parasite.
Barbato C, Frisone P, Braccini L, D'Aguanno S, Pieroni L, Ciotti MT, Catalanotto C, Cogoni C, Ruberti F
Cells 2022 Mar 20;11(6)
Cells 2022 Mar 20;11(6)
No evidence for Ago2 translocation from the host erythrocyte into the Plasmodium parasite.
Hentzschel F, Obrova K, Marti M
Wellcome open research 2020;5:92
Wellcome open research 2020;5:92
No comments: Submit comment
Supportive validation
- Submitted by
- Invitrogen Antibodies (provider)
- Main image
- Experimental details
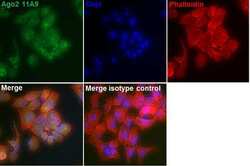
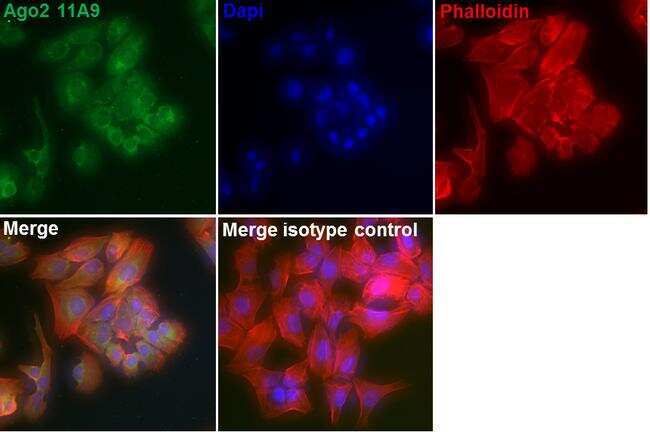
- Immunofluorescent analysis of Ago2 (green) in U-2 OS cells (45% confluency). The cells were fixed with 4% paraformaldehyde for 15 minutes at room temperature, permeabilized with 1% Triton X-100 for 30 minutes at 37 C and blocked with 10% Normal Goat Serum in PBS with 0.1% Triton X-100 for 1 hour at room temperature. Cells were stained with the Ago2 Monoclonal Antibody (Product # 14-6519-82) at a concentration of 1.25 µg/mL or Rat IgG2a Isotype Control at 4 C overnight in blocking buffer followed by a Goat anti-Rat IgG (H+L) Superclonal Secondary Antibody, Alexa Fluor 488 conjugate (Product # A11006) at a dilution of 4 µg/mL in blocking buffer for 1 hour at room temperature. Nuclei (blue) were stained with Fluoromount G with DAPI (Product # 00-4959) and the cytoskeleton was visualized using Rhodamine Phalloidin (red) (Product # R415).
Supportive validation
- Submitted by
- Invitrogen Antibodies (provider)
- Main image
- Experimental details
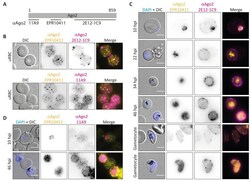
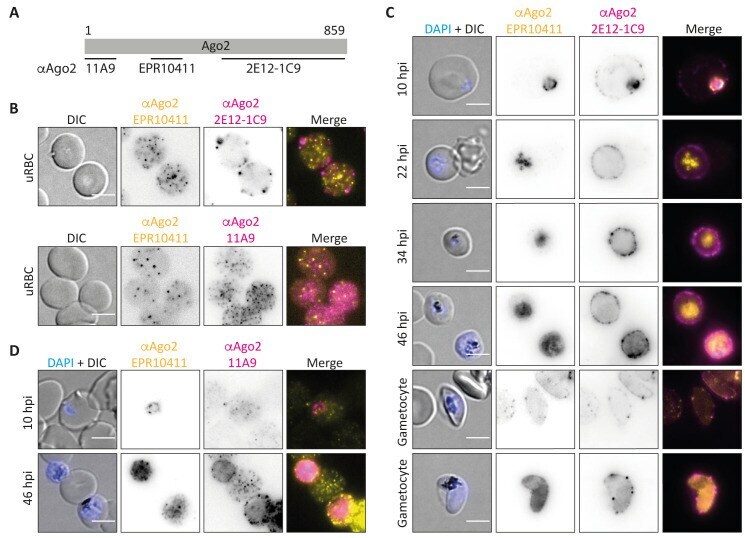
- Figure 2. Further analysis of Ago2 localization to the iRBC. ( A ) Binding sites of alphaAgo2 antibodies used. The monoclonal antibodies 11A9 and EPR10411 were raised against an N-terminal and a centrally located peptide epitope, respectively. The antibody 2E12-1C9 is a monoclonal antibody raised against the whole C-terminus of hAgo2. ( B ) IFA of uninfected RBCs. Yellow: Ago2 (EPR10411), magenta: Ago2 (either 2E12-1C9 (top) or 11A9 (bottom)). ( C ) IFA of P. falciparum 2004 parasites at 10, 22, 34 and 46 hours post invasion (hpi) and mature Pf NF54 gametocytes. Yellow: Ago2 (EPR10411), magenta: Ago2 (2E12-1C9). Contrast and brightness of EPR10411 panels were individually adjusted to optimise image quality, thus, signal strength cannot be compared between panels. ( D ) IFA of P. falciparum 2004 parasites at 10 and 46 hpi. Yellow: Ago2 (EPR10411), magenta: Ago2 (11A9). Nuclei were stained with Hoechst (blue). Images were taken on a Leica widefield microscope (60x objective). Representative images of at least 5 per condition are shown. Controls using only a secondary antibody revealed no unspecific staining. Scale bar indicates 5 um.
- Submitted by
- Invitrogen Antibodies (provider)
- Main image
- Experimental details
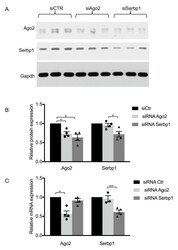
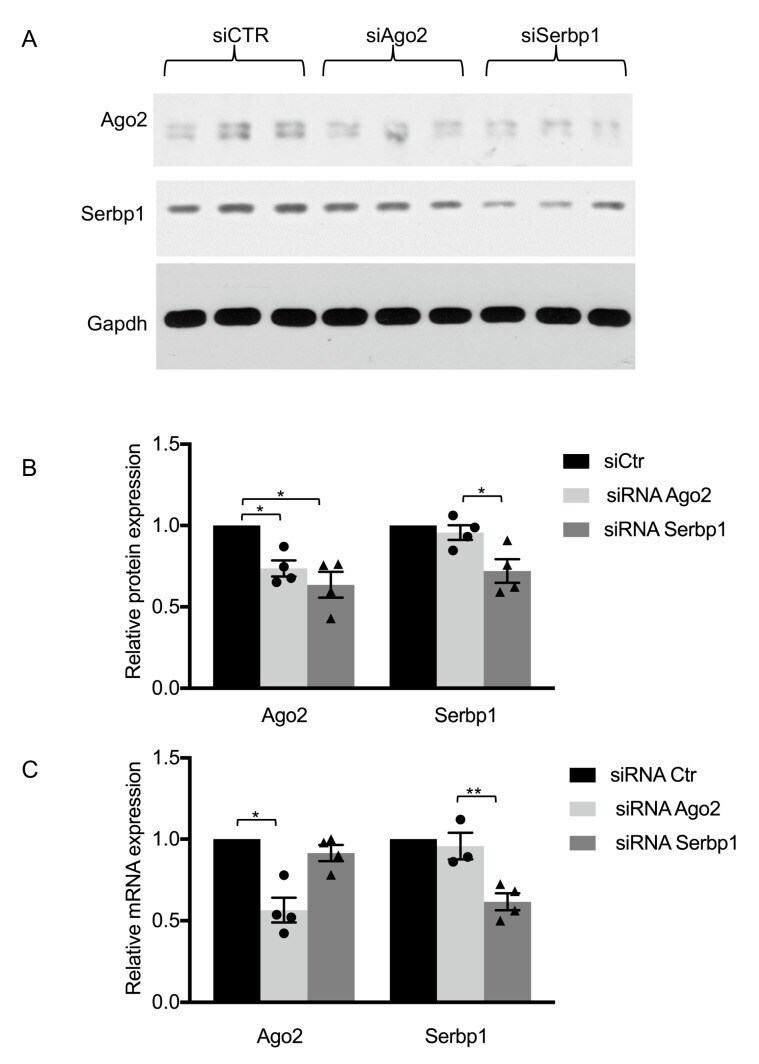
- Figure 2 SERBP1-silencing downregulates Ago2 protein levels in SH-SY5Y cells. ( A ) Representative Western blot of extracts from cells transfected with control siRNA, Ago2 siRNA or SERBP1 siRNA from three independent experiments. Nitrocellulose membranes were hybridized with Ago2 or SERBP1 antibodies, as indicated. The GAPDH signal was used to normalize different samples ( B ). Fold change of Ago2 and SERBP1 protein levels in siRNA transfected cells relative to control siRNA samples are shown. Data represent the mean of three independent experiments +- standard error (S.E. ); * p < 0.05 ( t -test).. ( C ) RT-qPCR analysis of RNA extracted from SH-SY5Y cells transfected with control siRNA, Ago2 siRNA or SERBP1 siRNA. DeltaCt values were normalized to TBP level. Fold change of Ago2 and Serbp1 mRNA expression levels relative to control siRNA samples are shown. Individual data points for Ago2 (circles) and Serbp1 (triangles) siRNA transfected cells are indicated. Data represent the mean of three independent experiments +- S.E. ; * p < 0.05, ** p < 0.01.
- Submitted by
- Invitrogen Antibodies (provider)
- Main image

- Experimental details
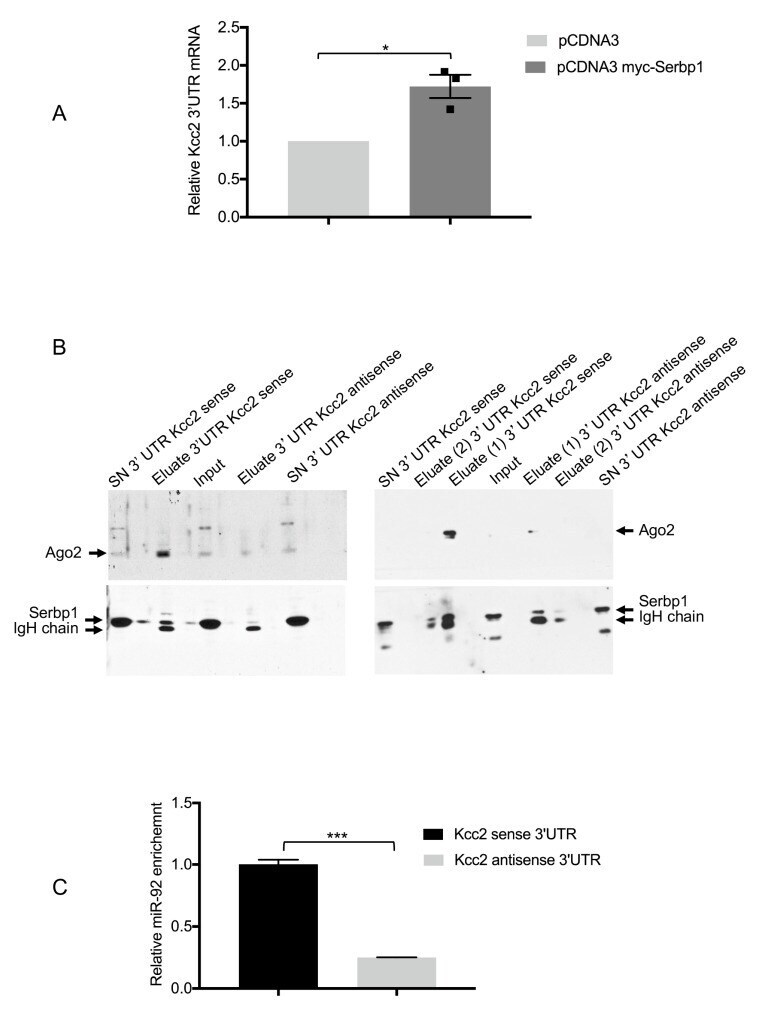
- Figure 4 SERBP1 interacts with KCC2 3'UTR. ( A ) SH-SY5Y cells were co-transfected with pCDNA3-myc or pCDNA3 myc-SERBP1 together with KCC2 3'UTR. Immunoprecipitates were analyzed by qRT-PCR to determine the levels of KCC2 mRNA in the two different conditions. Data represent the mean of three independent experiments +- S.E. ; * p < 0.05. Individual data points for pcDNA3 myc-Serbp1 (squares) transfected cells are shown. ( B ) Western blotting showing Ago2 and SERBP1 protein levels in the input, eluates and supernatants from cytoplasmic lysates of SH-SY5Y cells (left panels) or hippocampal neurons (right panels) incubated with KCC2 sense or antisense 3'UTR transcripts. Eluate (1) and eluate (2) indicate the first and second elution. ( C ) Levels of miR-92 bound to KCC2 sense or antisense 3'UTR transcripts were analyzed by qRT-PCR. DeltaCt values were normalized to the snU6 level *** p < 0.001.