Explore
 Validate
 Learn
Learn Western blot
 ELISA
ELISAAntibody data
- Antibody Data
- Antigen structure
- References [17]
- Comments [0]
- Validations
- Western blot [3]
- Immunocytochemistry [2]
- Other assay [20]
Submit
Validation data
Reference
Comment
Report error
- Product number
- MA1-83977 - Provider product page

- Provider
- Invitrogen Antibodies
- Product name
- Alix Monoclonal Antibody (3A9)
- Antibody type
- Monoclonal
- Antigen
- Other
- Description
- This product does not require protein digestion pre-treatment of paraffin sections. A ~100kD band is detected by Western blot. Mouse anti ALIX antibody, clone 3A9 recognizes the apoptosis-linked gene-2 interacting protein X (ALIX), also known as Programmed cell death 6-interacting protein or Hp95.
- Reactivity
- Human, Mouse, Rat, Xenopus
- Host
- Mouse
- Isotype
- IgG
- Antibody clone number
- 3A9
- Vial size
- 100 μg
- Concentration
- 1 mg/mL
- Storage
- Store at 4°C short term. For long term storage, store at -20°C, avoiding freeze/thaw cycles.
Submitted references In vitro reconstitution of calcium-dependent recruitment of the human ESCRT machinery in lysosomal membrane repair.
Muscle cells of sporadic amyotrophic lateral sclerosis patients secrete neurotoxic vesicles.
Extracellular Vesicles Secreted by Mesenchymal Stromal Cells Exert Opposite Effects to Their Cells of Origin in Murine Sodium Dextran Sulfate-Induced Colitis.
Porphyromonas gingivalis Provokes Exosome Secretion and Paracrine Immune Senescence in Bystander Dendritic Cells.
Antisense oligonucleotide activity in tumour cells is influenced by intracellular LBPA distribution and extracellular vesicle recycling.
Extracellular Vesicle Capture by AnTibody of CHoice and Enzymatic Release (EV-CATCHER): A customizable purification assay designed for small-RNA biomarker identification and evaluation of circulating small-EVs.
Cerebral endothelial cell-derived small extracellular vesicles enhance neurovascular function and neurological recovery in rat acute ischemic stroke models of mechanical thrombectomy and embolic stroke treatment with tPA.
Restoration of lysosomal function after damage is accompanied by recycling of lysosomal membrane proteins.
A CRISPR-Cas9-based reporter system for single-cell detection of extracellular vesicle-mediated functional transfer of RNA.
Oral cancer cell‑derived exosomes modulate natural killer cell activity by regulating the receptors on these cells.
Assessment of methods for serum extracellular vesicle small RNA sequencing to support biomarker development.
Alpha-synuclein is strategically positioned for afferent modulation of midbrain dopamine neurons and is essential for cocaine preference.
Exosomes From Astrocyte Processes: Signaling to Neurons.
CCL2 mobilizes ALIX to facilitate Gag-p6 mediated HIV-1 virion release.
AQP1-Containing Exosomes in Peritoneal Dialysis Effluent As Biomarker of Dialysis Efficiency.
Acidic microenvironment plays a key role in human melanoma progression through a sustained exosome mediated transfer of clinically relevant metastatic molecules.
Microenvironmental pH and Exosome Levels Interplay in Human Cancer Cell Lines of Different Histotypes.
Shukla S, Larsen KP, Ou C, Rose K, Hurley JH
Proceedings of the National Academy of Sciences of the United States of America 2022 Aug 30;119(35):e2205590119
Proceedings of the National Academy of Sciences of the United States of America 2022 Aug 30;119(35):e2205590119
Muscle cells of sporadic amyotrophic lateral sclerosis patients secrete neurotoxic vesicles.
Le Gall L, Duddy WJ, Martinat C, Mariot V, Connolly O, Milla V, Anakor E, Ouandaogo ZG, Millecamps S, Lainé J, Vijayakumar UG, Knoblach S, Raoul C, Lucas O, Loeffler JP, Bede P, Behin A, Blasco H, Bruneteau G, Del Mar Amador M, Devos D, Henriques A, Hesters A, Lacomblez L, Laforet P, Langlet T, Leblanc P, Le Forestier N, Maisonobe T, Meininger V, Robelin L, Salachas F, Stojkovic T, Querin G, Dumonceaux J, Butler Browne G, González De Aguilar JL, Duguez S, Pradat PF
Journal of cachexia, sarcopenia and muscle 2022 Apr;13(2):1385-1402
Journal of cachexia, sarcopenia and muscle 2022 Apr;13(2):1385-1402
Extracellular Vesicles Secreted by Mesenchymal Stromal Cells Exert Opposite Effects to Their Cells of Origin in Murine Sodium Dextran Sulfate-Induced Colitis.
Tolomeo AM, Castagliuolo I, Piccoli M, Grassi M, Magarotto F, De Lazzari G, Malvicini R, Caicci F, Franzin C, Scarpa M, Macchi V, De Caro R, Angriman I, Viola A, Porzionato A, Pozzobon M, Muraca M
Frontiers in immunology 2021;12:627605
Frontiers in immunology 2021;12:627605
Porphyromonas gingivalis Provokes Exosome Secretion and Paracrine Immune Senescence in Bystander Dendritic Cells.
Elsayed R, Elashiry M, Liu Y, El-Awady A, Hamrick M, Cutler CW
Frontiers in cellular and infection microbiology 2021;11:669989
Frontiers in cellular and infection microbiology 2021;11:669989
Antisense oligonucleotide activity in tumour cells is influenced by intracellular LBPA distribution and extracellular vesicle recycling.
Kapustin AN, Davey P, Longmire D, Matthews C, Linnane E, Rustogi N, Stavrou M, Devine PWA, Bond NJ, Hanson L, Sonzini S, Revenko A, MacLeod AR, Ross S, Chiarparin E, Puri S
Communications biology 2021 Nov 1;4(1):1241
Communications biology 2021 Nov 1;4(1):1241
Extracellular Vesicle Capture by AnTibody of CHoice and Enzymatic Release (EV-CATCHER): A customizable purification assay designed for small-RNA biomarker identification and evaluation of circulating small-EVs.
Mitchell MI, Ben-Dov IZ, Liu C, Ye K, Chow K, Kramer Y, Gangadharan A, Park S, Fitzgerald S, Ramnauth A, Perlin DS, Donato M, Bhoy E, Manouchehri Doulabi E, Poulos M, Kamali-Moghaddam M, Loudig O
Journal of extracellular vesicles 2021 Jun;10(8):e12110
Journal of extracellular vesicles 2021 Jun;10(8):e12110
Cerebral endothelial cell-derived small extracellular vesicles enhance neurovascular function and neurological recovery in rat acute ischemic stroke models of mechanical thrombectomy and embolic stroke treatment with tPA.
Li C, Wang C, Zhang Y, Alsrouji OK, Chebl AB, Ding G, Jiang Q, Mayer SA, Lu M, Kole MK, Marin HL, Zhang L, Chopp M, Zhang ZG
Journal of cerebral blood flow and metabolism : official journal of the International Society of Cerebral Blood Flow and Metabolism 2021 Aug;41(8):2090-2104
Journal of cerebral blood flow and metabolism : official journal of the International Society of Cerebral Blood Flow and Metabolism 2021 Aug;41(8):2090-2104
Restoration of lysosomal function after damage is accompanied by recycling of lysosomal membrane proteins.
Eriksson I, Wäster P, Öllinger K
Cell death & disease 2020 May 14;11(5):370
Cell death & disease 2020 May 14;11(5):370
A CRISPR-Cas9-based reporter system for single-cell detection of extracellular vesicle-mediated functional transfer of RNA.
de Jong OG, Murphy DE, Mäger I, Willms E, Garcia-Guerra A, Gitz-Francois JJ, Lefferts J, Gupta D, Steenbeek SC, van Rheenen J, El Andaloussi S, Schiffelers RM, Wood MJA, Vader P
Nature communications 2020 Feb 28;11(1):1113
Nature communications 2020 Feb 28;11(1):1113
Oral cancer cell‑derived exosomes modulate natural killer cell activity by regulating the receptors on these cells.
Zhu X, Qin X, Wang X, Wang Y, Cao W, Zhang J, Chen W
International journal of molecular medicine 2020 Dec;46(6):2115-2125
International journal of molecular medicine 2020 Dec;46(6):2115-2125
Assessment of methods for serum extracellular vesicle small RNA sequencing to support biomarker development.
Srinivasan S, Duval MX, Kaimal V, Cuff C, Clarke SH
Journal of extracellular vesicles 2019;8(1):1684425
Journal of extracellular vesicles 2019;8(1):1684425
Alpha-synuclein is strategically positioned for afferent modulation of midbrain dopamine neurons and is essential for cocaine preference.
Trubetckaia O, Lane AE, Qian L, Zhou P, Lane DA
Communications biology 2019;2:418
Communications biology 2019;2:418
Exosomes From Astrocyte Processes: Signaling to Neurons.
Venturini A, Passalacqua M, Pelassa S, Pastorino F, Tedesco M, Cortese K, Gagliani MC, Leo G, Maura G, Guidolin D, Agnati LF, Marcoli M, Cervetto C
Frontiers in pharmacology 2019;10:1452
Frontiers in pharmacology 2019;10:1452
CCL2 mobilizes ALIX to facilitate Gag-p6 mediated HIV-1 virion release.
Ajasin DO, Rao VR, Wu X, Ramasamy S, Pujato M, Ruiz AP, Fiser A, Bresnick AR, Kalpana GV, Prasad VR
eLife 2019 Jun 7;8
eLife 2019 Jun 7;8
AQP1-Containing Exosomes in Peritoneal Dialysis Effluent As Biomarker of Dialysis Efficiency.
Corciulo S, Nicoletti MC, Mastrofrancesco L, Milano S, Mastrodonato M, Carmosino M, Gerbino A, Corciulo R, Russo R, Svelto M, Gesualdo L, Procino G
Cells 2019 Apr 9;8(4)
Cells 2019 Apr 9;8(4)
Acidic microenvironment plays a key role in human melanoma progression through a sustained exosome mediated transfer of clinically relevant metastatic molecules.
Boussadia Z, Lamberti J, Mattei F, Pizzi E, Puglisi R, Zanetti C, Pasquini L, Fratini F, Fantozzi L, Felicetti F, Fecchi K, Raggi C, Sanchez M, D'Atri S, Carè A, Sargiacomo M, Parolini I
Journal of experimental & clinical cancer research : CR 2018 Oct 5;37(1):245
Journal of experimental & clinical cancer research : CR 2018 Oct 5;37(1):245
Microenvironmental pH and Exosome Levels Interplay in Human Cancer Cell Lines of Different Histotypes.
Logozzi M, Mizzoni D, Angelini DF, Di Raimo R, Falchi M, Battistini L, Fais S
Cancers 2018 Oct 5;10(10)
Cancers 2018 Oct 5;10(10)
No comments: Submit comment
Supportive validation
- Submitted by
- Invitrogen Antibodies (provider)
- Main image
- Experimental details
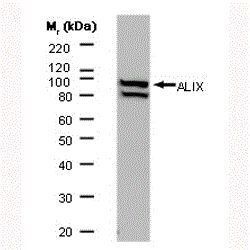
- Western blot analysis of HeLa whole cell lysate probed with a Alix monoclonal antibody (Product # MA1-83977) and followed by F (ab')2 Rabbit a mouse IgG, HRP conjugated secondary antibody.
- Submitted by
- Invitrogen Antibodies (provider)
- Main image
- Experimental details
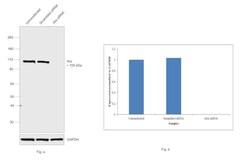
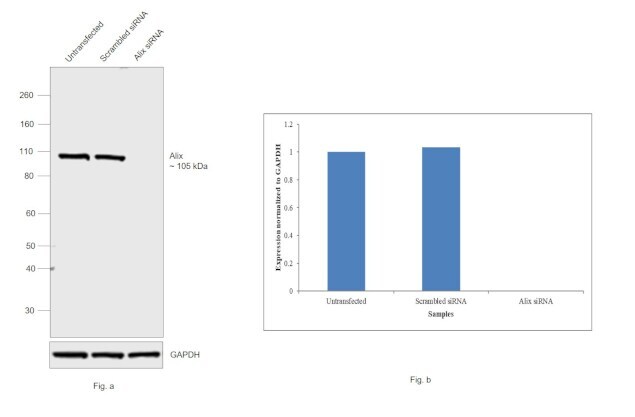
- KD of Alix was achieved by transfecting HeLa with Alix specific siRNAs (Silencer® select Product # s19466, s19465). Western blot analysis (Fig. a) was performed using whole cell extracts from the Alix KD cells (Lane 3), non-specific scrambled siRNA transfected cells (Lane 2) and untransfected cells (Lane 1). The blot was probed with Alix Monoclonal Antibody (3A9) (Product # MA1-83977, 1:500 dilution) and Goat anti-Mouse IgG (H+L) Superclonal™ Secondary Antibody, HRP conjugate (Product # A28177, 0.25µg/mL, 1:4000 dilution). Densitometric analysis of this western blot is shown in histogram (Fig. b). Loss in signal upon siRNA mediated knock down confirms that antibody is specific to Alix..
- Submitted by
- Invitrogen Antibodies (provider)
- Main image
- Experimental details
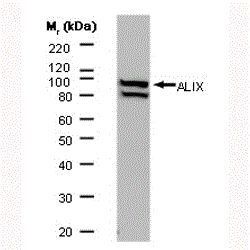
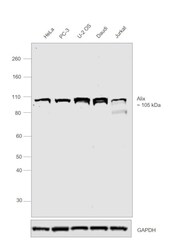
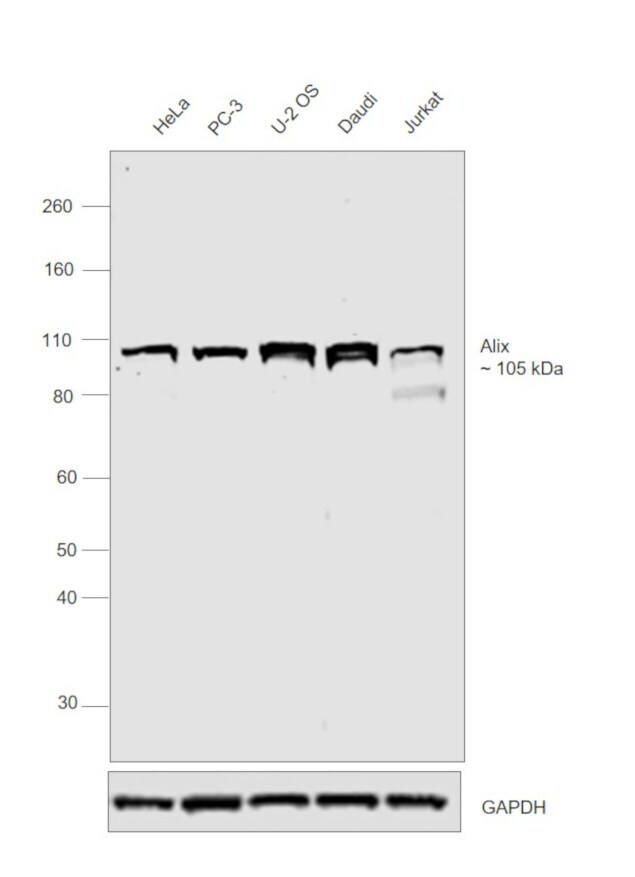
- Western blot was performed using Anti-Alix Monoclonal Antibody (3A9) (Product # MA1-83977) and a 105 kDa band corresponding to Alix was observed across cell lines tested. Whole cell extracts (30 µg lysate) of HeLa (Lane 1), PC-3 (Lane 2), U-2OS (Lane 3), Daudi (Lane 4) and Jurkat (Lane 5) were electrophoresed using Novex® NuPAGE® 4-12 % Bis-Tris gel (Product # NP0322BOX). Resolved proteins were then transferred onto a nitrocellulose membrane (Product # IB23001) by iBlot® 2 Dry Blotting System (Product # IB21001). The blot was probed with the primary antibody (1:500 dilution) and detected by chemiluminescence Goat anti Mouse IgG (H+L) Superclonal™ Secondary Antibody, HRP conjugate (Product # A28177, 1:4000 dilution) using the iBright FL 1000 (Product # A32752). Chemiluminescent detection was performed using Novex® ECL Chemiluminescent Substrate Reagent Kit (Product # WP20005)..
Supportive validation
- Submitted by
- Invitrogen Antibodies (provider)
- Main image

- Experimental details
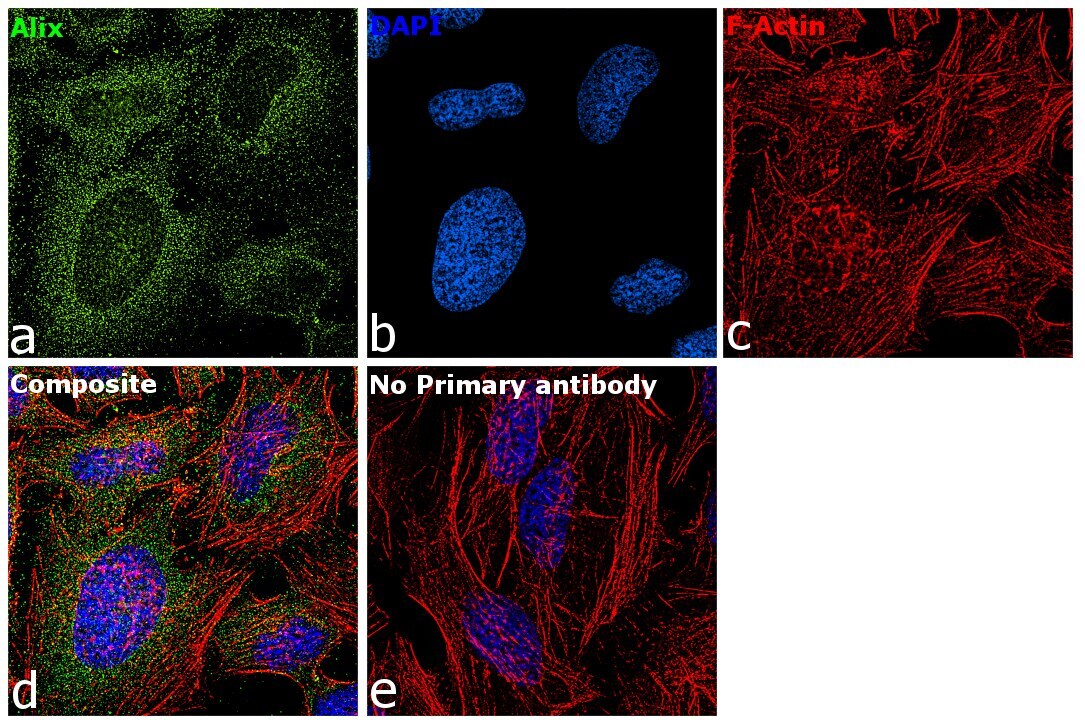
- Immunofluorescence analysis of Alix was performed using 70% confluent log phase HeLa cells. The cells were fixed with 4% paraformaldehyde for 10 minutes, permeabilized with 0.1% Triton™ X-100 for 15 minutes, and blocked with 2% BSA for 1 hour at room temperature. The cells were labeled with Alix Monoclonal Antibody (3A9) (Product # MA1-83977) at 5µg/mL in 0.1% BSA, incubated at 4 degree Celsius overnight and then with Goat anti-Mouse IgG (H+L) Superclonal™ Secondary Antibody, Alexa Fluor® 488 conjugate (Product # A28175) at a dilution of 1:2000 for 45 minutes at room temperature (Panel a: green). Nuclei (Panel b: blue) were stained with SlowFade® Gold Antifade Mountant with DAPI (Product # S36938). F-actin (Panel c: red) was stained with Rhodamine Phalloidin (Product # R415, 1:300). Panel d represents the merged image showing staining in cytosol. Panel e represents control cells with no primary antibody to assess background. The images were captured at 60X magnification..
- Submitted by
- Invitrogen Antibodies (provider)
- Main image

- Experimental details
- Immunofluorescence analysis of Alix was performed using 70% confluent log phase HeLa cells. The cells were fixed with 4% paraformaldehyde for 10 minutes, permeabilized with 0.1% Triton™ X-100 for 15 minutes, and blocked with 2% BSA for 1 hour at room temperature. The cells were labeled with Alix Monoclonal Antibody (3A9) (Product # MA1-83977) at 5µg/mL in 0.1% BSA, incubated at 4 degree Celsius overnight and then with Goat anti-Mouse IgG (H+L) Superclonal™ Secondary Antibody, Alexa Fluor® 488 conjugate (Product # A28175) at a dilution of 1:2000 for 45 minutes at room temperature (Panel a: green). Nuclei (Panel b: blue) were stained with SlowFade® Gold Antifade Mountant with DAPI (Product # S36938). F-actin (Panel c: red) was stained with Rhodamine Phalloidin (Product # R415, 1:300). Panel d represents the merged image showing staining in cytosol. Panel e represents control cells with no primary antibody to assess background. The images were captured at 60X magnification..

Supportive validation
- Submitted by
- Invitrogen Antibodies (provider)
- Main image
- Experimental details
- NULL
- Submitted by
- Invitrogen Antibodies (provider)
- Main image

- Experimental details
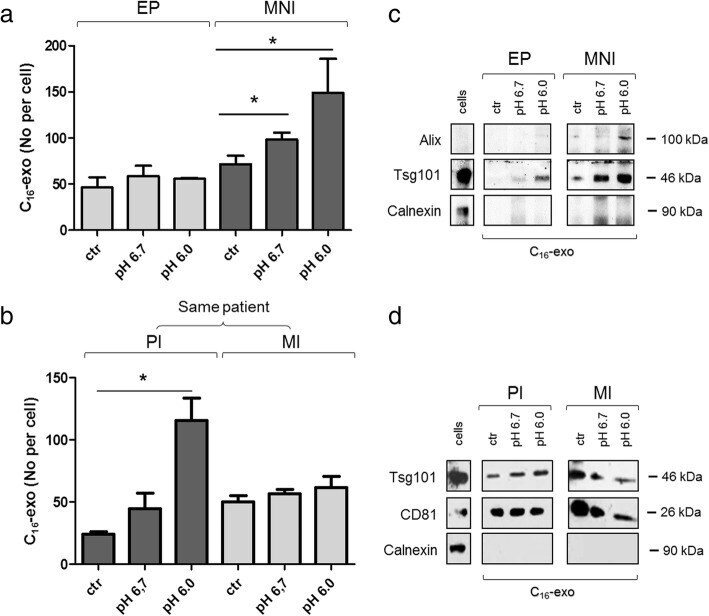
- Fig. 3 Analysis of C 16 -exo secreted in control or acidic conditions. a and b EP, MNI, PI and MI cells were treated with C 16 (7 mum) for 5 h and then cultured in control or acid (pH 6.0 or pH 6.7) medium for 24 h. Hereafter conditioned medium was subjected to ultracentrifugation for exosome isolation. Fluorescent vesicles were then counted by FACS. The graph shows the number of secreted C 16 -exo per cell. c and d Western blot analysis of exosome for the presence of principal exosome markers (Alix, Tsg101 and CD81) and the absence of Calnexin, a marker of ER used as a negative control. Data shown are representative of three independent experiments. * p < 0.05
- Submitted by
- Invitrogen Antibodies (provider)
- Main image
- Experimental details
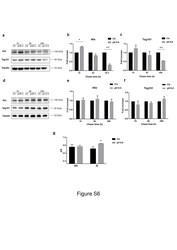
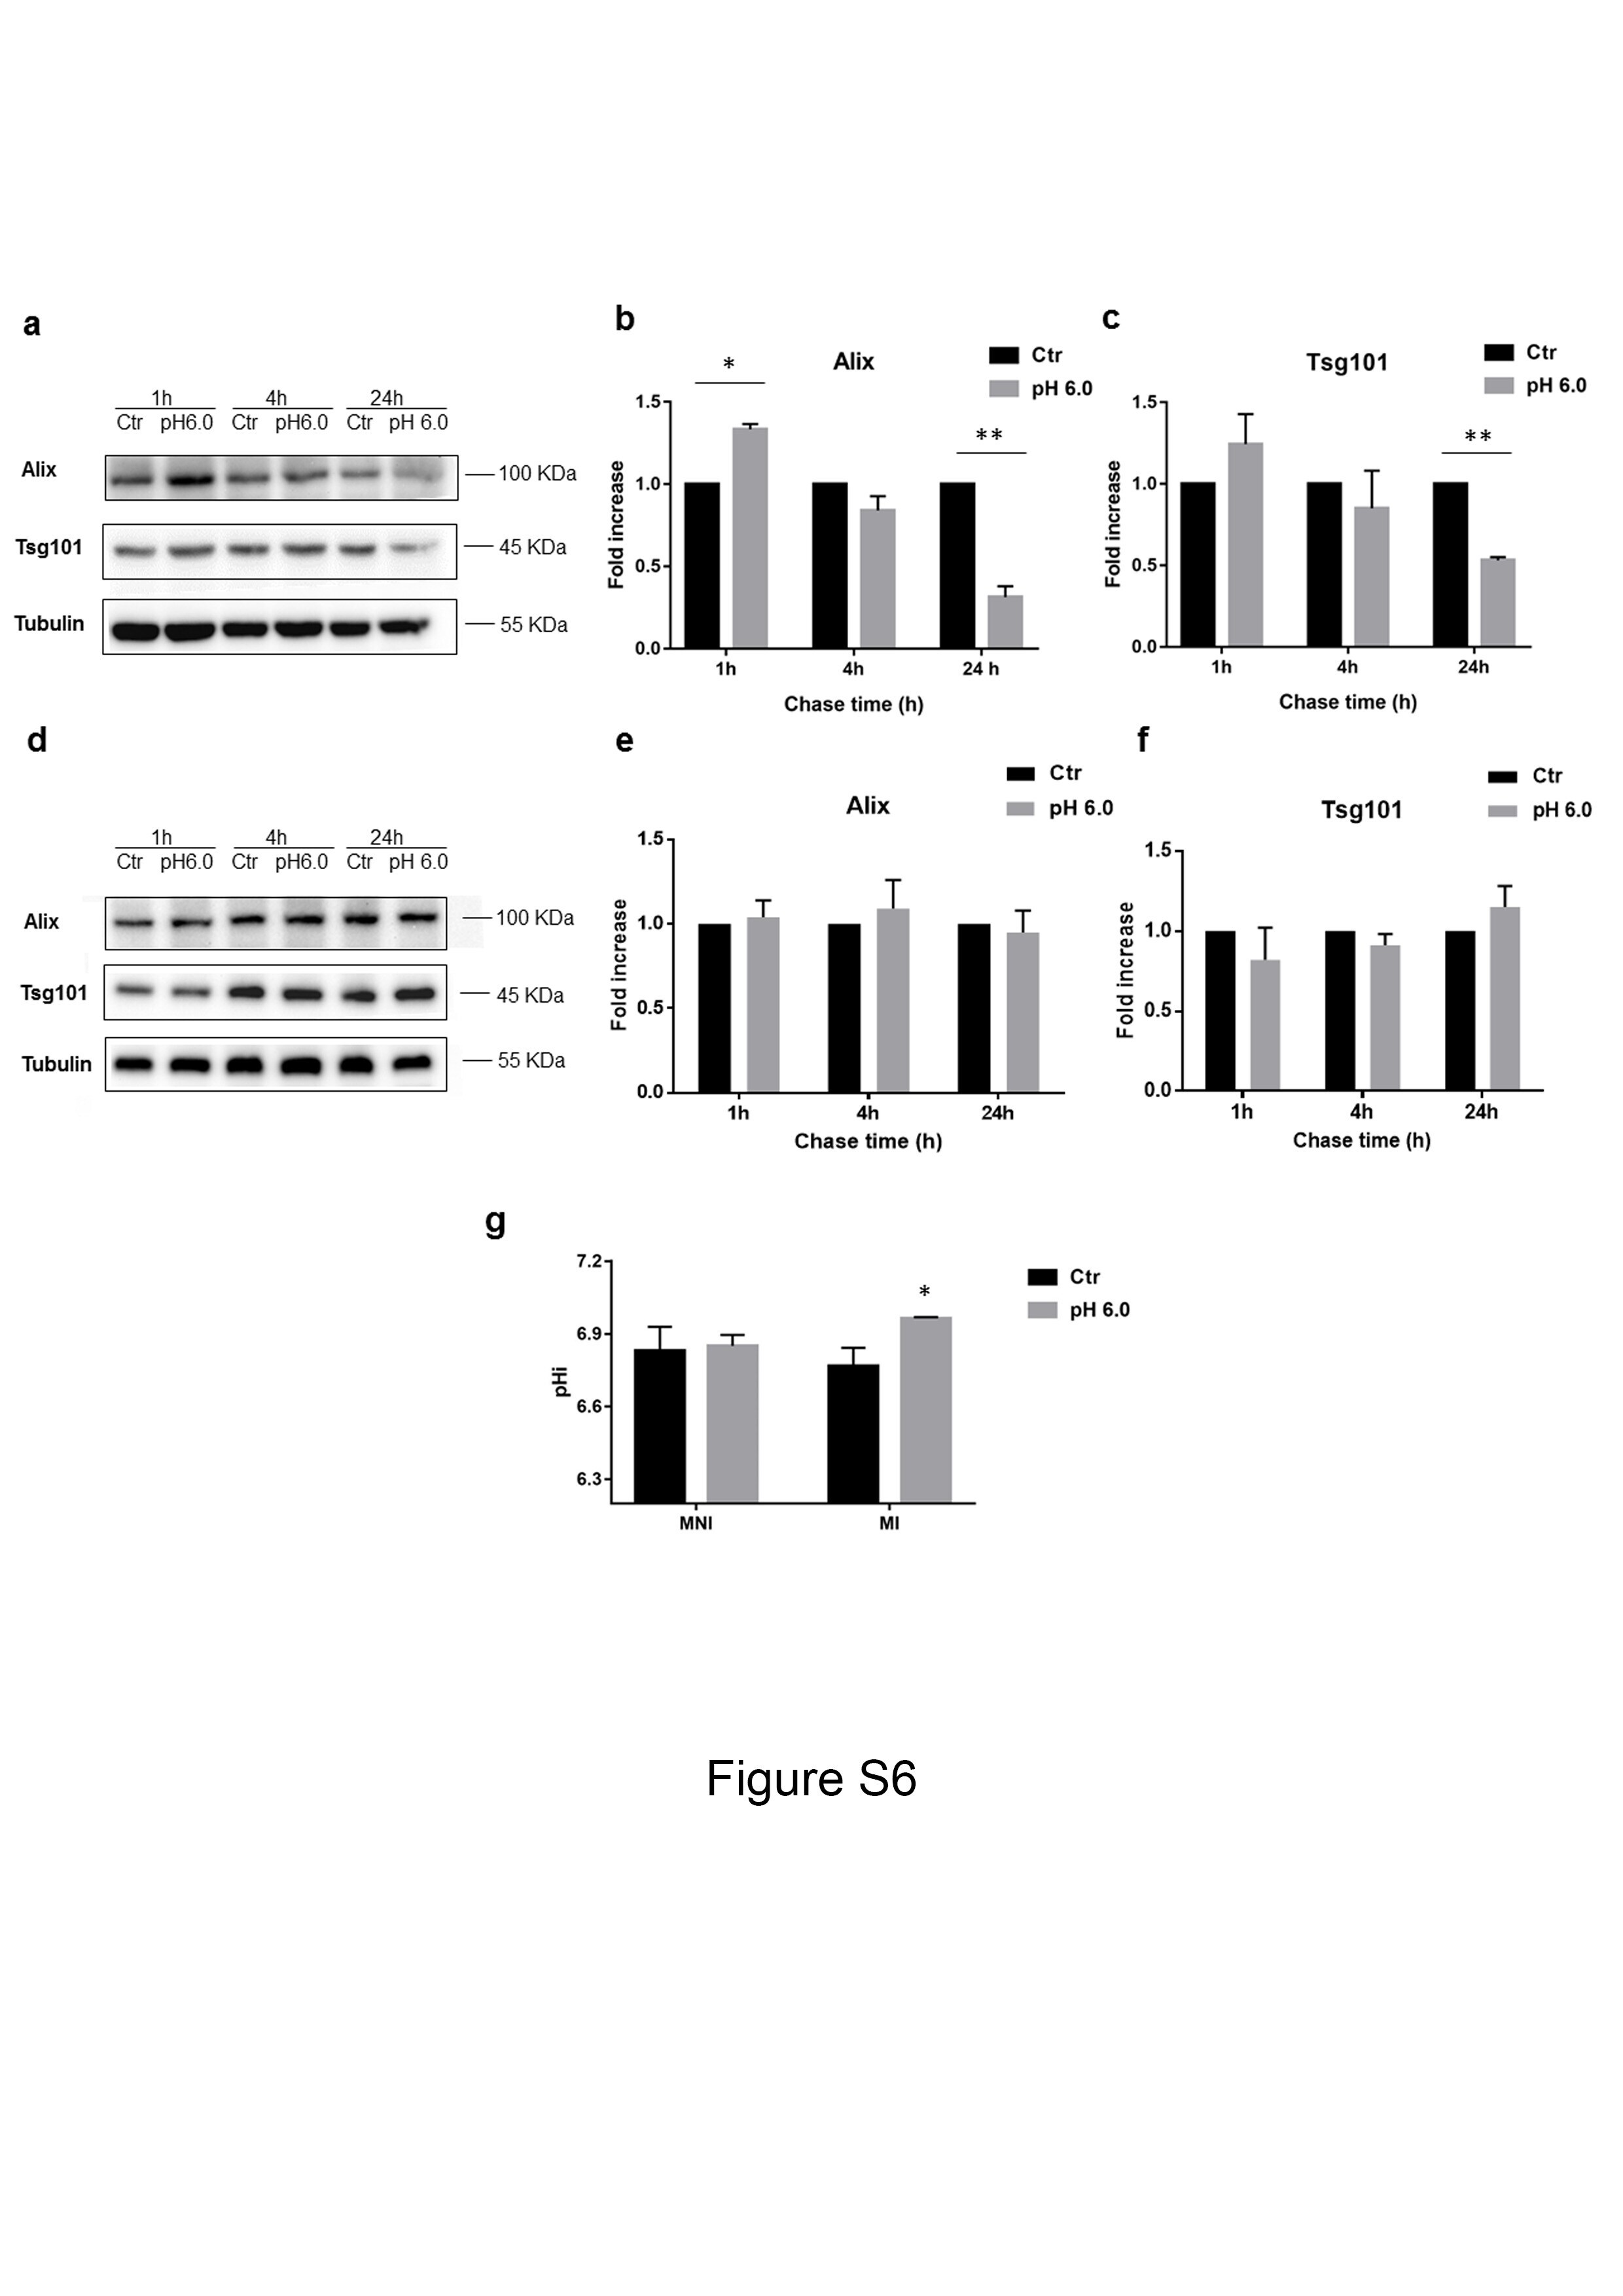
- Additional file 7: Figure S6. MNI and MI intracellular expression of exosome markers and intracellular pH (pHi) evaluation a-c. MNI, and d-f MI cells were left untreated or pH 6.0 treated for the indicated times, then cells were lysed and 30 mug/lane analyzed for Alix and Tsg101 by western blot. a, d representative western blots are showed. b, e Alix, and c, f Tsg101 expression were normalized against tubulin by densitometry analysis and expressed as fold increase (n = 3),. g pHi measurement. Cells were left untreated or incubated at pH 6.0. After 24 h intracellular pH was measured with 3 muM BCECF-AM for 45 min at 37 degC. Mean +- s.d. (n = 3) *, p < 0,05 **, p < 0,01. (PNG 485 kb)
- Submitted by
- Invitrogen Antibodies (provider)
- Main image
- Experimental details
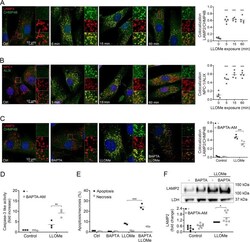
- Fig. 5 ESCRT complex recruited to LLOMe-damaged lysosomes promotes cell survival. Human fibroblasts were exposed to 1 mM LLOMe and when indicated, the cell permeable calcium chelator BAPTA-AM (1 µM) was added 10 min prior to LLOMe exposure. Immunocytochemical staining with corresponding colocalization analysis of a CHMP4B (green) and LAMP2 (red), b ALIX (green) and NPC-1 (red), and c CHMP4B (green) and LAMP2 (red) in fibroblasts exposed to LLOMe for 15 min. Nuclei are stained with DAPI (blue) and merged images show colocalization in yellow ( n = 5). d Caspase-3 like activity in cells exposed to LLOMe for 8 h ( n = 3). e Quantification of apoptotic and necrotic cells using Annexin V/PI staining in fibroblasts exposed to LLOMe for 6 h ( n = 3). f Immunoblot of LAMP2 in digitonin-extracted cytosolic fractions from cells exposed to LLOMe for 2 h ( n = 8) with corresponding quantitative analysis. * p < 0.05, ** p < 0.01 and *** p < 0.001 compared to control ( a - b ) or LLOMe only ( c - f ).

- Submitted by
- Invitrogen Antibodies (provider)
- Main image
- Experimental details
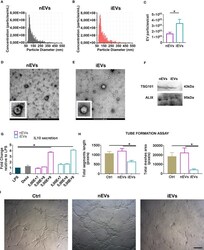
- Figure 1 Characterization of extracellular vesicles derived from mesenchymal stromal cells. (A) Representative size distribution of nEV and of (B) iEV analyzed by Resistive Pulse Sensing. (C) Number of nEVs and of iEVs secreted per cell. Result are mean +- standard error (n = 5 independent experiments, *P < 0.05). (D) Transmission electron microscopy analysis of freshly nEVs (E) and of freshly iEVs; scale bar refers to 200 nm. (F) Western Blot of nEVs and iEVs for TSG101 and Alix. (G) Macrophage functional assay. IL-10 quantification after LPS cell treatment. (n = 3 independent experiments, *P < 0.05). (H, I) Endothelial functional assay. Segment length and meshes area were measured after nEVs and iEVs treatment. (I) Representative phase contrast images. Scale bar: 100mum.

- Submitted by
- Invitrogen Antibodies (provider)
- Main image

- Experimental details
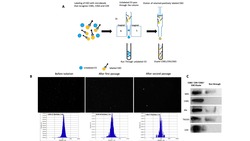
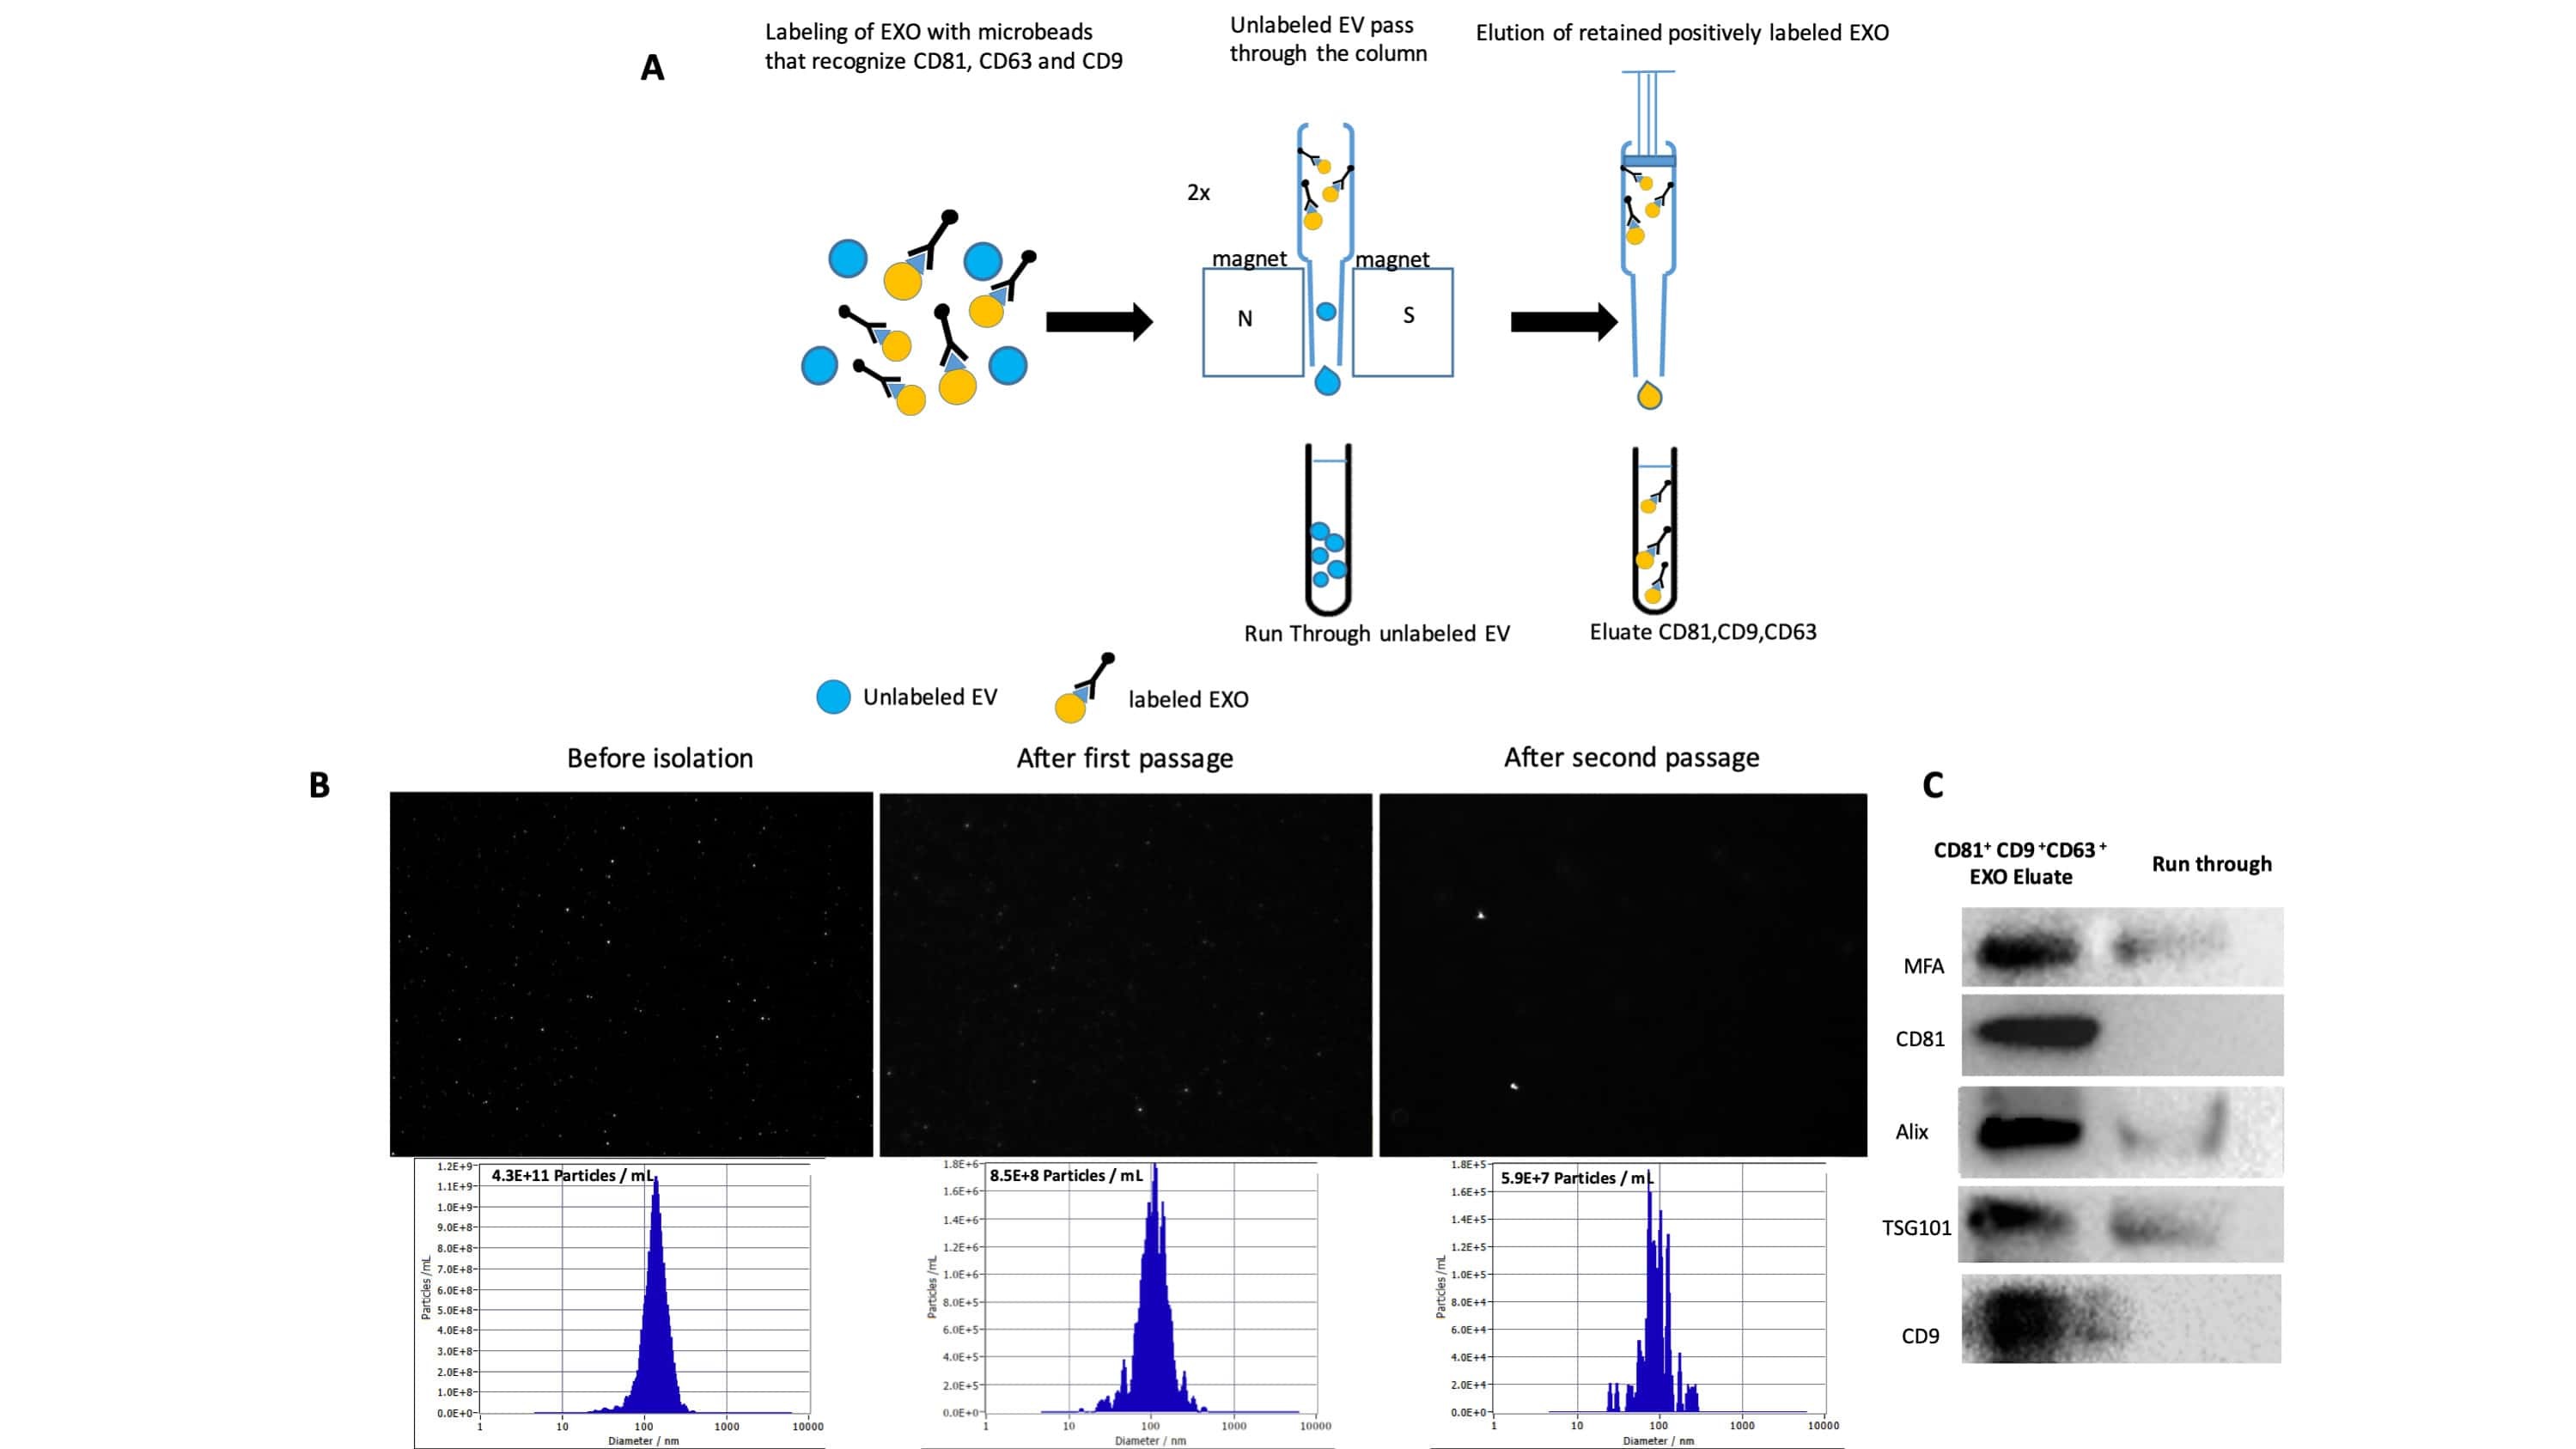
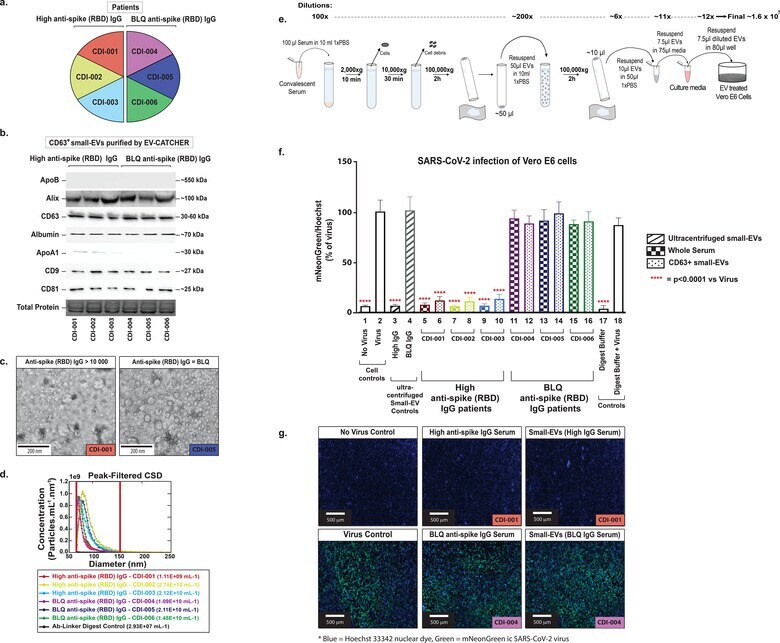
- FIGURE 6 The EV-CATCHER assay releases functional small-EVs. a. Six convalescent serum samples (Second set of covid-19 serum samples) distributed in two groups based on presence of immunoglobulins (IgG) targeting the Receptor Binding Domain (RBD) of SARS-CoV-2 spike protein as antigen. Three high anti-spike IgG titer (left) and three below level of quantification (BLQ) anti-spike IgG titer serum samples were quantified by ELISA (Dr. Perlin's Laboratory). High anti-spike IgG titers were estimated with activity remaining at a 10,000x (fold) dilution, while below level of quantification (BLQ) IgG serum samples did not contain detectable IgG against the spike protein RBA region of SARS-CoV-2 at the same dilution. b. Western blot analyses of CD63 + small-EVs purified with anti-CD63 EV-CATCHER from sera of high anti-spike (RBD region) IgG (lanes 1-3) and BLQ IgG (lanes 4-6) serum samples using anti-ApoB, -Alix, -CD63, -Albumin, -ApoA1, -CD9, and -CD81 antibodies. c. Representative Transmission electron microscopy (TEM) images of small-EVs isolated from high anti-spike IgG (CDI -001, Figure 6b - Lane 1) and BLQ anti-spike IgG (CDI-004, Figure 6b - Lane 6) convalescent sera using the anti-CD63 EV-CATCHER assay. Direct magnification was 20,000x and scale bars are for 200 nm. d. Nanoparticle size distribution characterized using the Spectradyne nCS1 instrument with a TS400 microfluidic cartridges of CD63 + small-EVs purified from all six serum donors using the anti-CD63 EV-CATCHER assa
- Submitted by
- Invitrogen Antibodies (provider)
- Main image
- Experimental details
- FIGURE 3 Evaluation of small-EV purification reproducibility using EV-CATCHER with different biological fluids. a. Western blot evaluation of small-EV surface markers using anti-Alix, -CD63, -CD9, and -CD81 antibodies. EV-CATCHER purification of CD63 + small-EVs from MCF-7 tissue culture media (left) and human plasma (middle) with decreasing total protein inputs before purification. For left and middle Western blots, 3 mug (lane 1), 2.75 mug (lane 2), 2.5 mug (lane 3), 2.25 mug (lane 4), 2 mug (lane 5), 1.75 mug (lane 6), and 1.5 mug (lane 7) total protein was used before EV-CATCHER purification. EV-CATCHER was also used for purification of CD63 + small-EVs from a serum sample, and validated by the four different surface protein antibodies b. Western blot evaluation of ApoB, Albumin, and ApoA1 proteins from MCF7, human plasma, and human serum CD63 + small-EVs purified with EV-CATCHER. c. Transmission electron microscopy (TEM) of MCF-7 small-EV stock (left, MCF-7 Stock) and anti-CD63 EV-CATCHER purified CD63 + small-EVs from MCF-7 small-EV stock (MCF-7), CD63 + small-EVs from human plasma (Plasma), and CD63 + small-EVs from human serum (Serum). Direct magnification of 20,000x and scale bars of 200 nm are represented on the TEM images. c. Representative particle size distribution characterized by nanoparticle tracking (Spectradyne nCS1 equipped with TS400 microfluidic cartridges) for anti-CD63 EV-CATCHER-purified small-EVs from MCF-7 small-EV stock (left graph), human plasma (m
- Submitted by
- Invitrogen Antibodies (provider)
- Main image
- Experimental details
- Figure 4 Characterization of exosomes released from DCs infected with P.gingivalis (PgDCexo): (A) Nano tracking analysis (NTA) to determine Exo number and size distribution in nanometer (nm). (B) Total number of Exo released per 10 6 cells as determined by NTA from DCs treated or non-treated with Pg and/or Rapamycin (C) Immuno-gold TEM showing EXO marker, tetraspanin CD63. (D) SEM showing characteristic Exo morphology. (E) Co-localization of Mfa1 bacterial protein (large- sized gold Nano particle indicated with white arrow) with the eukaryotic cellular exosomal marker, CD81 (small-sized gold Nano particle indicated with red arrow) using TEM immune-gold double labeling (F) Western blot showing Exo-related markers TSG101, Alix, and tetraspanin CD81 and proinflammatory cytokines IL6, TNFa and IL-1b and Mfa1 in exosomes released from control immature DCs (iDCs), Ecoli LPS-stimulated mature DCs (StimDCexo) and Pg infected DCs (PgDCexo). (G) miRNA analysis of Pg or Ecoli LPS-induced DCs Exo (PgDC exo and StimDCexo respectively) compared to immature control DCs exo; (iDCexo). (iDCs), control immature DCs exo, (StimDCexo), Ecoli LPS-stimulated mature DCs exo; (PgDCexo), Pg-infected DCs. **p
- Submitted by
- Invitrogen Antibodies (provider)
- Main image
- Experimental details
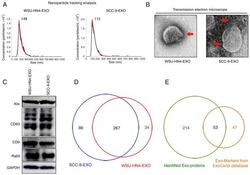
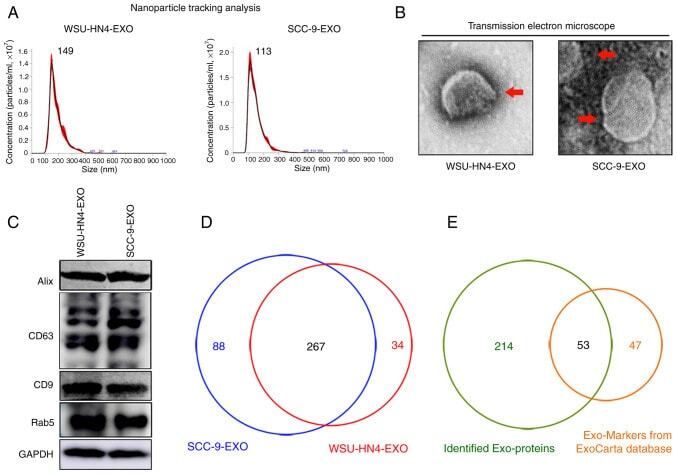
- Figure 1 Characterization of OCEXs. (A) The sizes of the WSU-HN4- and SCC-9-derived exosomes were determined by NTA. (B) Representative images of exosomes derived from WSU-HN4 and SCC-9 cells, as detected by TEM. Scale bars, 50 nm. (C) Expression of the exosomal markers, Alix, CD63, CD9 and Rab5, in WSU-HN4- and SCC-9-derived exosomes was determined by western blot analysis. (D) Co-expressed proteins in WSU-HN4- and SCC-9-derived exosomes were detected by mass spectrometry. (E) Overlap of OCEX proteins and the top 100 frequently identified exosomal protein markers from the ExoCarta database. OCEXs, oral cancer-derived exosomes; NTA, nanoparticle tracking analysis; TEM, transmission electron microscopy; EXO/Exo, exosomes.
- Submitted by
- Invitrogen Antibodies (provider)
- Main image
- Experimental details
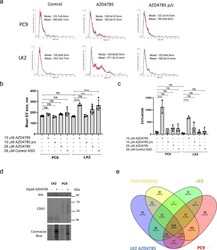
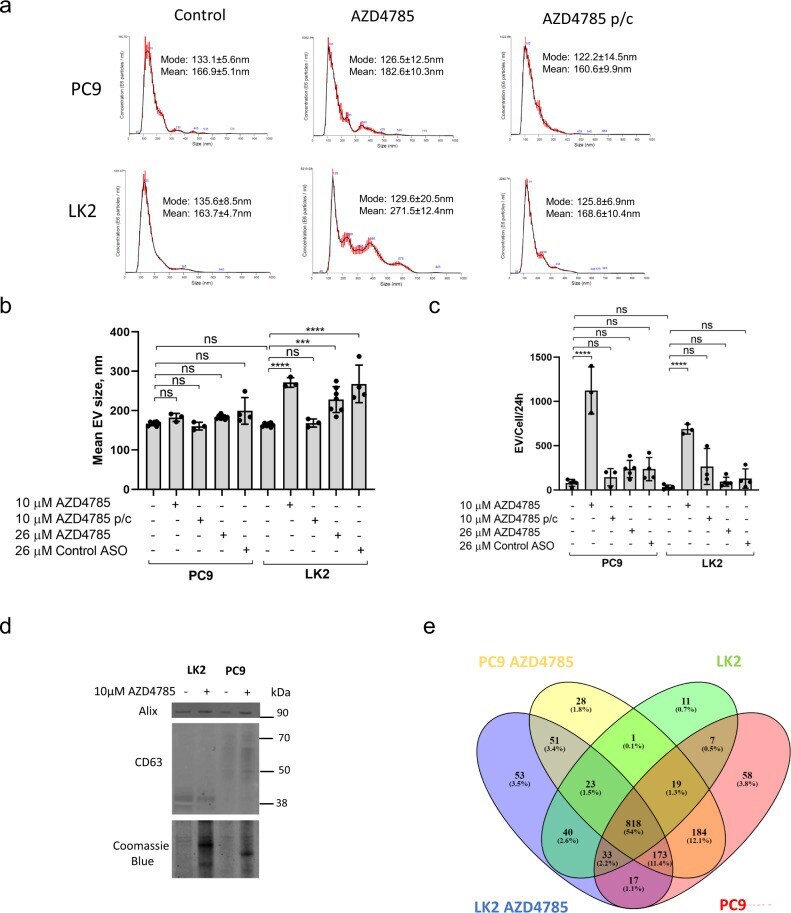
- Fig. 3 AZD4785 stimulates EV secretion by PC9 and LK2 cells. a - c PC9 and LK2 were treated with AZD4785 for 24 h. For the pulse-chase (p/c) experiment, cells were treated with 10 uM AZD4785 for 6 h, washed and incubated for 24 h in the absence of AZD4785 (AZD4785 p/c). EVs were isolated from conditioned cell media by differential ultracentrifugation and a 100,000x g pellets were analysed by NTA. Representative NTA images. ( N = 6). b Size distribution of EVs secreted by PC9 and LK2 cells. EVs were collected and analysed as in a . Error bars, standard deviation. ANOVA **** p < 0.0001. *** p < 0.001. ns non-significant. N = 3-6. c Quantification of EV secretion by PC9 and LK2 cells. The total number of EVs was measured by NTA as in a and divided by the total number of cells. Error bars, standard deviation. ANOVA. **** p < 0.0001, ns non-significant. N = 3-6. d Detection of exosomal markers, CD63 and Alix, in EVs isolated from PC9 and LK2 cells after 24 h treatment. Equal aliquots of EVs isolated as in a were analysed by western blotting and probed for CD63 and Alix. Representative image from N = 2. e Vein diagram for the EV's protein mass spectrometry analysis revealed differentially secreted protein in PC9 and LK2 EVs.
- Submitted by
- Invitrogen Antibodies (provider)
- Main image
- Experimental details
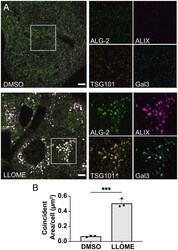
- Fig. 5. ALIX and the ESCRT-I recruitment factor TSG101 are corecruited with ALG-2 to damaged lysosomes. ( A ) U2OS cells were treated with either DMSO ( Upper row ) or LLOME ( Lower row ) for 15 min and then immunostained for ALG-2 (green), ALIX (magenta), TSG101 (yellow), and Gal-3 (cyan). Relatively large colocalized puncta of ALG-2, ALIX, and TSG101 along with Gal-3 were observed after LLOME treatment. The regions encapsulated within the white boxes have been enlarged and the individual protein channels are shown on the Right . Images are representative of five independent replicates. ( B ) The area of overlapping compartments increased dramatically upon LLOME treatment compared to the DMSO control ( n = 75 cells for DMSO, 64 cells for LLOME). The circles on the bar charts represent independent data points and the data are shown as mean +- SD (vertical line). P = 0.0002 (***). (Scale bar, 5 mum.)
- Submitted by
- Invitrogen Antibodies (provider)
- Main image
- Experimental details
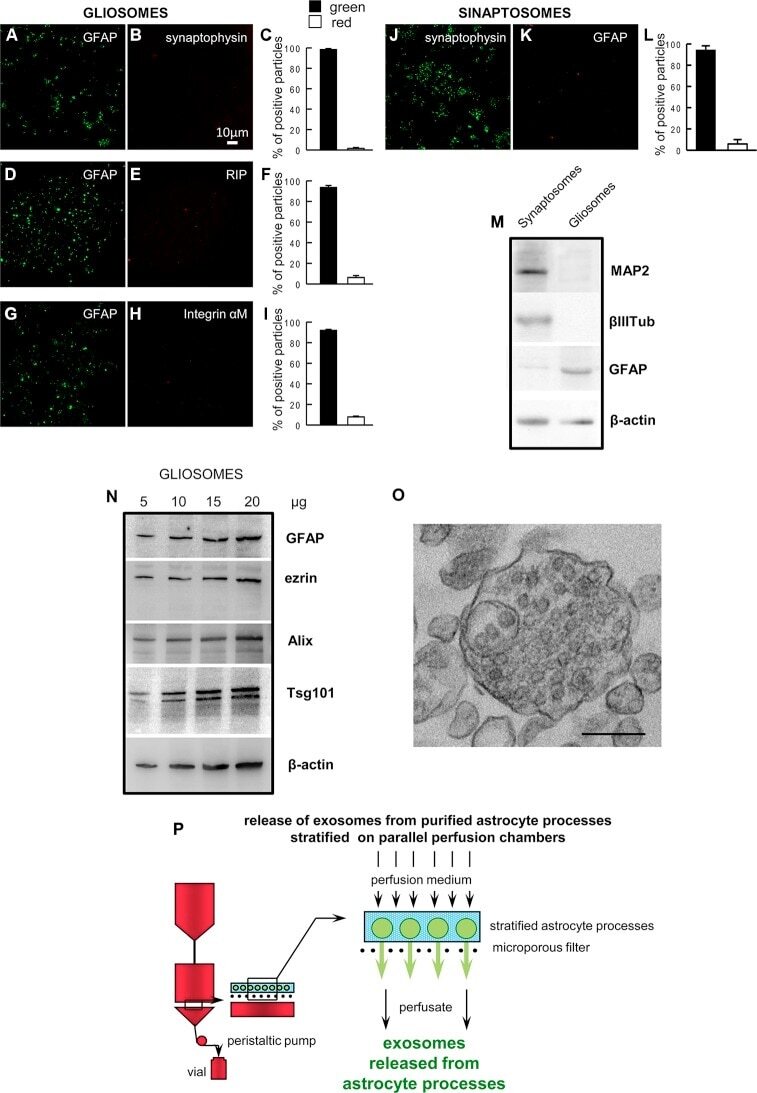
- Figure 1 Astrocyte processes obtained from adult rat cerebral cortex. Negligible contamination of gliosomes, positive for the specific glial marker GFAP (A , D , G) , by subcellular no-astrocytic particles. Immunofluorescent assay for synaptophysin (B) , RIP (E) or integrin-alphaM (H) markers for nerve terminals, microglia, and oligodendrocytes, respectively. As a positive control, the immunofluorescent assay for synaptophysin (J) was performed on cerebral cortical synaptosomes scarcely contaminated by subcellular GFAP-positive particles (K) . Bars (C , F , I , L) represent the percent of positive particles (% +- SEM of positive particles counted in three to five no-overlapping fields from n = 3 different preparations): GFAP (C, F, I, solid bars; L, empty bar), synaptophysin (C empty bar; L solid bar; L, empty bar), or RIP or integrin-alphaM (F or I, respectively; empty bar). Scale bars are indicated in the figures. Western blot analysis of gliosomes and synaptosomes (M , N) . The absence of cross-contamination of the astrocyte processes and nerve terminals is shown (M) : MAP2, beta III tubulin, and GFAP proteins were used as selective markers for the synaptosome or gliosome preparations. Presence of the astrocytic markers GFAP and ezrin, and of the exosome markers Alix and Tsg101 in the gliosomes (N) . Electron microscopy image of a cortical astrocyte processes. A single gliosome is shown containing vesicles scattered in the cytoplasm and a multivesicular body (O) . Scale ba
- Submitted by
- Invitrogen Antibodies (provider)
- Main image

- Experimental details
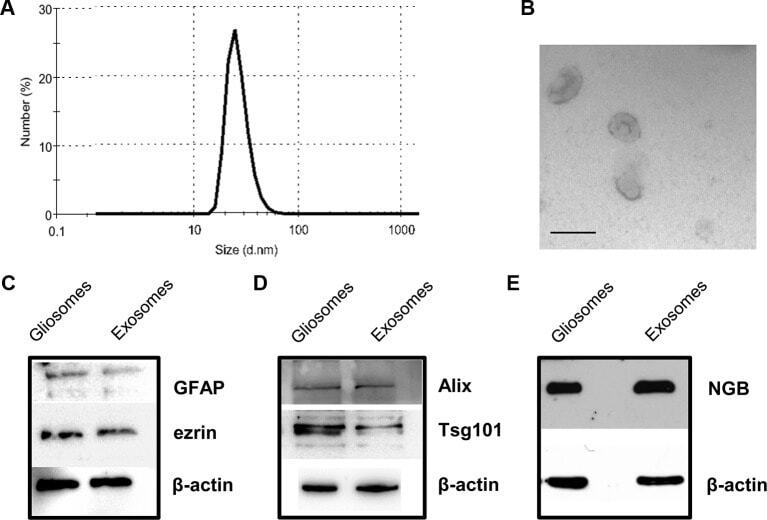
- Figure 2 Characterization of rat cerebrocortical astrocyte processes-released exosomes. Size distribution of exosomes released from the astrocyte processes, as assessed by the zetasizer nano ZS90 particle sizer. Curve shows a representative tracing (from three samples obtained from three different experiments with similar results) (A) . Electron microscopy images of vesicles released from astrocyte processes. Note the cup shape appearance and size, consistent with previously reported exosome electron microscopy images characteristics (B ; scale bar: 100 nm). Presence of astrocytic markers, exosomal markers, and of NGB (C - E) . Western blot for the astrocytic markers GFAP and ezrin in gliosome preparation and in exosomes released from gliosomes (C) . Western blot for the exosomal markers Alix and Tsg101 in gliosome preparation and in gliosome-released exosomes (D) . Western blot for NGB in gliosome preparation and in gliosome-released exosomes (E) . For other experimental details, see Materials and Methods .
- Submitted by
- Invitrogen Antibodies (provider)
- Main image
- Experimental details
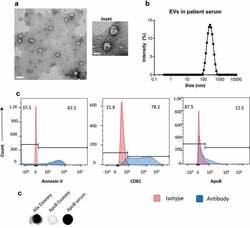
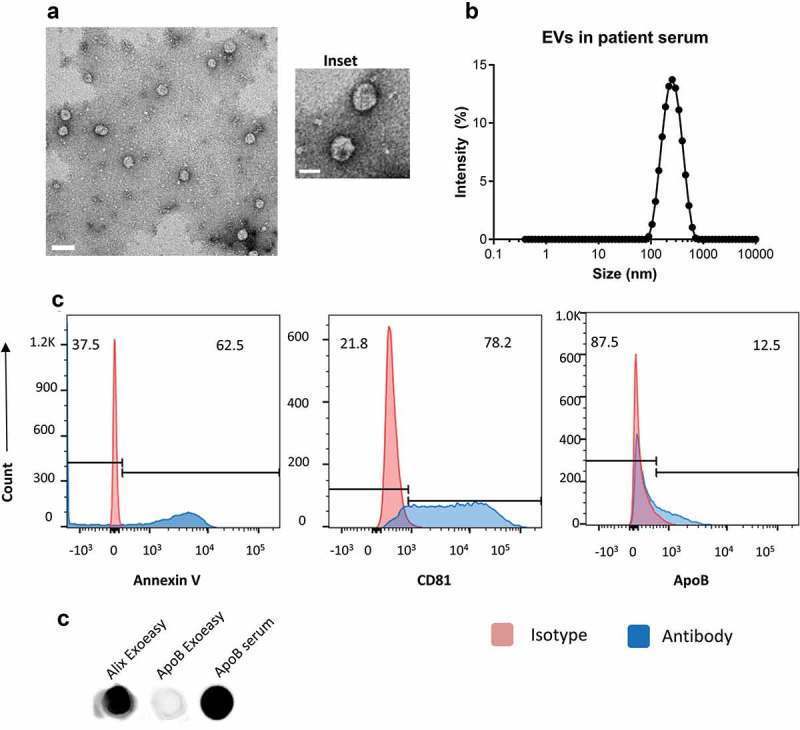
- Figure 1. Serum extracellular vesicles isolated from healthy volunteers are a mixture of exosomes and other microvesicles. (a) A representative transmission electron micrograph (TEM) of EVs from patient serum is shown (scale bar = 200nm), an inset shows a zoomed in view of particles (scale bar = 100 nm). (b) Dynamic light scattering of serum EVs shows that the average size of isolated particles to be around 200nm. (c) Flow cytometric analyses of beads incubated with EVs shows the detection of Annexin V, CD81 and ApoB with fluorochrome-labelled primary antibodies. Annexin V, CD81 and ApoB are shown in the histograms in blue while the isotype controls are depicted in red. (d) Dot Blot showing the expression of Alix and ApoB in EV's isolated from Serum using the ExoEasy protocol. Serum was blotted as a positive control for ApoB.
- Submitted by
- Invitrogen Antibodies (provider)
- Main image
- Experimental details
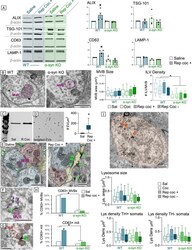
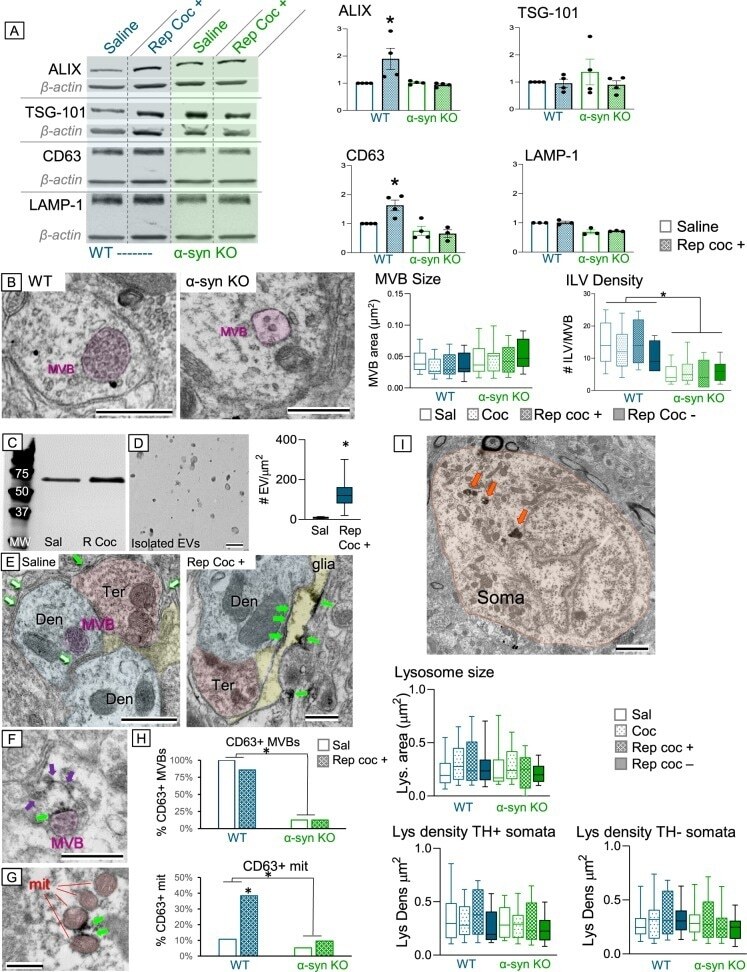
- Fig. 6 a Western Blots for ALIX, TSG-101, CD63, and LAMP-1 in midbrain lysates obtained from WT (blue) and alpha-syn KO (green) and bar charts of quantification showing increased ALIX and CD63 protein levels after repeated cocaine administration that was blocked in alpha-syn KO mice. b Electron micrographs and quantification (bar chart) showing that although neither cocaine administration nor alpha-syn deletion affects MVB size, alpha-syn is critical for cargo internalization and formation of intraluminal vesicles (ILVs) within MVBs. c Western blot of isolated EVs from mouse brain showing increased CD63 immunoreactivity after repeated cocaine administration. d Electron micrograph and quantification of isolated EVs from mouse brain showing increased vesicle density after repeated cocaine. e Electron micrographs of VTA tissue from saline-treated mice showing CD63 immunolabeling of ILVs in a MVB (magenta outline) but virtually no labeling in the extracellular spaces (open green arrows) of saline-treated mice. In contrast, after repeated cocaine administration (left), CD63 immunoperoxidase is evident in the extracellular space (green arrows) and in glia (yellow) within the VTA. f Electron micrograph of a MVB (magenta) showing CD63 immunolabeling on its surface (green arrow) and vesicles with CD63 labeling (purple arrows) along a membrane that attaches the MVB to the extracellular space between adjoining cells. g Electron micrograph of several mitochondria (red) showing CD63 label
- Submitted by
- Invitrogen Antibodies (provider)
- Main image

- Experimental details
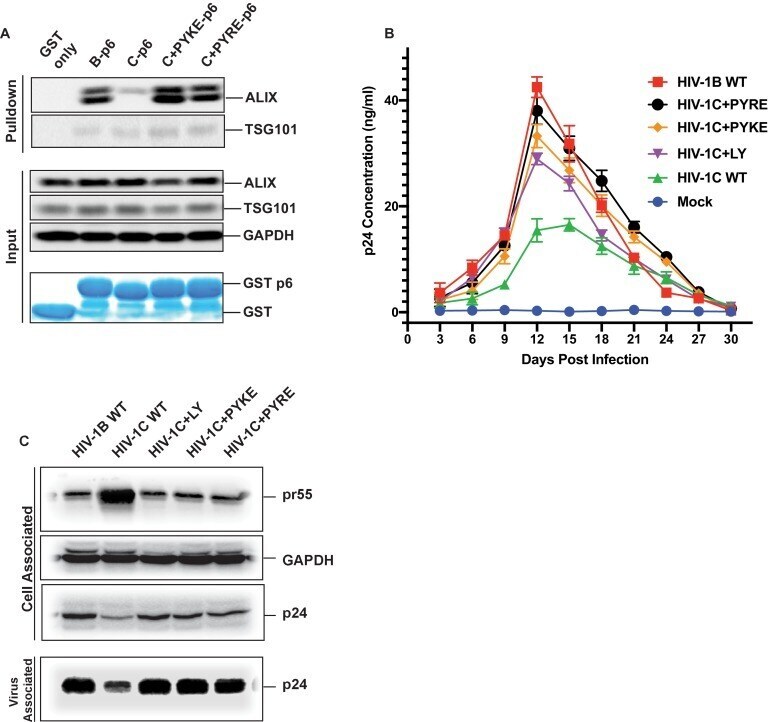
- Figure 11. PYxE insertions restore ALIX binding to Gag-p6 and enhance replication capacity due to improved virion release. ( A ) PYxE insertions restore ALIX binding to HIV-1C Gag-p6. GST protein, either by itself or fused to HIV-1B-p6, HIV-1C-p6, HIV-1C+PYxE-p6 were expressed and purified from E. coli using Glutathione agarose beads, and incubated with HeLa cell lysates. Pull-downs of the protein complexes were resolved on SDS-PAGE gels and the western immunoblots probed for ALIX and TSG101 ( top panel ). Input levels of ALIX, TSG101 as well as the GAPDH control are in the middle panels and purified GST-only and GST-p6 fusion inputs are in lower panels . The experiment was performed three times. ( B ) The effect of PYxE insertion on virus replication fitness. MDMs were infected with equal p24 and media were collected every 3 days till day 30. Media collected were clarified and p24 levels determined via p24 ELISA. Data are represented as mean +- SEM. The experiment was performed three times. ( C ) The effect of PYxE insertion on virus release. HeLa cells were transfected with molecular clones. Media were collected 24 hours post-transfection and virus pelleted through a 20% sucrose cushion. Cells were pelleted and lysed. Both virus and cell lysates were subjected to a western immunoblot followed by detecting virus-associated p24 and cell-associated p24 and other Gag-derived proteins (pr55, ( p41 ) with alpha-p24 antibodies. GAPDH was used as a loading control. Figure 11
- Submitted by
- Invitrogen Antibodies (provider)
- Main image
- Experimental details
- Figure 12. Replication of viruses bearing LYPX or PYxE insertions is inhibited by silencing ALIX or by ALIX dominant negative protein but enhanced by ALIX over expression. ( A ) CEM-CCR5 cells were transduced with scrambled shRNA or anti-ALIX shRNA (29394 or 29395) expression cassettes. After selecting for transduction, the presence of ALIX protein was determined by western immunoblotting. ( B ) The shRNA-transduced cells were infected with HIV-1B, HIV-1B(LY), HIV-1C, HIV-1C+LY, HIV-1C+PYKE or HIV-1C+PYRE viruses. Media were collected every 3 days and p24 levels for day 18 at the peak virus replication determined. Data are represented as mean +- SEM (n = 3). ( C ) HeLa cells were co-transfected with indicated HIV-1 molecular clones and ALIX wild type or ALIX V domain (ALIX-DN) expression plasmids. At 24 hr post-transfection, p24 levels were measured. Data are represented as mean +- SEM (n = 3). Figure 12--source data 1. All p24 values plotted in Figure 12B . Figure 12--source data 2. All p24 values plotted in Figure 12C . Figure 12--figure supplement 1. Effect of over-expression of wild type and dominant negative ALIX on intracellular capsid protein. HeLa cells were either transfected HIV-1B wildtype, HIV-1C wildtype, HIV-1C+LY, HIV-1C+PYKE and HIV-1C+PYRE molecular clones. Cells were also co-transfected with either ALIX dominant negative or ALIX wildtype plasmid DNA. Cell lysates were prepared 24 h post transfection and subjected to immunoblotting with anti-p24 and alp

- Submitted by
- Invitrogen Antibodies (provider)
- Main image

- Experimental details
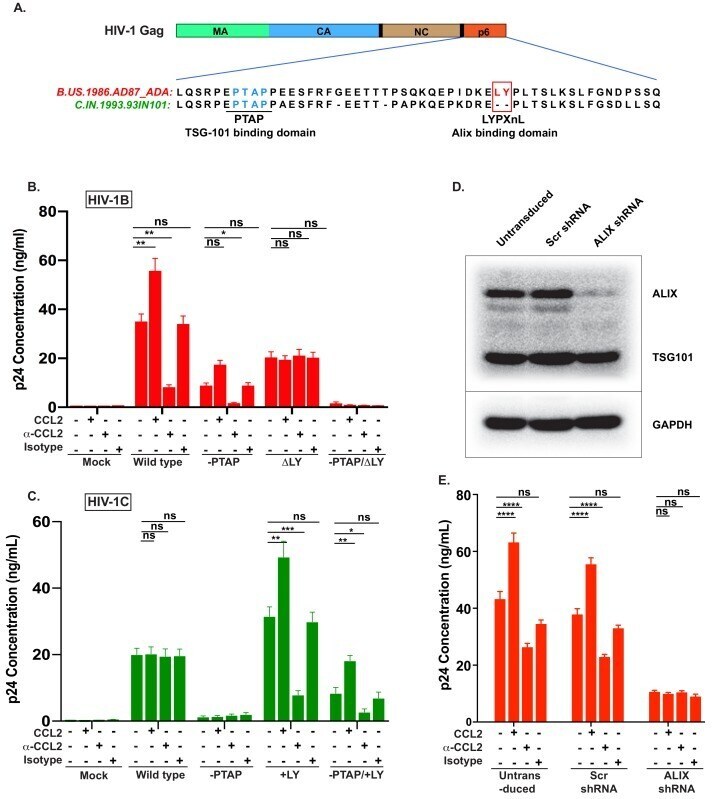
- Figure 4. CCL2-mediated changes in virus production requires the presence of Gag-p6 LYPX motif in the virus and ALIX in target cells. ( A ) Alignment of Gag-p6 amino acid sequences from the two viruses employed in this study - HIV-1B ADA and HIV-1C IndieC1 . HIV-1B ADA has both late motifs (PTAP and LYPX) while HIV-1C IndieC1 lacks the LY dipeptide in LYPX motif. ( B, C ) Modulation of virus production by CCL2 levels in the media of HeLa cells transfected with HIV-1B ADA (panel B) or HIV-1C IndieC1 (panel C) molecular clones or their late domain mutant versions. ( B ) Shows results of transfecting HIV-1B ADA or its -PTAP, DeltaLY or -PTAP/DeltaLY variants and ( C ) Shows HIV-1C IndieC1 or its -PTAP, +LY or -PTAP/+LY variants. For each virus, p24 production 24 hr post transfection is plotted including with no treatment, in the presence of CCL2 (0.25 ug/ml), alpha-CCL2 antibody (2.5 ug/ml) or Isotype antibody (2.5 ug/mL). Data are represented as mean +- SEM (n = 4). The experiment was performed four times with two replicates in each experiment. ( D ) CEM-CCR5 cells were transduced with lentiviral vectors carrying either a control scrambled shRNA or an ALIX shRNA 29394 expression cassette. Western blot analysis of lysates of untransduced CEM-CCR5 cells or transduced with either the scrambled shRNA or the ALIX shRNA is shown. The bottom panel shows GAPDH protein as a loading control. ( E ) CEM-CCR5 cells with ALIX knocked-down were infected with HIV-1B ADA, either
- Submitted by
- Invitrogen Antibodies (provider)
- Main image

- Experimental details
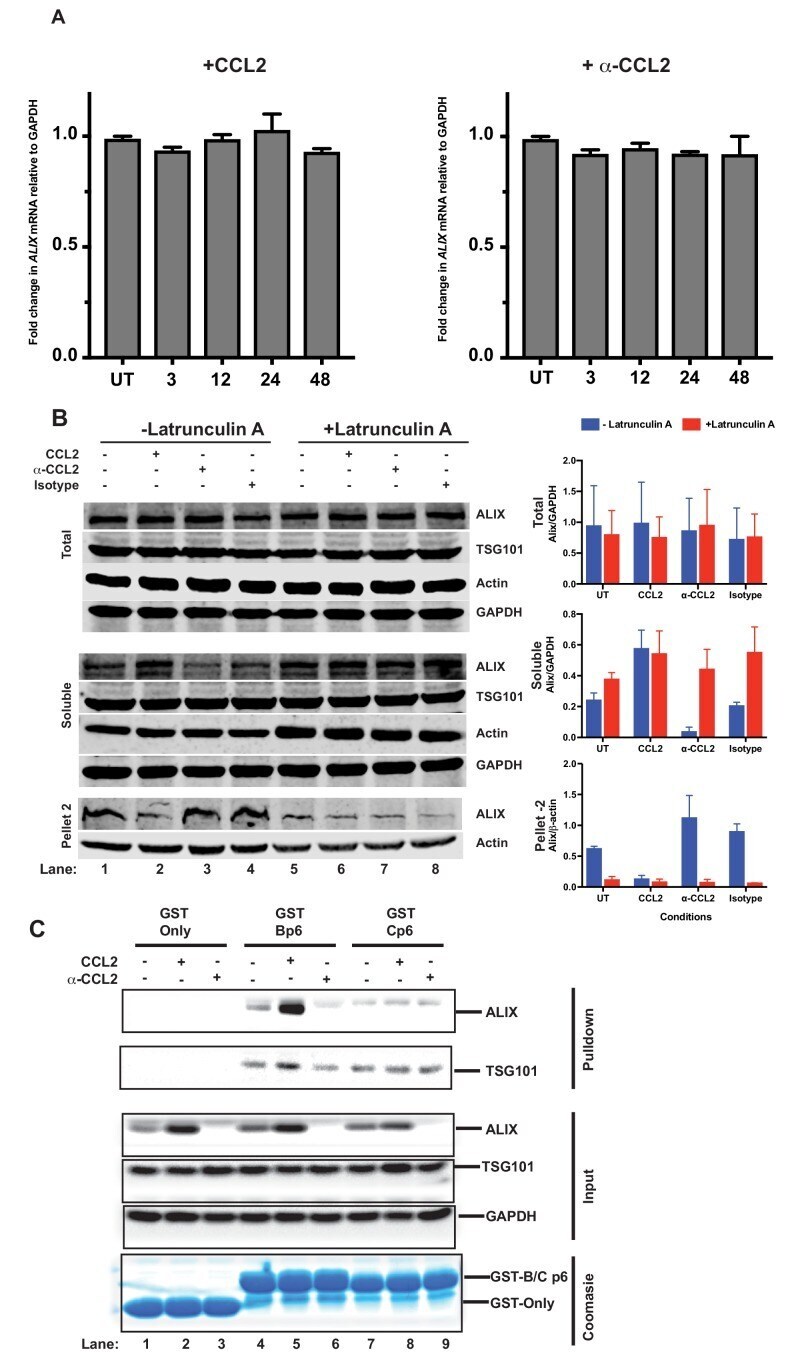
- Figure 5. CCL2 does not impact ALIX mRNA levels but increases soluble ALIX and facilitates Gag-p6 binding. ( A ) Effect of CCL2 levels on ALIX mRNA levels. Total RNA from HeLa cells treated with CCL2 (0.25 ug/ml) or alpha-CCL2 (2.5 ug/ml) was extracted, reverse transcribed and the cDNAs employed in real-time polymerase chain reactions. Data are represented as mean +- SEM (n = 3). The experiment was performed three times. ( B ) Immunoblots showing ALIX levels in the total, soluble and insoluble fractions of HeLa cells. Total ALIX protein levels in untreated (UT), CCL2 treated or alpha-CCL2-treated HeLa cells are similar ( Top panel ). However, upon CCL2 treatment, most of the ALIX is in the soluble phase while alpha-CCL2 treatment shows the reverse ( middle panel ) ALIX levels in pellet II (which constitutes uncross-linked actin - see Materials and methods) represent the converse of what is seen in the soluble fraction ( bottom Panels ). Two identically treated batches of cells were used, but with or without Latrunculin treatment. ALIX band intensities are quantified, normalized for GAPDH (Total and Soluble) or Actin (Pellet 2) and plotted to the right of the immunoblot. The experiment has been performed three times. ( C ) CCL2 treatment facilitates Gag-p6-ALIX interaction. GST protein, either by itself or fused to HIV-1B-p6 or HIV-1C-p6 proteins, were expressed in E. coli and purified using Glutathione agarose beads, and incubated with HeLa cell lysates that were eithe
- Submitted by
- Invitrogen Antibodies (provider)
- Main image
- Experimental details
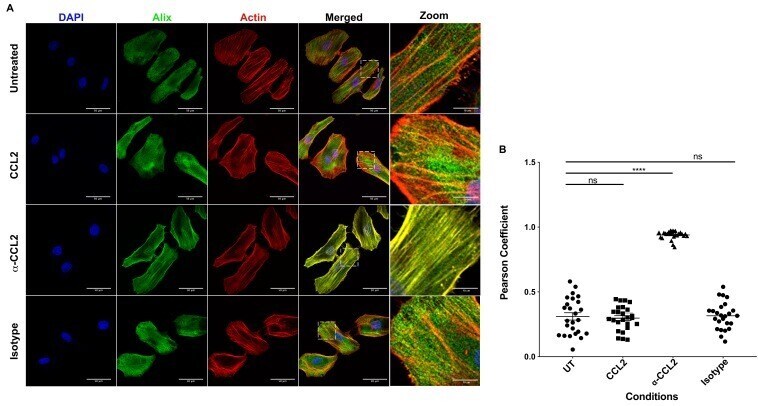
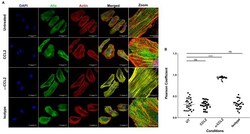
- Figure 6. CCL2 triggers intracellular redistribution of ALIX in HeLa cells. ( A ) Confocal microscopy to visualize ALIX in HeLa cells. Cells treated with nothing (Untreated), CCL2, alpha-CCL2 or Isotype antibody for 4 hr were stained for ALIX, F-actin and DAPI to determine the cellular localization of ALIX upon modulating CCL2 levels. Fluorescence micrographs show that upon CCL2 depletion (alpha-CCL2 panels), ALIX is dramatically redistributed from the cytoplasm to F-actin stress fibers, while in the presence of CCL2 (both Untreated and CCL2-treated), ALIX is more diffuse throughout the cytoplasm and near the plasma membrane. A small portion of the merged panels was amplified 5.21X to show that the signals colocalize only in alpha-CCL2-treated cells ( B ) To quantify the degree of colocalization of ALIX and F-actin signals under conditions of CCL2 addition and depletion, we calculated the Pearsoncorrelation coefficients between the two fluorophores. For HeLa cells, the data plotted indicates the close proximity of F-actin and ALIX upon CCL2 depletion, while in the presence of CCL2 (untreated and CCL2) ALIX and F-actin signals are distinct from each other. Data are represented as mean +- SEM (n = 50 cells each for HeLa cells). Figure 6--source data 1. Pearson coefficient values plotted in Figure 6B .