Explore
 Validate
 Learn
Learn33-9600
antibody from Invitrogen Antibodies
Targeting: CTNND1
CTNND, KIAA0384, p120, p120cas, p120ctn
 Western blot
 ELISA
ELISA Immunocytochemistry Immunoprecipitation Immunohistochemistry Flow cytometry Other assay
Antibody data
- Antibody Data
- Antigen structure
- References [15]
- Comments [0]
- Validations
- Immunocytochemistry [2]
- Immunohistochemistry [1]
- Flow cytometry [1]
- Other assay [23]
Submit
Validation data
Reference
Comment
Report error
- Product number
- 33-9600 - Provider product page

- Provider
- Invitrogen Antibodies
- Product name
- delta Catenin Monoclonal Antibody (15D2)
- Antibody type
- Monoclonal
- Antigen
- Recombinant full-length protein
- Reactivity
- Human, Mouse, Rat, Canine
- Host
- Mouse
- Isotype
- IgG
- Antibody clone number
- 15D2
- Vial size
- 100 μL
- Concentration
- Conc. Not Determined
- Storage
- -20°C
Submitted references Hydrocephalus in Nfix(-/-) Mice Is Underpinned by Changes in Ependymal Cell Physiology.
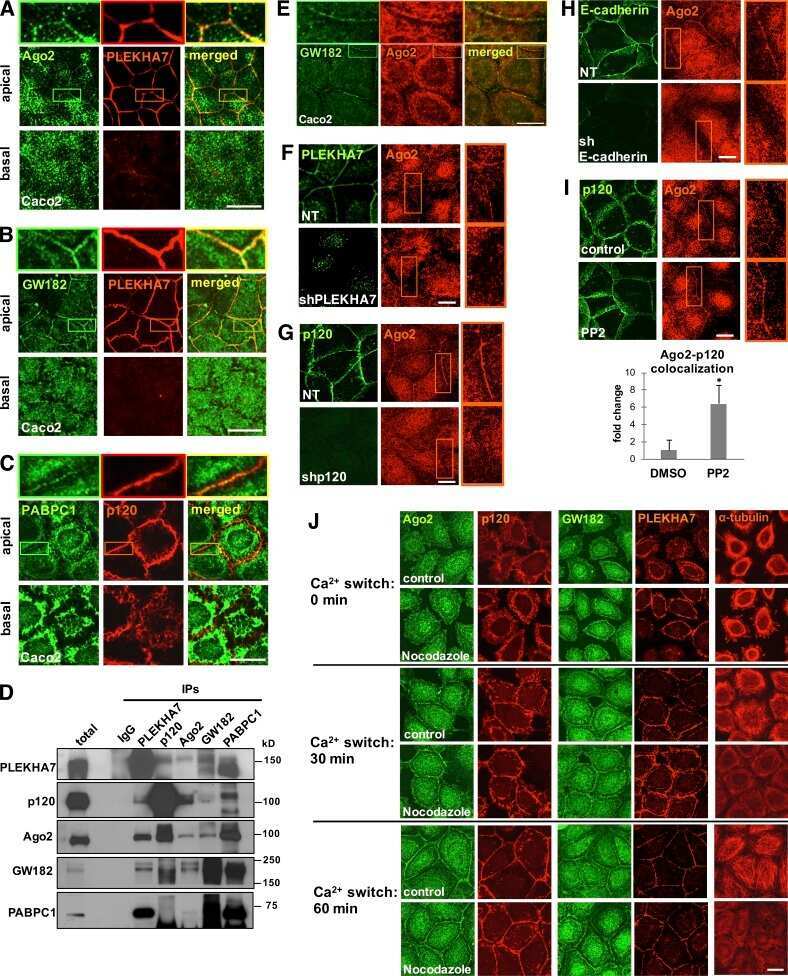
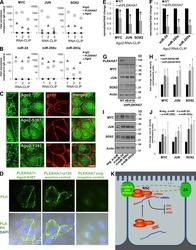
Cadherin complexes recruit mRNAs and RISC to regulate epithelial cell signaling.
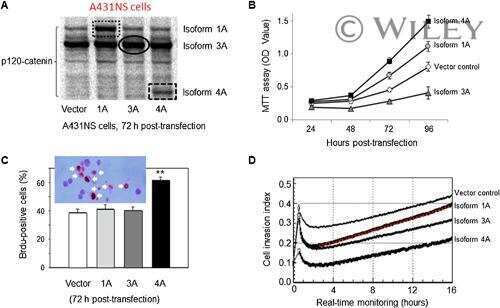
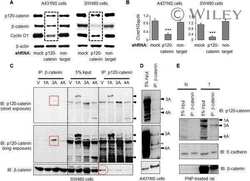
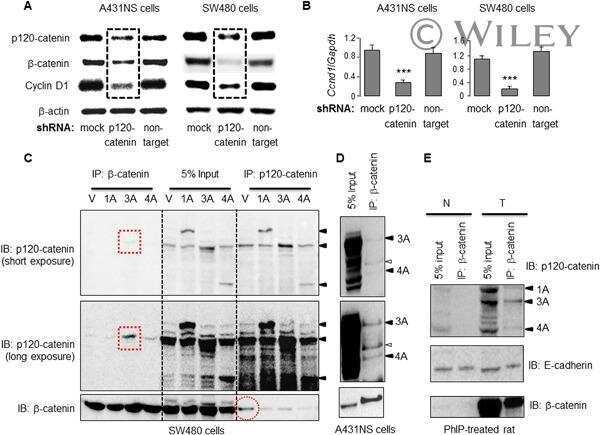
Divergent roles of p120-catenin isoforms linked to altered cell viability, proliferation, and invasiveness in carcinogen-induced rat skin tumors.
Pro-Tumorigenic Phosphorylation of p120 Catenin in Renal and Breast Cancer.
p120-catenin differentially regulates cell migration by Rho-dependent intracellular and secreted signals.
Targeting Src family kinases inhibits bevacizumab-induced glioma cell invasion.
The Xin repeat-containing protein, mXinβ, initiates the maturation of the intercalated discs during postnatal heart development.
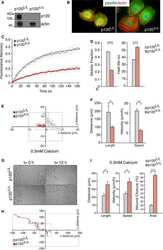
CLASP2 interacts with p120-catenin and governs microtubule dynamics at adherens junctions.
CLASP2 interacts with p120-catenin and governs microtubule dynamics at adherens junctions.
Altered E-cadherin expression and p120 catenin localization in esophageal squamous cell carcinoma.
Modulating the strength of cadherin adhesion: evidence for a novel adhesion complex.
Conditional targeting of E-cadherin in skin: insights into hyperproliferative and degenerative responses.
Regulation of cell-cell interactions by phosphatidic acid phosphatase 2b/VCIP.
Cadherin junctions in mammary tumors.
Cadherin junctions in mammary tumors.
Harkins D, Harvey TJ, Atterton C, Miller I, Currey L, Oishi S, Kasherman M, Davila RA, Harris L, Green K, Piper H, Parton RG, Thor S, Cooper HM, Piper M
Cells 2022 Aug 2;11(15)
Cells 2022 Aug 2;11(15)
Cadherin complexes recruit mRNAs and RISC to regulate epithelial cell signaling.
Kourtidis A, Necela B, Lin WH, Lu R, Feathers RW, Asmann YW, Thompson EA, Anastasiadis PZ
The Journal of cell biology 2017 Oct 2;216(10):3073-3085
The Journal of cell biology 2017 Oct 2;216(10):3073-3085
Divergent roles of p120-catenin isoforms linked to altered cell viability, proliferation, and invasiveness in carcinogen-induced rat skin tumors.
Wang R, Chen YS, Dashwood WM, Li Q, Löhr CV, Fischer K, Ho E, Williams DE, Dashwood RH
Molecular carcinogenesis 2017 Jul;56(7):1733-1742
Molecular carcinogenesis 2017 Jul;56(7):1733-1742
Pro-Tumorigenic Phosphorylation of p120 Catenin in Renal and Breast Cancer.
Kourtidis A, Yanagisawa M, Huveldt D, Copland JA, Anastasiadis PZ
PloS one 2015;10(6):e0129964
PloS one 2015;10(6):e0129964
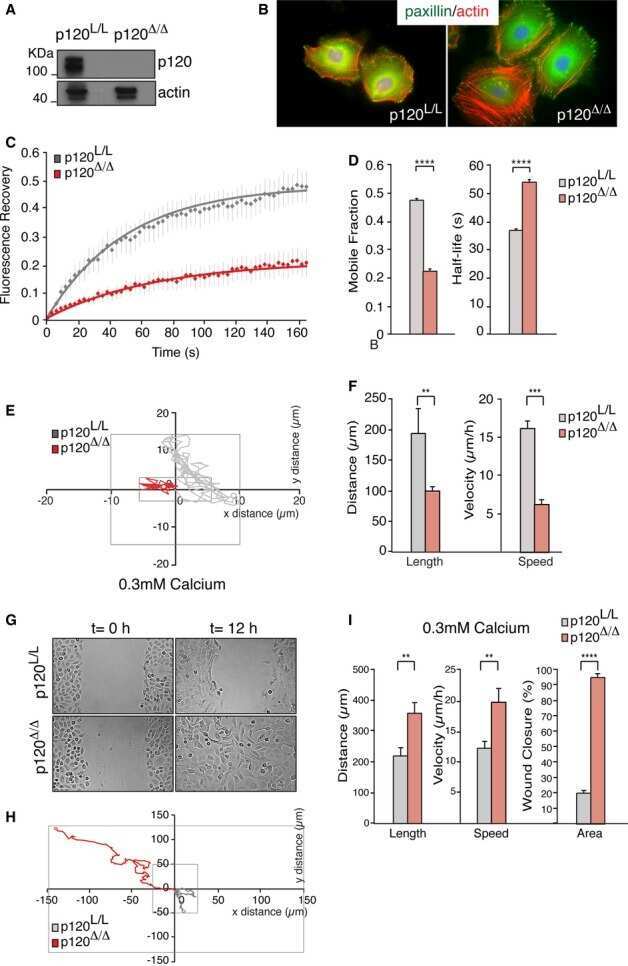
p120-catenin differentially regulates cell migration by Rho-dependent intracellular and secreted signals.
Epifano C, Megias D, Perez-Moreno M
EMBO reports 2014 May;15(5):592-600
EMBO reports 2014 May;15(5):592-600
Targeting Src family kinases inhibits bevacizumab-induced glioma cell invasion.
Huveldt D, Lewis-Tuffin LJ, Carlson BL, Schroeder MA, Rodriguez F, Giannini C, Galanis E, Sarkaria JN, Anastasiadis PZ
PloS one 2013;8(2):e56505
PloS one 2013;8(2):e56505
The Xin repeat-containing protein, mXinβ, initiates the maturation of the intercalated discs during postnatal heart development.
Wang Q, Lin JL, Chan SY, Lin JJ
Developmental biology 2013 Feb 15;374(2):264-80
Developmental biology 2013 Feb 15;374(2):264-80
CLASP2 interacts with p120-catenin and governs microtubule dynamics at adherens junctions.
Shahbazi MN, Megias D, Epifano C, Akhmanova A, Gundersen GG, Fuchs E, Perez-Moreno M
The Journal of cell biology 2013 Dec 23;203(6):1043-61
The Journal of cell biology 2013 Dec 23;203(6):1043-61
CLASP2 interacts with p120-catenin and governs microtubule dynamics at adherens junctions.
Shahbazi MN, Megias D, Epifano C, Akhmanova A, Gundersen GG, Fuchs E, Perez-Moreno M
The Journal of cell biology 2013 Dec 23;203(6):1043-61
The Journal of cell biology 2013 Dec 23;203(6):1043-61
Altered E-cadherin expression and p120 catenin localization in esophageal squamous cell carcinoma.
Chung Y, Lam AK, Luk JM, Law S, Chan KW, Lee PY, Wong J
Annals of surgical oncology 2007 Nov;14(11):3260-7
Annals of surgical oncology 2007 Nov;14(11):3260-7
Modulating the strength of cadherin adhesion: evidence for a novel adhesion complex.
Kim YJ, Sauer C, Testa K, Wahl JK, Svoboda RA, Johnson KR, Wheelock MJ, Knudsen KA
Journal of cell science 2005 Sep 1;118(Pt 17):3883-94
Journal of cell science 2005 Sep 1;118(Pt 17):3883-94
Conditional targeting of E-cadherin in skin: insights into hyperproliferative and degenerative responses.
Tinkle CL, Lechler T, Pasolli HA, Fuchs E
Proceedings of the National Academy of Sciences of the United States of America 2004 Jan 13;101(2):552-7
Proceedings of the National Academy of Sciences of the United States of America 2004 Jan 13;101(2):552-7
Regulation of cell-cell interactions by phosphatidic acid phosphatase 2b/VCIP.
Humtsoe JO, Feng S, Thakker GD, Yang J, Hong J, Wary KK
The EMBO journal 2003 Apr 1;22(7):1539-54
The EMBO journal 2003 Apr 1;22(7):1539-54
Cadherin junctions in mammary tumors.
Wheelock MJ, Soler AP, Knudsen KA
Journal of mammary gland biology and neoplasia 2001 Jul;6(3):275-85
Journal of mammary gland biology and neoplasia 2001 Jul;6(3):275-85
Cadherin junctions in mammary tumors.
Wheelock MJ, Soler AP, Knudsen KA
Journal of mammary gland biology and neoplasia 2001 Jul;6(3):275-85
Journal of mammary gland biology and neoplasia 2001 Jul;6(3):275-85
No comments: Submit comment
Supportive validation
- Submitted by
- Invitrogen Antibodies (provider)
- Main image
- Experimental details
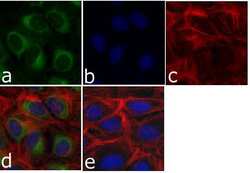
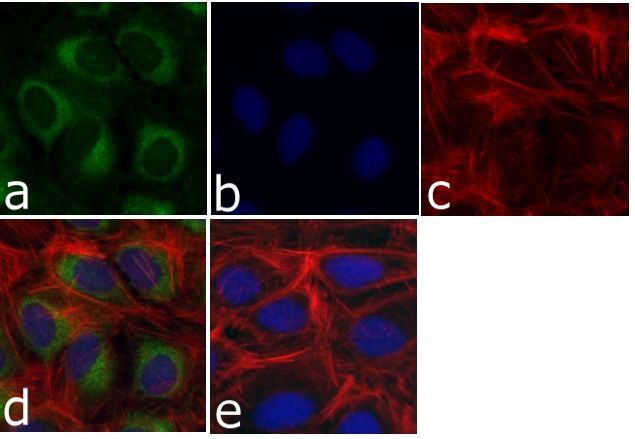
- Immunofluorescent analysis of p120 Catenin (C-Term) was done on 70% confluent log phase U-2 OS cells. The cells were fixed with 4% paraformaldehyde for 15 minutes; permeabilized with 0.25% Triton X-100 for 10 minutes followed by blocking with 5% BSA for 1 hour at room temperature. The cells were incubated with p120 Catenin (C-Term) Mouse Monoclonal Antibody (Product # 33-9600) at 1 µg/mL in 1% BSA and incubated for 3 hours at room temperature and then labeled with Alexa Fluor 488 Rabbit Anti-Mouse IgG Secondary Antibody (Product # A-11059) at a dilution of 1:400 for 30 minutes at room temperature (Panel a: green). Nuclei (Panel b: blue) were stained with SlowFade® Gold Antifade Mountant with DAPI (Product # S36938). F-actin (Panel c: red) was stained with Alexa Fluor® 594 Phalloidin (Product # A12381). Panel d is a merged image showing cytoplasmic and nuclear localization of p120 Catenin (C-Term). Panel e shows no primary antibody control. The images were captured at 20X magnification.

- Submitted by
- Invitrogen Antibodies (provider)
- Main image

- Experimental details
- Immunofluorescent analysis of p120 Catenin (C-Term) was done on 70% confluent log phase U-2 OS cells. The cells were fixed with 4% paraformaldehyde for 15 minutes; permeabilized with 0.25% Triton X-100 for 10 minutes followed by blocking with 5% BSA for 1 hour at room temperature. The cells were incubated with p120 Catenin (C-Term) Mouse Monoclonal Antibody (Product # 33-9600) at 1 µg/mL in 1% BSA and incubated for 3 hours at room temperature and then labeled with Alexa Fluor 488 Rabbit Anti-Mouse IgG Secondary Antibody (Product # A-11059) at a dilution of 1:400 for 30 minutes at room temperature (Panel a: green). Nuclei (Panel b: blue) were stained with SlowFade® Gold Antifade Mountant with DAPI (Product # S36938). F-actin (Panel c: red) was stained with Alexa Fluor® 594 Phalloidin (Product # A12381). Panel d is a merged image showing cytoplasmic and nuclear localization of p120 Catenin (C-Term). Panel e shows no primary antibody control. The images were captured at 20X magnification.
Supportive validation
- Submitted by
- Invitrogen Antibodies (provider)
- Main image

- Experimental details
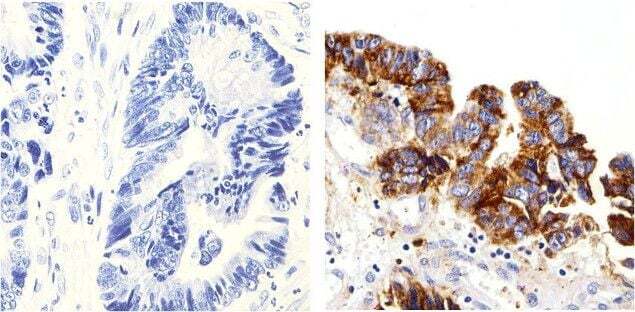
- Immunohistochemistry analysis of p120 Catenin showing staining in the Cytoplasm of paraffin-embedded human colon carcinoma (right) compared to a negative control without primary antibody (left). To expose target proteins, antigen retrieval was performed using 10mM sodium citrate (pH 6.0), microwaved for 8-15 min. Following antigen retrieval, tissues were blocked in 3% H2O2-methanol for 15 min at room temperature, washed with ddH2O and PBS, and then probed with a p120 Catenin (N-term) Mouse Monoclonal Antibody (Product # 33-9600) diluted in 3% BSA-PBS at a dilution of 1:100 overnight at 4°C in a humidified chamber. Tissues were washed extensively in PBST and detection was performed using an HRP-conjugated secondary antibody followed by colorimetric detection using a DAB kit. Tissues were counterstained with hematoxylin and dehydrated with ethanol and xylene to prep for mounting.
Supportive validation
- Submitted by
- Invitrogen Antibodies (provider)
- Main image
- Experimental details
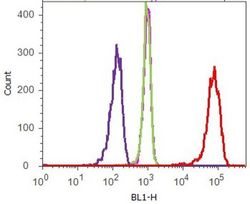
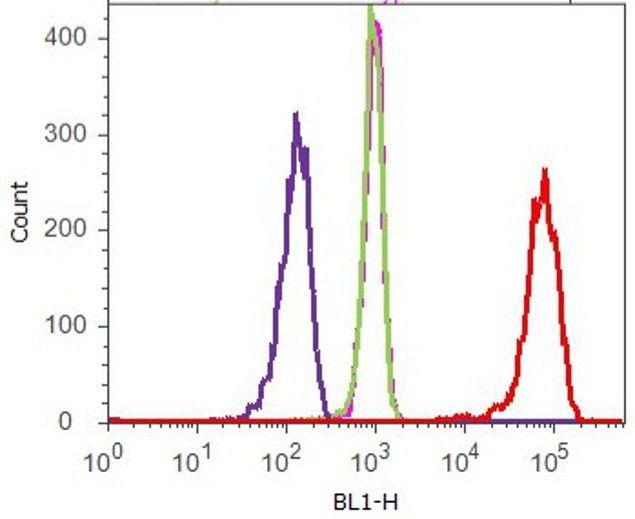
- Flow cytometry analysis of p120 Catenin (C-Term) was done on HEK-293 cells. Cells were fixed with 70% ethanol for 10 minutes, permeabilized with 0.25% Tritonª X-100 for 20 minutes, and blocked with 5% BSA for 1 hour at room temperature. Cells were labeled with p120 Catenin (C-Term) Mouse Monoclonal Antibody (339600, red histogram) or with mouse isotype control (pink histogram) at 2.5 µg/million cells in 2.5% BSA. After incubation at room temperature for 2-3 hours, the cells were labeled with Alexa Fluor¨ 488 Rabbit Anti-Mouse Secondary Antibody (A11059) at a dilution of 1:400 for 30 minutes at room temperature. The representative 10,000 cells were acquired and analyzed for each sample using an Attune¨ Acoustic Focusing Cytometer. The purple histogram represents unstained control cells and the green histogram represents no-primary-antibody control.
Supportive validation
- Submitted by
- Invitrogen Antibodies (provider)
- Main image
- Experimental details
- NULL

- Submitted by
- Invitrogen Antibodies (provider)
- Main image
- Experimental details
- NULL
- Submitted by
- Invitrogen Antibodies (provider)
- Main image
- Experimental details
- NULL
- Submitted by
- Invitrogen Antibodies (provider)
- Main image
- Experimental details
- NULL

- Submitted by
- Invitrogen Antibodies (provider)
- Main image

- Experimental details
- NULL
- Submitted by
- Invitrogen Antibodies (provider)
- Main image
- Experimental details
- NULL
- Submitted by
- Invitrogen Antibodies (provider)
- Main image
- Experimental details
- NULL
- Submitted by
- Invitrogen Antibodies (provider)
- Main image
- Experimental details
- NULL
- Submitted by
- Invitrogen Antibodies (provider)
- Main image
- Experimental details
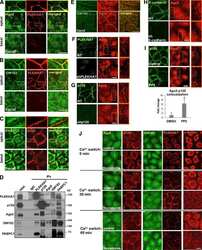
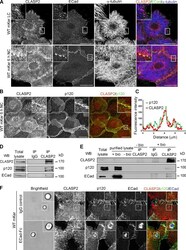
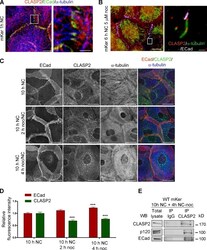
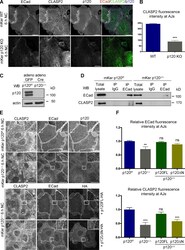
- Figure 1. CLASP2 and p120 interact at AJs. (A) WT primary mKer were grown in low confluency to allow the formation of colonies. Cells were immunostained for CLASP2, ECad, and alpha-tubulin in the presence or absence of calcium (NC, normal calcium; LC, low calcium). (B) WT primary mKer immunostained for CLASP2 and p120 in the presence of calcium to induce formation of AJs. (C) Plot profile of CLASP2 and p120 fluorescence intensity at AJs in the area indicated in B. (D) CLASP2 was immunoprecipitated from mKer treated with calcium, and the immunoprecipitates (IP) were analyzed for CLASP2, ECad, and p120 by immunoblotting. Rabbit IgGs were used as a control. (E) Cell surface proteins from mKer treated with calcium were labeled with biotin (bio) and purified with a streptavidin column. CLASP2 was immunoprecipitated from the purified lysate of surface proteins, and CLASP2, p120, and ECad were analyzed by immunoblotting. Rabbit IgGs were used as a control of the immunoprecipitation, and a lysate of cells without biotin was used as a control of the purification. (F) WT mKer incubated with ECad-Fc-coated microspheres for 5 h in the presence of calcium. IgG-coated microspheres were used as a control. Cells were immunostained for CLASP2, p120, and ECad. Insets are magnifications of the boxed regions. WB, Western blot. Bars: (A and B, main images) 25 um; (F) 10 um; (A, B, and F, insets) 5 um.

- Submitted by
- Invitrogen Antibodies (provider)
- Main image
- Experimental details
- Figure 4. CLASP2 is present at AJs either associated to MTs or in an MT-independent manner. (A) WT mKer were treated with calcium for 1 h and immunostained for CLASP2, ECad, and alpha-tubulin. The right image is a higher magnification of the selected region. (B) WT mKer were treated with calcium for 4 h followed by treatment with 5 uM nocodazole (noc) for 30 min and extraction of monomeric tubulin with saponin. Cells were immunostained for ECad, CLASP2, and alpha-tubulin. The right image is a higher magnification of the selected region. (C) WT primary mKer were treated with calcium (NC) for 10 h as a control followed by treatment with nocodazole + calcium for 2, 4, or 8 h. Cells were immunostained for ECad, CLASP2, and alpha-tubulin. (D) Random individual plot profiles at cell-cell adhesion sites ( n = 10 per cell/40-50 cells) were obtained for the different time points of nocodazole treatment. The maximum fluorescence intensity of ECad and CLASP2 for each profile was quantified and normalized to the control not treated with nocodazole. Data are represented as means +- SEM. ***, P < 0.0001, Mann-Whitney U for ECad; ***, P < 0.001, Student's t test for CLASP2. (E) CLASP2 was immunoprecipitated from mKer treated with calcium for 10 h followed by treatment with nocodazole + calcium for 4 h. The immunoprecipitates (IP) were analyzed for CLASP2, p120, and ECad by immunoblotting. WB, Western blot. Bars: (A, main image) 7.5 um; (A, inset) 2 um; (B, main image, and C) 25 um; (B,

- Submitted by
- Invitrogen Antibodies (provider)
- Main image
- Experimental details
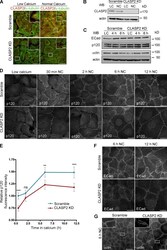
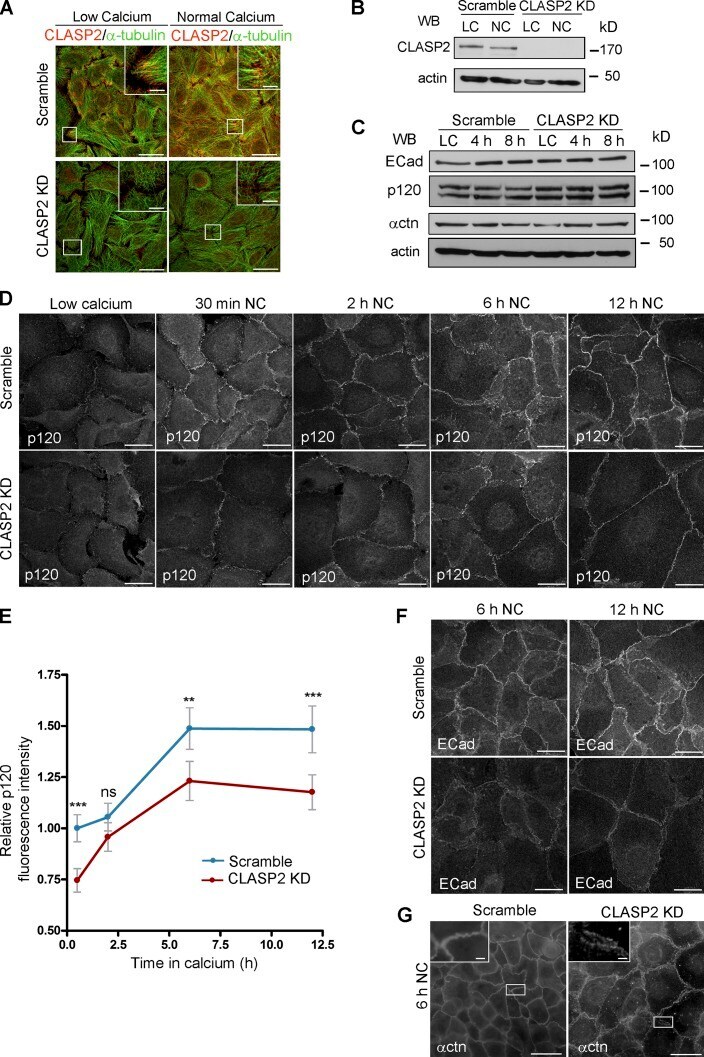
- Figure 5. CLASP2 is required for the proper formation of AJs. (A) WT mKer were infected with lentiviruses expressing either CLASP2 shRNA (CLASP2 knockdown [KD]) or scramble shRNA (scramble). The levels of CLASP2 were analyzed by immunofluorescence after selection with G418. (B) Western blot (WB) showing the levels of CLASP2 after infection with the corresponding lentiviruses. (C) Western blot showing the total levels of ECad, p120, and alpha-catenin (alphactn) in scramble and CLASP2 knockdown mKer at different time points of a calcium-switch time course experiment. (D) Scramble and CLASP2-deficient mKer were subjected to calcium switch for 30 min, 2 h, 6 h, and 12 h and immunostained for p120. (E) Quantification of p120 levels at the membrane in scramble and CLASP2-deficient mKer. Random individual plot profiles were generated at sites of cell-cell adhesion (10 per cell, 25-35 cells), and the maximum fluorescence intensity was quantified. Data are normalized to scramble control values after 30 min of calcium treatment and represented as means +- SEM; **, P < 0.003; ***, P < 0.0001, Mann-Whitney U test. (F) Scramble and CLASP2-deficient mKer treated with calcium for either 6 or 12 h and immunostained for ECad. (G) Scramble and CLASP2-deficient mKer immunostained for alpha-catenin after 6-h calcium switch. Insets are magnifications of the boxed regions. Bars: (A, main images, D, and F) 25 um; (G, main images) 50 um; (A and G, insets) 5 um.
- Submitted by
- Invitrogen Antibodies (provider)
- Main image
- Experimental details
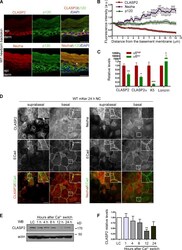
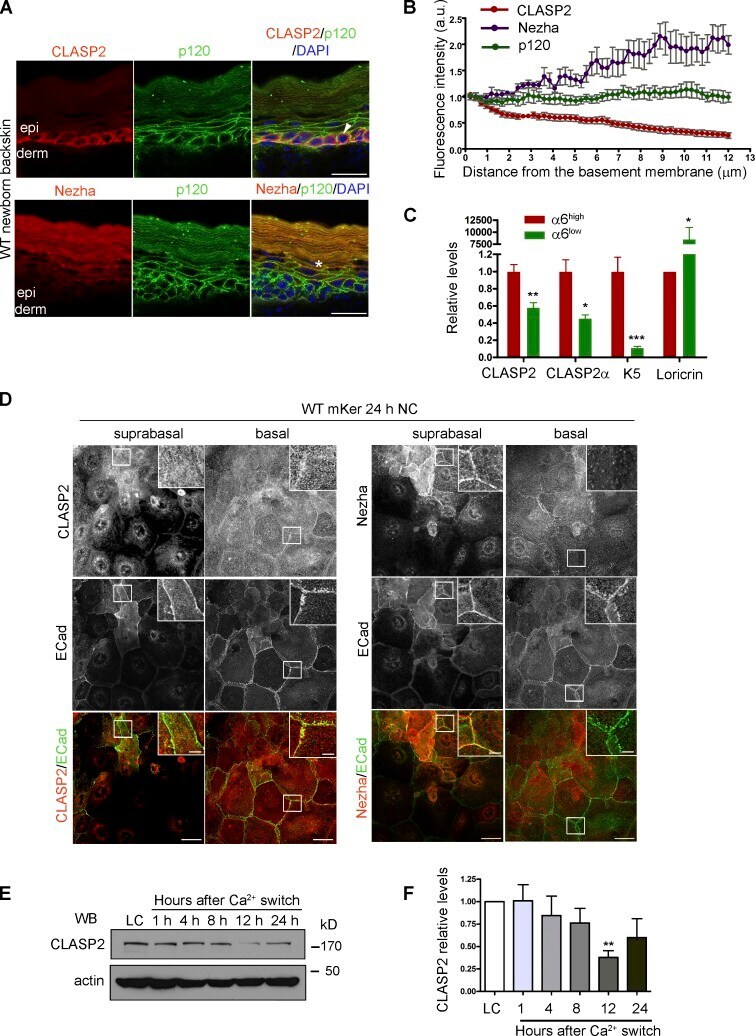
- Figure 8. Differential distribution of CLASP2 and Nezha in the epidermis. (A) Back skins from WT newborn mice stained for CLASP2/p120 or Nezha/p120. The arrow denotes the basal distribution of CLASP2, and the asterisk indicates suprabasal Nezha localization. epi, epidermis; derm, dermis. (B) Quantification of CLASP2, Nezha, and p120 levels in the epidermis of newborn WT mice. Individual plot profiles were generated across the epidermis, and mean values of fluorescence intensity relative to those expressed at the basement membrane are shown. Data are represented as means +- SEM. ( n = 3 mice, 30 plot profiles per mice per staining). a.u., arbitrary unit. (C) Real-time PCR analysis of mKer isolated from the back skin of newborn mice and FACS sorted according to their levels of alpha6 integrin into two populations: alpha6 high (basal mKer) and alpha6 low (suprabasal mKer). CLASP2 levels were analyzed with two different combinations of primers. Keratin 5 (K5) and loricrin were used as markers of basal and suprabasal mKer, respectively. For each primer pair, values were normalized to the transcript levels of the alpha6 high population. Data are represented as means +- SEM; ***, P < 0.0004; **, P < 0.002; *, P < 0.03, Student's t test. (D) WT mKer subjected to a 24-h calcium switch in vitro and immunostained for either CLASP2 or Nezha together with p120 and ECad. Insets are magnifications of the boxed regions. (E) Immunoblot analysis of CLASP2 levels in WT mKer subjected to a
- Submitted by
- Invitrogen Antibodies (provider)
- Main image
- Experimental details
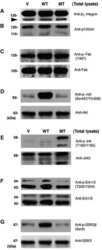
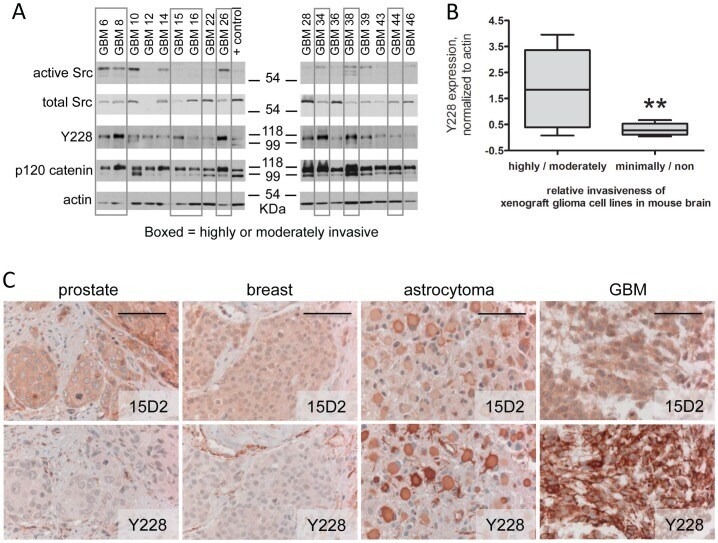
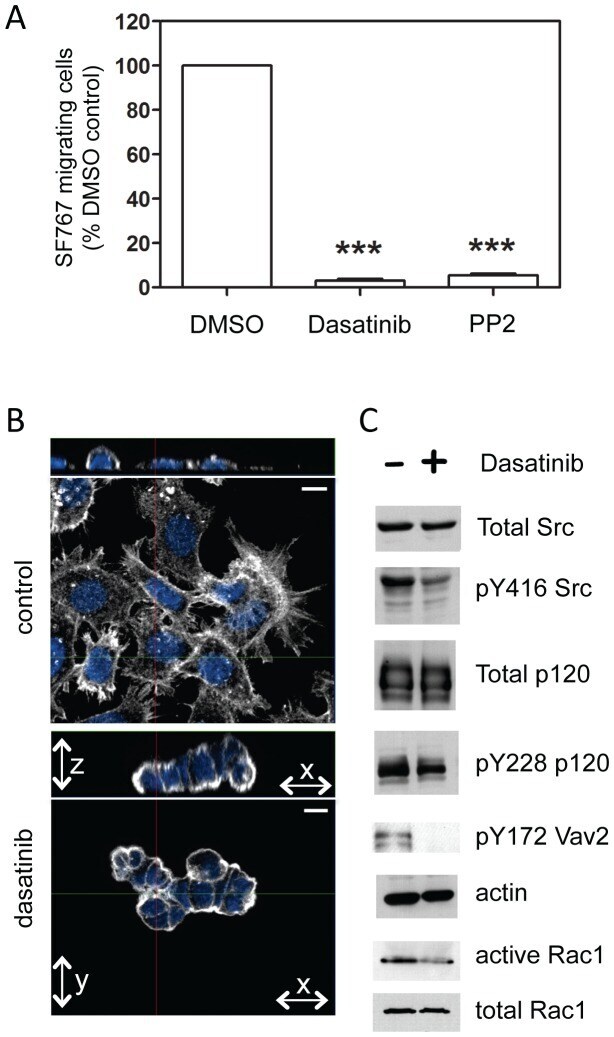
- Figure 1 Activation of Src and p120 phosphorylation correlates with increased glioma invasiveness. A. Seventeen glioma cell lines propagated as xenografts in mouse flank were examined by western blot for expression of active (Y416-phosphorylated) and total Src and Y228-phosphorylated and total p120 catenin proteins. Actin is a loading control. The positive control lysate is from MDA231 cells. Xenograft lines were previously classified based on their relative invasiveness as highly or moderately invasive (data boxed in gray) or minimally or non-invasive (not boxed). B. The level of Y228-phosphorylated p120 catenin expression (relative to actin expression) as determined by Western blot for each cell line was plotted vs. relative glioma invasiveness. The lines through the data indicate the median for each invasiveness category; n = 8 highly/moderately invasive lines and n = 9 minimally/non-invasive lines; **indicates a statistical difference (one-tailed, unpaired t test) between the two categories of invasiveness at p
- Submitted by
- Invitrogen Antibodies (provider)
- Main image
- Experimental details
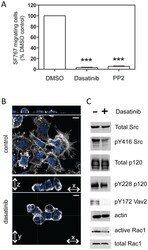
- Figure 3 Dasatinib inhibits activation of SFKs and downstream targets in glioma. A. Migration of SF767 cells in the absence or presence of 10 uM dasatinib or 10 uM PP2 was determined using a trans-well migration assay. Inhibition of SFKs with dasatinib or PP2 resulted in fewer SF767 cells migrating toward the chemoattractant. The differences vs. control (DMSO) treatment are statistically significant (n = 4; one-way ANOVA with Dunnett's Multiple Comparisons post test; *** indicates p
- Submitted by
- Invitrogen Antibodies (provider)
- Main image
- Experimental details
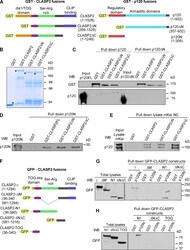
- Figure 2. p120 and CLASP2 interact via the N-terminal domain of p120 and the Ser/Arg-rich region of CLASP2. (A) GST-tagged constructs of p120 and CLASP2 used for the in vitro pull-down assays. (B) SDS-PAGE gel showing the purified GST-CLASP2 recombinant proteins stained with Coomassie blue. Asterisks indicate bands of the expected molecular mass. (C) In vitro binding assay of GST-CLASP2 recombinant proteins with purified p120FL and p120DeltaN (previously cleaved from GST with the PreScission Protease). (D) In vitro binding of GST-CLASP2 recombinant proteins with purified p120N. (E) Pull-down assay using the recombinant GST-CLASP2 proteins as bait for endogenous p120 present in lysates of mKer treated with calcium for 4 h. (E) GFP-tagged constructs of CLASP2. (F) Pull-down assays using GST-p120N recombinant protein and lysates of 293T cells expressing equal amounts of the GFP-tagged CLASP2 constructs of E. Pulled down proteins were immunoblotted for GFP. (H) Pull-down assay using GST-p120N recombinant protein and lysates of 293T cells expressing equal amounts of either GFP-CLASP2-N1 or GFP-CLASP2-DeltaNDeltaC or GFP-CLASP2-TOG. WB, Western blot.

- Submitted by
- Invitrogen Antibodies (provider)
- Main image
- Experimental details
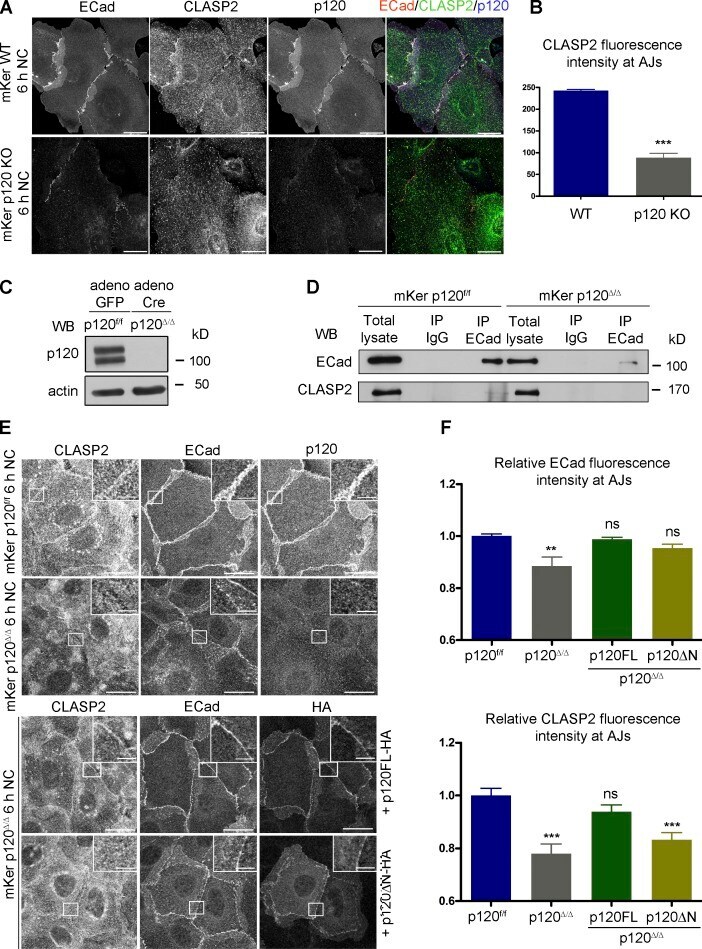
- Figure 3. p120 is required for the recruitment of CLASP2 to AJs. (A) WT and p120 KO primary mKer immunostained for ECad, CLASP2, and p120 in the presence of calcium (NC). (B) Random individual plot profiles ( n = 10 per cell/10 cells) were obtained from WT and p120 KO mKer. The fluorescence intensity level of CLASP2 corresponding to the maximum ECad intensity in each profile was quantified. Data are represented as means +- SEM; ***, P < 0.0001, Mann-Whitney U test. (C) Western blot (WB) showing the levels of p120 in primary mKer infected either with adeno-GFP (p120 f/f ) as a control or adeno-Cre-GFP (p120 Delta/Delta ). (D) ECad was immunoprecipitated from control p120 f/f or from p120- mKer (p120 Delta/Delta ). The immunoprecipitates (IP) were analyzed for ECad and CLASP2 by immunoblotting. (E) p120 Delta/Delta mKer were transfected with either p120FL-HA or p120DeltaN-HA and switched to a normal calcium media (NC) for 6 h. p120 f/f and p120 Delta/Delta mKer nontransfected were used as controls. Cells were immunostained for CLASP2, ECad, and HA. Insets are magnifications of the boxed regions. (F) Quantification of ECad and CLASP2 fluorescence intensity at AJs. Random individual plot profiles were generated at sites of cell-cell adhesion. The maximum value of ECad fluorescence intensity in the profile and its associated CLASP2 fluorescence intensity were quantified. Data were normalized to control values (p120 f/f mKer) and represented as means +- SEM. **, P < 0.002, Mann
- Submitted by
- Invitrogen Antibodies (provider)
- Main image
- Experimental details
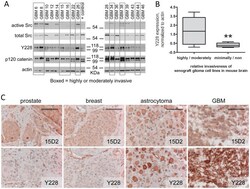
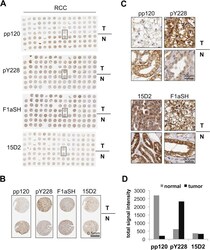
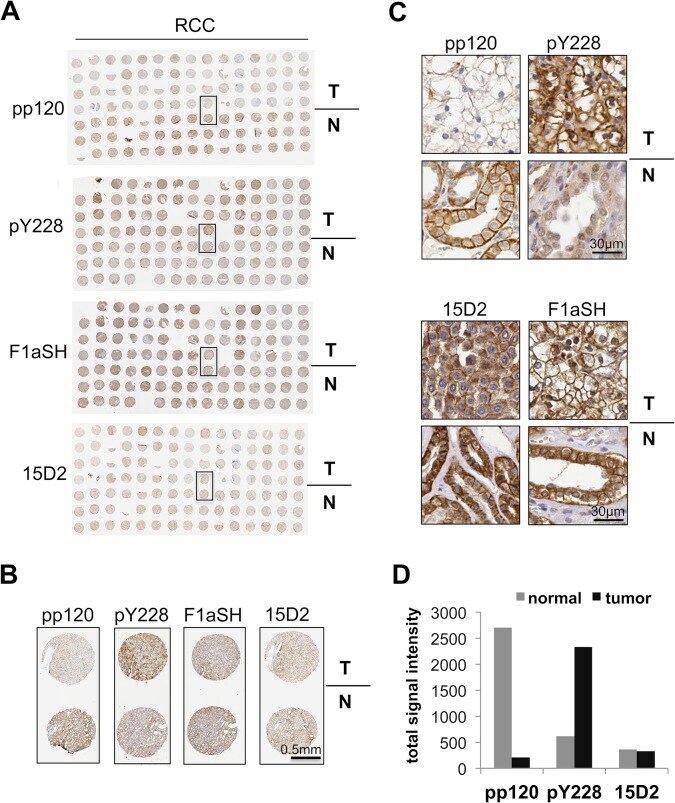
- Fig 1 p120 phosphorylation at Y228 is elevated in RCC samples. Tissue microarrays (TMAs) of normal and tumor matched renal cell carcinoma (RCC) samples, stained by IHC for p120 using the pp120, pY228, 15D2 and F1aSH antibodies. The whole TMA stainings are shown in ( A ); a selected tumor-normal sample pair in ( B ); and details of the stainings of the selected pair in ( C ). Scale bars are shown on the bottom right in (B) and (C). ( D ) Quantitation of the signal of the TMA staining obtained by using pp120, pY228 and F1aSH; n = 15.
- Submitted by
- Invitrogen Antibodies (provider)
- Main image
- Experimental details
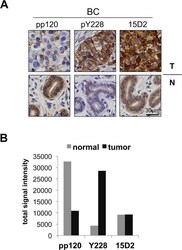
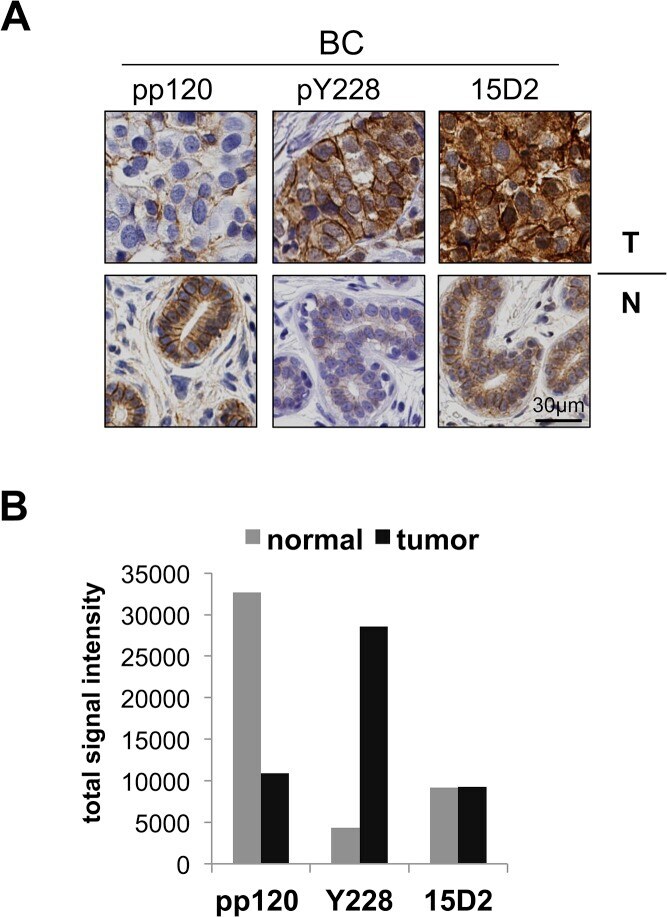
- Fig 2 p120 phosphorylation at Y228 is elevated in BC tissues. ( A ) Breast normal and tumor (BC) samples stained by IHC for p120 using the pp120, pY228, and 15D2 antibodies. ( B ) Quantitation of the signal of the BC samples staining obtained by using pp120, pY228 and 15D2; n = 9.
- Submitted by
- Invitrogen Antibodies (provider)
- Main image

- Experimental details
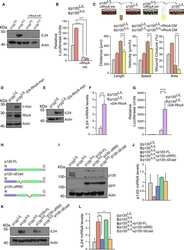
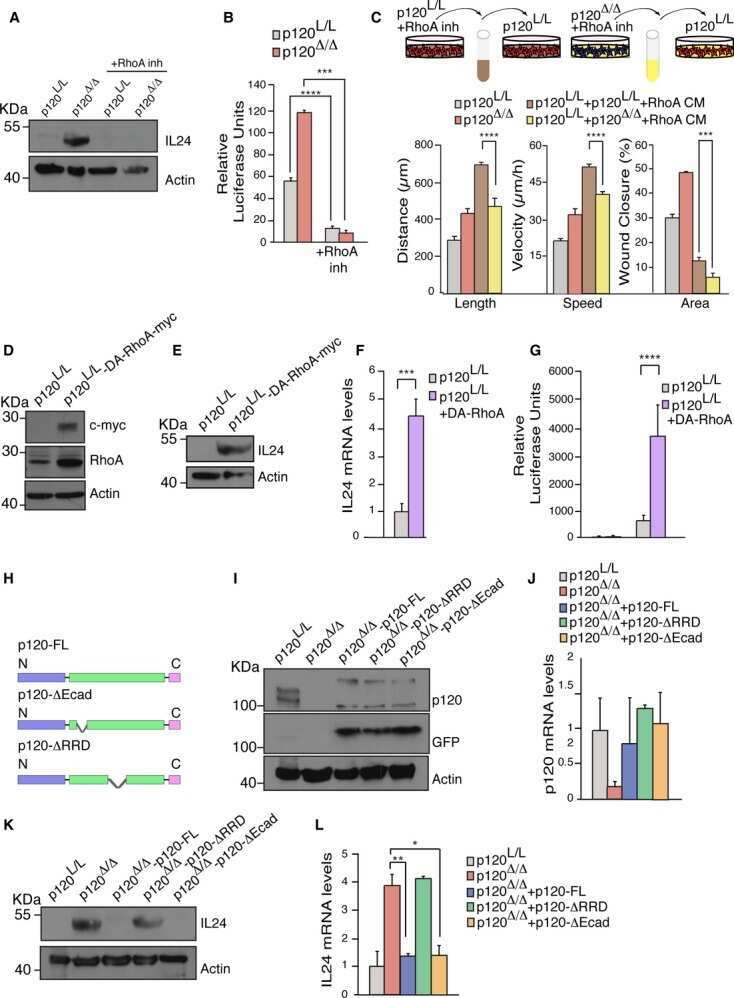
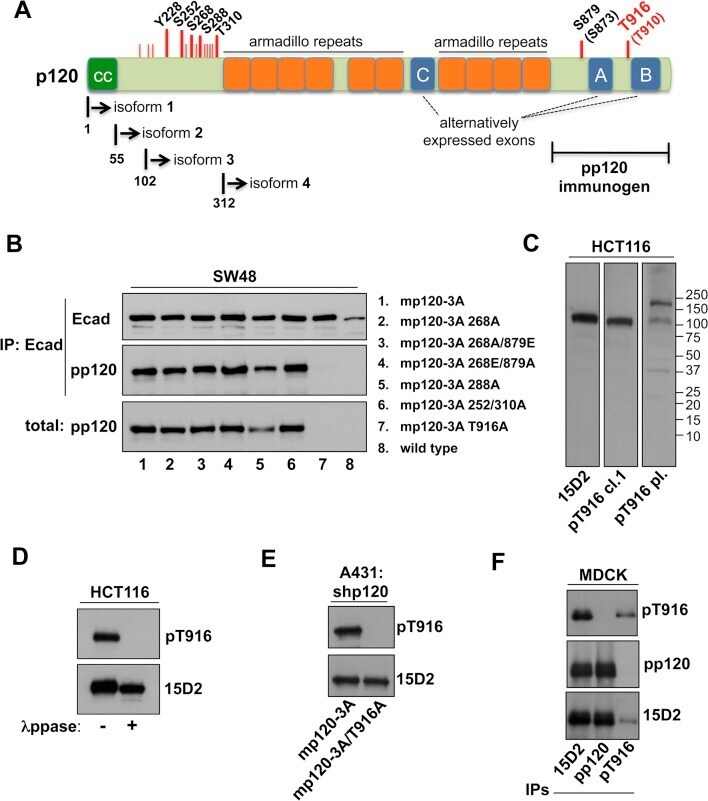
- Fig 3 The pp120 antibody binds p120 around the T916 site and fails to recognize it, when it is phosphorylated. ( A ) Schematic of the p120 protein, depicting the different domains, the phosphorylation sites (in red lines), the different p120 isoforms and the region used as the pp120 immunogen. ( B ) E-cadherin (Ecad), and pp120 western blots of the p120-mutated SW48 colon cancer cells transfected with the constructs shown (1-7) or without (8), lysed and immunoprecipitated with E-cadherin. ( C ) Western blot of HCT116 cell lysates using either 15D2, a monoclonal T916 (cl.1) and a polyclonal T916 antibody (pl.). Molecular weights are shown on the right. ( D ) Western blot of HCT116 cell lysates treated with or without lamda phosphatase and blotted for the monoclonal T916 (cl.1) and 15D2. ( E ) p120-depleted A431 cells were transfected with either murine wild type p120 isoform 3 (mp120-3A) or a construct with the T916 site mutated to alanine (mp120-3A T916A), and blotted for the monoclonal T916 (cl.1) and 15D2 antibodies. ( F ) Westen blot of MDCK lysates using pp120, 15D2 or T916 (cl.1) after immunoprecipitation with the same antibodies.
- Submitted by
- Invitrogen Antibodies (provider)
- Main image
- Experimental details
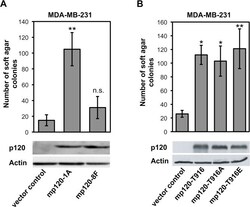
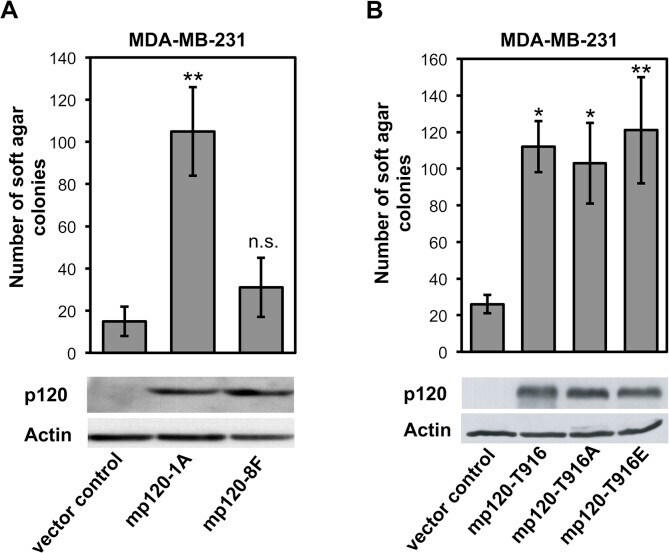
- Fig 5 Phosphorylation at Y228 but not at T916 is critical for the transforming ability of p120. Breast cancer MDA-MB-231 cells were depleted of endogenous p120 and were transfected with: ( A ) vector control, full-length wild-type murine p120 isoform 1A (mp120-1A), or murine p120 isoform 1A where eight Src-targeted tyrosine phosphorylation sites, including Y228, were mutated to phenylalanine (mp120-8F); ( B ) vector control, murine wild type p120 (mp120-T916), or with murine p120 constructs where the T916 site was mutated to either alanine (mp120-T916A) or to glutamic acid (mp120-T916E). Cells in all cases were grown to soft agar and colonies were counted (mean +-SEM, n = 6; ** p
- Submitted by
- Invitrogen Antibodies (provider)
- Main image
- Experimental details
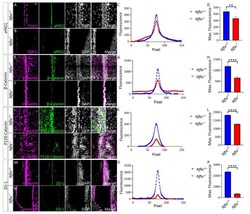
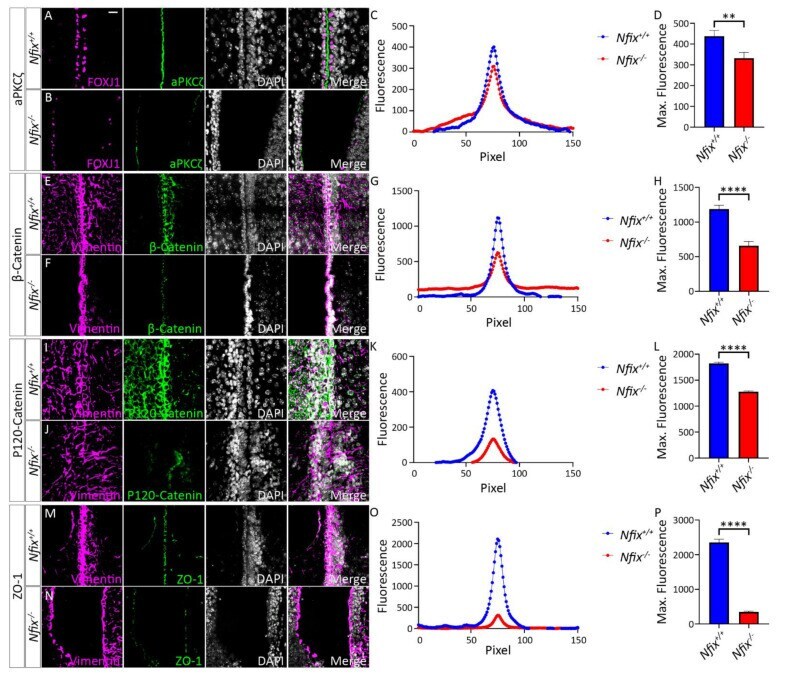
- Figure 1 P5 Nfix -/- mice demonstrate abnormal localisation of key adhesion proteins to the cell junction. ( A , B , M , N ) Images of brain lateral ventricles from P5 Nfix +/+ ( A ) and Nfix -/- ( B ) mice marked with antibodies against ependymal marker FOXJ1 ( A , B ) or Vimentin ( M , N ) (purple), tight junction protein aPKCzeta ( A , B ) or ZO-1 ( M , N ) (green) and nuclear marker DAPI (grey) displayed separately and merged for each genotype. ( C , O ) Average fluorescence intensity of aPKCzeta ( C ) and ZO-1 ( O ) across the cell junctions of Nfix -/- (red) and Nfix +/+ (blue) ependymal cells. The peak fluorescence intensities of aPKCzeta and ZO-1 are lowered in Nfix -/- mice compared to controls. ( D , P ) Maximum fluorescent intensities of aPKCzeta ( D ) and ZO-1 ( P ) across the cell junctions of Nfix -/- (red) and Nfix +/+ (blue) ependymal cells. Maximum fluorescent intensity of aPKCzeta is significantly reduced in Nfix -/- mice compared to controls. ( E , F , I , J ) Images of brain lateral ventricles from P5 Nfix +/+ ( E , I ) and Nfix -/- ( F , J ) mice marked with antibodies against ependymal marker vimentin (purple), adherens junction protein beta-Catenin ( E , F ) or P120-Catenin ( I , J ) (green) and nuclear marker DAPI (grey) displayed separately and merged for each genotype. ( G , K ) Average fluorescent intensities of beta-Catenin ( G ) and P120-Catenin ( K ) across the cell junctions of Nfix -/- (red) and Nfix +/+ (blue) ependymal cells. The peak fluores
- Submitted by
- Invitrogen Antibodies (provider)
- Main image
- Experimental details
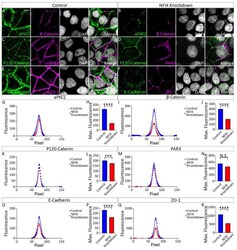
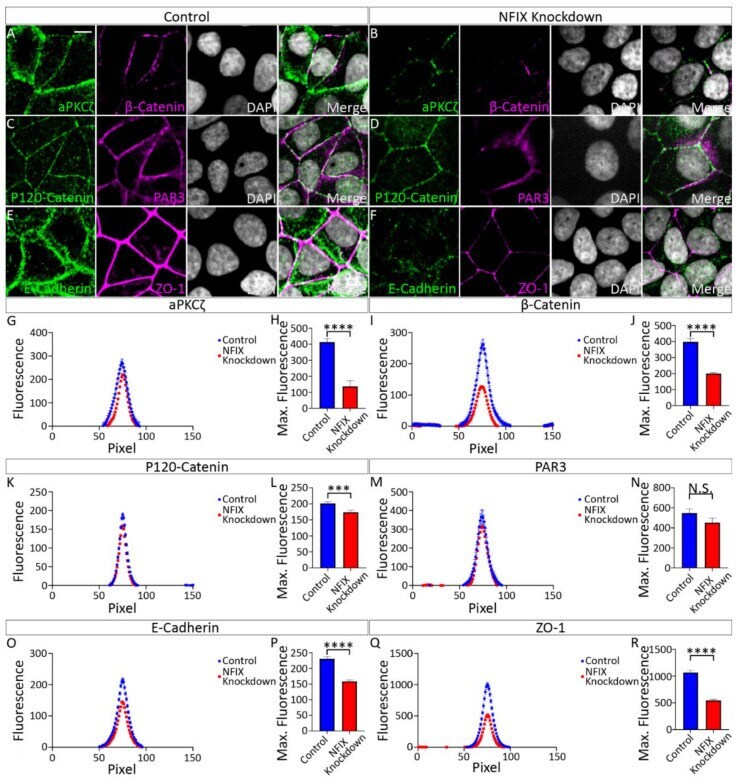
- Figure 5 MCF7 cells treated with NFIX knockdown lentivirus demonstrate reduced localisation of adhesion proteins. ( A , B ) Images depicting MCF7 cells treated with scramble RNA lentivirus (scramble, A ) or NFIX shRNA lentivirus (NFIX KD, B ) and stained with antibodies against tight junction marker aPKCzeta (green), adherens junction marker beta-Catenin (purple) and nuclear marker DAPI (grey) displayed as separate panels or merged. ( C , D ) Images depicting NFIX KD ( C ) and scramble ( D ) cells stained with antibodies against adherens junction marker P120-Catenin (green), tight junction marker PAR3 (purple) and nuclear marker DAPI (grey) displayed as separate panels or merged ( E , F ) Images depicting NFIX KD ( E ) and scramble ( F ) cells stained with antibodies against adherens junction marker E-Cadherin (green), tight junction marker ZO-1 (purple) and nuclear marker DAPI (grey) displayed as separate panels or merged. ( G , I , K , M , O , Q ) Average fluorescent intensity across the cell junction was plotted for line scanning measurements of aPKCzeta ( G ), beta-Catenin ( I ), P120-Catenin ( K ), PAR3 ( M ), E-Cadherin ( O ) and ZO-1 ( Q ) for NFIX KD cells and controls. Tight junction proteins aPKCzeta and ZO-1 demonstrated reduced fluorescent intensity peaks in NFIX KD cells compared to controls. Tight junction protein PAR3 demonstrated no changes between treatment conditions. Adherens junction proteins beta-Catenin, P120-Catenin and E-Cadherin demonstrated reduced p
- Submitted by
- Invitrogen Antibodies (provider)
- Main image
- Experimental details
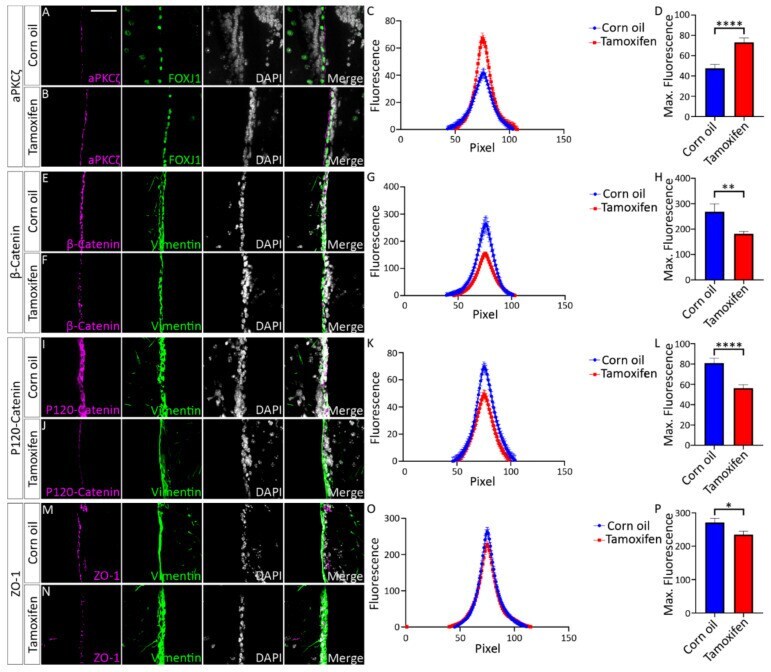
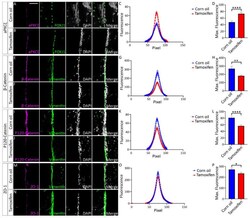
- Tamoxifen treated Nfix iFOXJ1-GFP ependymal cells demonstrate reduced expression of adhesion proteins. ( A , B ) Lateral ventricle sections from Nfix iFOXJ1-GFP mice treated with corn oil ( A ) and tamoxifen ( B ) at 7 dpi labelled with aPKCzeta (purple), ependymal cell marker FOXJ1 (green) and nuclear marker DAPI (grey), displayed separately and merged. ( C ) Average aPKCzeta fluorescent intensity across the cell junction is displayed for tamoxifen treated Nfix iFOXJ1-GFP ependymal cells and controls. Average aPKCzeta fluorescent intensity across the cell junction was increased at the peak in tamoxifen treated Nfix iFOXJ1-GFP ependymal cells compared to controls. ( D ) Maximum aPKCzeta fluorescent intensity is displayed for tamoxifen treated Nfix iFOXJ1-GFP ependymal cells and controls. Maximum aPKCzeta fluorescent intensity is significantly increased in tamoxifen treated Nfix iFOXJ1-GFP ependymal cells compared to controls. ( E , F ) Lateral ventricle sections from Nfix iFOXJ1-GFP mice treated with corn oil ( E ) and tamoxifen ( F ) at 7 dpi labelled with beta-Catenin (purple), ependymal cell marker Vimentin (green) and nuclear marker DAPI (white), displayed separately and merged. ( G ) Average beta-Catenin fluorescent intensity across the cell junction is displayed for tamoxifen treated Nfix iFOXJ1-GFP ependymal cells and controls. Peak beta-Catenin fluorescent intensity is reduced in tamoxifen treated Nfix iFOXJ1-GFP mice compared to controls. ( H ) Maximum beta-Catenin f