Explore
 Validate
 Learn
Learn33-9700
antibody from Invitrogen Antibodies
Targeting: CTNND1
CTNND, KIAA0384, p120, p120cas, p120ctn
 Western blot
 ELISA
ELISA Immunocytochemistry Immunoprecipitation Immunohistochemistry Flow cytometry Other assay
Antibody data
- Antibody Data
- Antigen structure
- References [8]
- Comments [0]
- Validations
- Immunocytochemistry [2]
- Immunohistochemistry [2]
- Flow cytometry [1]
- Other assay [11]
Submit
Validation data
Reference
Comment
Report error
- Product number
- 33-9700 - Provider product page

- Provider
- Invitrogen Antibodies
- Product name
- delta Catenin Monoclonal Antibody (6H11)
- Antibody type
- Monoclonal
- Antigen
- Recombinant full-length protein
- Reactivity
- Human, Mouse, Rat, Canine, Chicken/Avian
- Host
- Mouse
- Isotype
- IgG
- Antibody clone number
- 6H11
- Vial size
- 100 μL
- Concentration
- Conc. Not Determined
- Storage
- -20°C
Submitted references Transmembrane proteoglycans control stretch-activated channels to set cytosolic calcium levels.
Cell surface heparan sulfate proteoglycans control adhesion and invasion of breast carcinoma cells.
CLASP2 interacts with p120-catenin and governs microtubule dynamics at adherens junctions.
CLASP2 interacts with p120-catenin and governs microtubule dynamics at adherens junctions.
N-cadherin induces partial differentiation of cholinergic presynaptic terminals in heterologous cultures of brainstem neurons and CHO cells.
p120 catenin is required for normal renal tubulogenesis and glomerulogenesis.
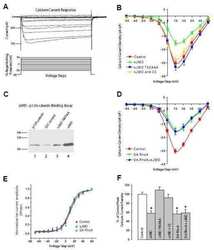
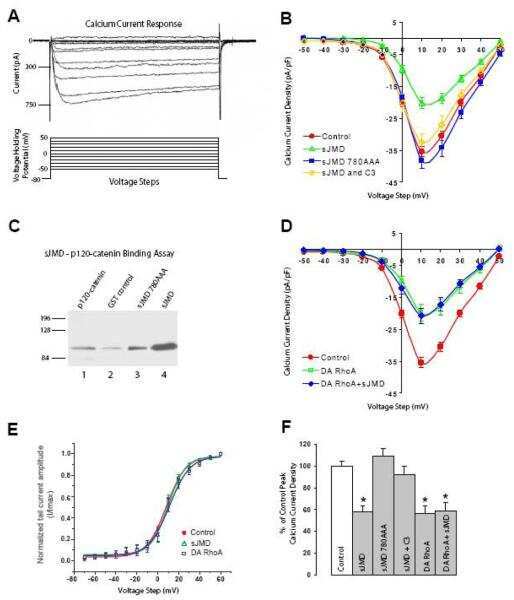
N-cadherin modulates voltage activated calcium influx via RhoA, p120-catenin, and myosin-actin interaction.
The protein tyrosine phosphatase Pez is a major phosphatase of adherens junctions and dephosphorylates beta-catenin.
Gopal S, Søgaard P, Multhaupt HA, Pataki C, Okina E, Xian X, Pedersen ME, Stevens T, Griesbeck O, Park PW, Pocock R, Couchman JR
The Journal of cell biology 2015 Sep 28;210(7):1199-211
The Journal of cell biology 2015 Sep 28;210(7):1199-211
Cell surface heparan sulfate proteoglycans control adhesion and invasion of breast carcinoma cells.
Lim HC, Multhaupt HA, Couchman JR
Molecular cancer 2015 Jan 27;14(1):15
Molecular cancer 2015 Jan 27;14(1):15
CLASP2 interacts with p120-catenin and governs microtubule dynamics at adherens junctions.
Shahbazi MN, Megias D, Epifano C, Akhmanova A, Gundersen GG, Fuchs E, Perez-Moreno M
The Journal of cell biology 2013 Dec 23;203(6):1043-61
The Journal of cell biology 2013 Dec 23;203(6):1043-61
CLASP2 interacts with p120-catenin and governs microtubule dynamics at adherens junctions.
Shahbazi MN, Megias D, Epifano C, Akhmanova A, Gundersen GG, Fuchs E, Perez-Moreno M
The Journal of cell biology 2013 Dec 23;203(6):1043-61
The Journal of cell biology 2013 Dec 23;203(6):1043-61
N-cadherin induces partial differentiation of cholinergic presynaptic terminals in heterologous cultures of brainstem neurons and CHO cells.
Flannery RJ, Brusés JL
Frontiers in synaptic neuroscience 2012;4:6
Frontiers in synaptic neuroscience 2012;4:6
p120 catenin is required for normal renal tubulogenesis and glomerulogenesis.
Marciano DK, Brakeman PR, Lee CZ, Spivak N, Eastburn DJ, Bryant DM, Beaudoin GM 3rd, Hofmann I, Mostov KE, Reichardt LF
Development (Cambridge, England) 2011 May;138(10):2099-109
Development (Cambridge, England) 2011 May;138(10):2099-109
N-cadherin modulates voltage activated calcium influx via RhoA, p120-catenin, and myosin-actin interaction.
Marrs GS, Theisen CS, Brusés JL
Molecular and cellular neurosciences 2009 Mar;40(3):390-400
Molecular and cellular neurosciences 2009 Mar;40(3):390-400
The protein tyrosine phosphatase Pez is a major phosphatase of adherens junctions and dephosphorylates beta-catenin.
Wadham C, Gamble JR, Vadas MA, Khew-Goodall Y
Molecular biology of the cell 2003 Jun;14(6):2520-9
Molecular biology of the cell 2003 Jun;14(6):2520-9
No comments: Submit comment
Supportive validation
- Submitted by
- Invitrogen Antibodies (provider)
- Main image

- Experimental details
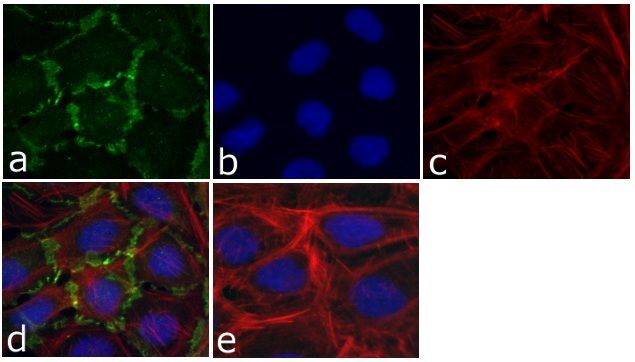
- Immunofluorescent analysis of p120 Catenin (N-Term) was done on 70% confluent log phase U-2 OS cells. The cells were fixed with 4% paraformaldehyde for 15 minutes; permeabilized with 0.25% Triton™ X-100 for 10 minutes followed by blocking with 5% BSA for 1 hour at room temperature. The cells were incubated with p120 Catenin (N-Term) Mouse Monoclonal Antibody (Product # 33-9700) at 1 µg/mL in 1% BSA and incubated for 3 hours at room temperature and then labeled with Alexa Fluor 488 Rabbit Anti-Mouse IgG Secondary Antibody (Product # A-11059) at a dilution of 1:400 for 30 minutes at room temperature (Panel a: green). Nuclei (Panel b: blue) were stained with SlowFade Gold Antifade Mountant with DAPI (Product # S36938). F-actin (Panel c: red) was stained with Alexa Fluor 594 Phalloidin (Product # A12381). Panel d is a merged image showing junctional localization of p120 Catenin (N-Term) and panel e is a no primary antibody control. The images were captured at 20X magnification.

- Submitted by
- Invitrogen Antibodies (provider)
- Main image

- Experimental details
- Immunofluorescent analysis of p120 Catenin (N-Term) was done on 70% confluent log phase U-2 OS cells. The cells were fixed with 4% paraformaldehyde for 15 minutes; permeabilized with 0.25% Triton X-100 for 10 minutes followed by blocking with 5% BSA for 1 hour at room temperature. The cells were incubated with p120 Catenin (N-Term) Mouse Monoclonal Antibody (Product # 33-9700) at 1 µg/mL in 1% BSA and incubated for 3 hours at room temperature and then labeled with Alexa Fluor 488 Rabbit Anti-Mouse IgG Secondary Antibody (Product # A-11059) at a dilution of 1:400 for 30 minutes at room temperature (Panel a: green). Nuclei (Panel b: blue) were stained with SlowFade Gold Antifade Mountant with DAPI (Product # S36938). F-actin (Panel c: red) was stained with Alexa Fluor 594 Phalloidin (Product # A12381). Panel d is a merged image showing junctional localization of p120 Catenin (N-Term) and panel e is a no primary antibody control. The images were captured at 20X magnification.
Supportive validation
- Submitted by
- Invitrogen Antibodies (provider)
- Main image
- Experimental details
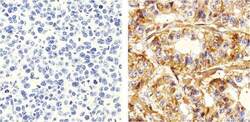
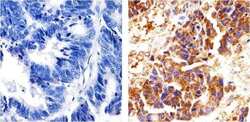
- Immunohistochemistry analysis of p120 Catenin showing staining in the Cytoplasm of paraffin-embedded human breast carcinoma (right) compared to a negative control without primary antibody (left). To expose target proteins, antigen retrieval was performed using 10mM sodium citrate (pH 6.0), microwaved for 8-15 min. Following antigen retrieval, tissues were blocked in 3% H2O2-methanol for 15 min at room temperature, washed with ddH2O and PBS, and then probed with a p120 Catenin (N-term) Mouse Monoclonal Antibody (Product # 33-9700) diluted in 3% BSA-PBS at a dilution of 1:50 overnight at 4°C in a humidified chamber. Tissues were washed extensively in PBST and detection was performed using an HRP-conjugated secondary antibody followed by colorimetric detection using a DAB kit. Tissues were counterstained with hematoxylin and dehydrated with ethanol and xylene to prep for mounting.
- Submitted by
- Invitrogen Antibodies (provider)
- Main image
- Experimental details
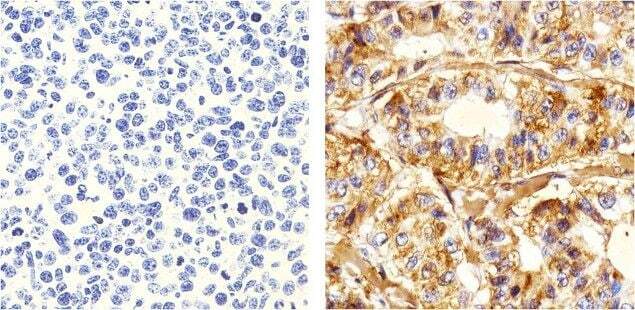
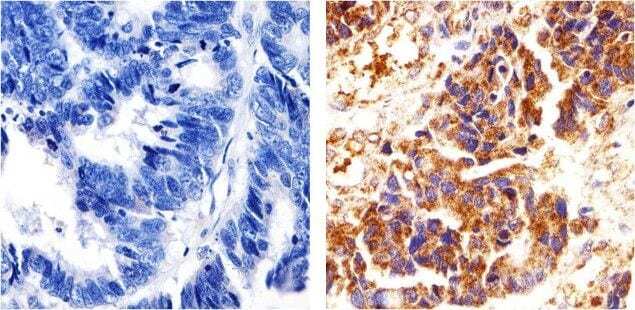
- Immunohistochemistry analysis of p120 Catenin showing staining in the Cytoplasm of paraffin-embedded human colon carcinoma (right) compared to a negative control without primary antibody (left). To expose target proteins, antigen retrieval was performed using 10mM sodium citrate (pH 6.0), microwaved for 8-15 min. Following antigen retrieval, tissues were blocked in 3% H2O2-methanol for 15 min at room temperature, washed with ddH2O and PBS, and then probed with a p120 Catenin (N-term) Mouse Monoclonal Antibody (Product # 33-9700) diluted in 3% BSA-PBS at a dilution of 1:50 overnight at 4°C in a humidified chamber. Tissues were washed extensively in PBST and detection was performed using an HRP-conjugated secondary antibody followed by colorimetric detection using a DAB kit. Tissues were counterstained with hematoxylin and dehydrated with ethanol and xylene to prep for mounting.
Supportive validation
- Submitted by
- Invitrogen Antibodies (provider)
- Main image
- Experimental details
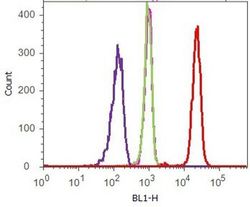
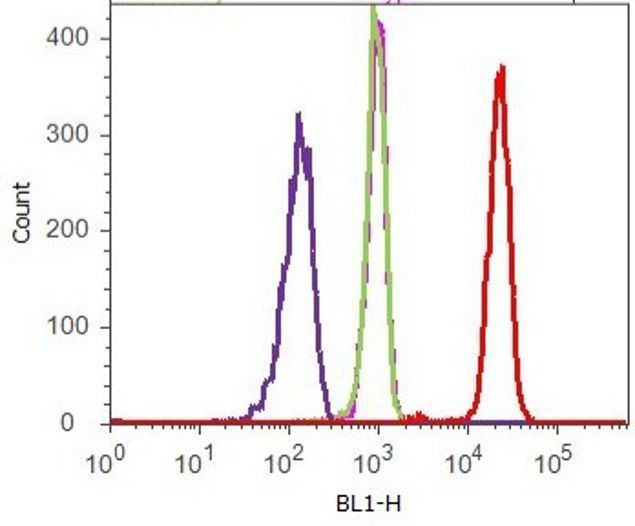
- Flow cytometry analysis of p120 Catenin (N-Term) was done on HEK-293 cells. Cells were fixed with 70% ethanol for 10 minutes, permeabilized with 0.25% Tritonª X-100 for 20 minutes, and blocked with 5% BSA for 1 hour at room temperature. Cells were labeled with p120 Catenin (N-Term) Mouse Monoclonal Antibody (339700, red histogram) or with mouse isotype control (pink histogram) at 1-3 µg/million cells in 2.5% BSA. After incubation at room temperature for 2-3 hours, the cells were labeled with Alexa Fluor¨ 488 Rabbit Anti-Mouse Secondary Antibody (A11059) at a dilution of 1:400 for 30 minutes at room temperature. The representative 10,000 cells were acquired and analyzed for each sample using an Attune¨ Acoustic Focusing Cytometer. The purple histogram represents unstained control cells and the green histogram represents no-primary-antibody control.
Supportive validation
- Submitted by
- Invitrogen Antibodies (provider)
- Main image
- Experimental details
- NULL
- Submitted by
- Invitrogen Antibodies (provider)
- Main image
- Experimental details
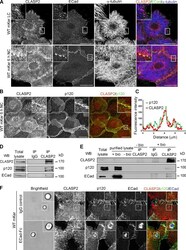
- Figure 1. CLASP2 and p120 interact at AJs. (A) WT primary mKer were grown in low confluency to allow the formation of colonies. Cells were immunostained for CLASP2, ECad, and alpha-tubulin in the presence or absence of calcium (NC, normal calcium; LC, low calcium). (B) WT primary mKer immunostained for CLASP2 and p120 in the presence of calcium to induce formation of AJs. (C) Plot profile of CLASP2 and p120 fluorescence intensity at AJs in the area indicated in B. (D) CLASP2 was immunoprecipitated from mKer treated with calcium, and the immunoprecipitates (IP) were analyzed for CLASP2, ECad, and p120 by immunoblotting. Rabbit IgGs were used as a control. (E) Cell surface proteins from mKer treated with calcium were labeled with biotin (bio) and purified with a streptavidin column. CLASP2 was immunoprecipitated from the purified lysate of surface proteins, and CLASP2, p120, and ECad were analyzed by immunoblotting. Rabbit IgGs were used as a control of the immunoprecipitation, and a lysate of cells without biotin was used as a control of the purification. (F) WT mKer incubated with ECad-Fc-coated microspheres for 5 h in the presence of calcium. IgG-coated microspheres were used as a control. Cells were immunostained for CLASP2, p120, and ECad. Insets are magnifications of the boxed regions. WB, Western blot. Bars: (A and B, main images) 25 um; (F) 10 um; (A, B, and F, insets) 5 um.

- Submitted by
- Invitrogen Antibodies (provider)
- Main image
- Experimental details
- Figure 4. CLASP2 is present at AJs either associated to MTs or in an MT-independent manner. (A) WT mKer were treated with calcium for 1 h and immunostained for CLASP2, ECad, and alpha-tubulin. The right image is a higher magnification of the selected region. (B) WT mKer were treated with calcium for 4 h followed by treatment with 5 uM nocodazole (noc) for 30 min and extraction of monomeric tubulin with saponin. Cells were immunostained for ECad, CLASP2, and alpha-tubulin. The right image is a higher magnification of the selected region. (C) WT primary mKer were treated with calcium (NC) for 10 h as a control followed by treatment with nocodazole + calcium for 2, 4, or 8 h. Cells were immunostained for ECad, CLASP2, and alpha-tubulin. (D) Random individual plot profiles at cell-cell adhesion sites ( n = 10 per cell/40-50 cells) were obtained for the different time points of nocodazole treatment. The maximum fluorescence intensity of ECad and CLASP2 for each profile was quantified and normalized to the control not treated with nocodazole. Data are represented as means +- SEM. ***, P < 0.0001, Mann-Whitney U for ECad; ***, P < 0.001, Student's t test for CLASP2. (E) CLASP2 was immunoprecipitated from mKer treated with calcium for 10 h followed by treatment with nocodazole + calcium for 4 h. The immunoprecipitates (IP) were analyzed for CLASP2, p120, and ECad by immunoblotting. WB, Western blot. Bars: (A, main image) 7.5 um; (A, inset) 2 um; (B, main image, and C) 25 um; (B,

- Submitted by
- Invitrogen Antibodies (provider)
- Main image
- Experimental details
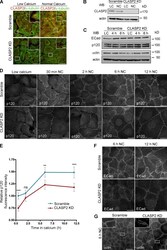
- Figure 5. CLASP2 is required for the proper formation of AJs. (A) WT mKer were infected with lentiviruses expressing either CLASP2 shRNA (CLASP2 knockdown [KD]) or scramble shRNA (scramble). The levels of CLASP2 were analyzed by immunofluorescence after selection with G418. (B) Western blot (WB) showing the levels of CLASP2 after infection with the corresponding lentiviruses. (C) Western blot showing the total levels of ECad, p120, and alpha-catenin (alphactn) in scramble and CLASP2 knockdown mKer at different time points of a calcium-switch time course experiment. (D) Scramble and CLASP2-deficient mKer were subjected to calcium switch for 30 min, 2 h, 6 h, and 12 h and immunostained for p120. (E) Quantification of p120 levels at the membrane in scramble and CLASP2-deficient mKer. Random individual plot profiles were generated at sites of cell-cell adhesion (10 per cell, 25-35 cells), and the maximum fluorescence intensity was quantified. Data are normalized to scramble control values after 30 min of calcium treatment and represented as means +- SEM; **, P < 0.003; ***, P < 0.0001, Mann-Whitney U test. (F) Scramble and CLASP2-deficient mKer treated with calcium for either 6 or 12 h and immunostained for ECad. (G) Scramble and CLASP2-deficient mKer immunostained for alpha-catenin after 6-h calcium switch. Insets are magnifications of the boxed regions. Bars: (A, main images, D, and F) 25 um; (G, main images) 50 um; (A and G, insets) 5 um.
- Submitted by
- Invitrogen Antibodies (provider)
- Main image
- Experimental details
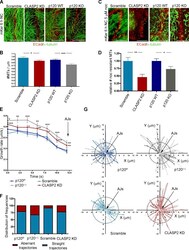
- Figure 7. CLASP2 and p120 are required to maintain the proper dynamics of MTs at cell-cell contacts. (A) CLASP2-deficient and p120- mKer with their corresponding scramble and p120 f/f controls stained for ECad and alpha-tubulin. (B) Quantification of the number of MTs that reach an area of cell-cell contact. Only regions with well-formed AJs were selected for the analysis. ( n = 60 cells, 2 independent experiments). Data are represented as means +- SEM; *, P < 0.04; ***, P < 0.0005, Student's t test. (C) CLASP2-deficient and p120- mKer with their corresponding controls (scramble and p120 f/f ) were grown with calcium for 4 h followed by addition of 5 uM nocodazole (noc) for 30 min and extraction of monomeric tubulin. Cells were stained for ECad and alpha-tubulin. (D) Quantification of the number of resistant MTs present at AJs after nocodazole treatment corresponding to C. Only regions with well-formed AJs were selected for the analysis ( n = 30 cells, 2 independent experiments). Data are normalized to control values and represented as means +- SEM; *, P < 0.05; **, P < 0.002, Student's t test. (E) EB3-GFP was expressed in scramble control cells, CLASP2-deficient cells (CLASP2 knockdown [KD]), p120 control cells (p120 f/f ), and p120- cells (p120 Delta/Delta ). Time-lapse images were taken every 2 s. Individual EB3-GFP comets were manually tracked during the last 12 s before reaching an area of cell-cell contact. The speed in each frame is shown. ( n = 1
- Submitted by
- Invitrogen Antibodies (provider)
- Main image
- Experimental details
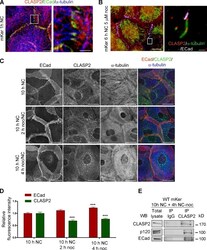
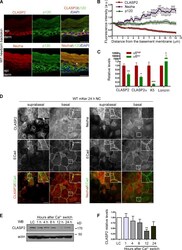
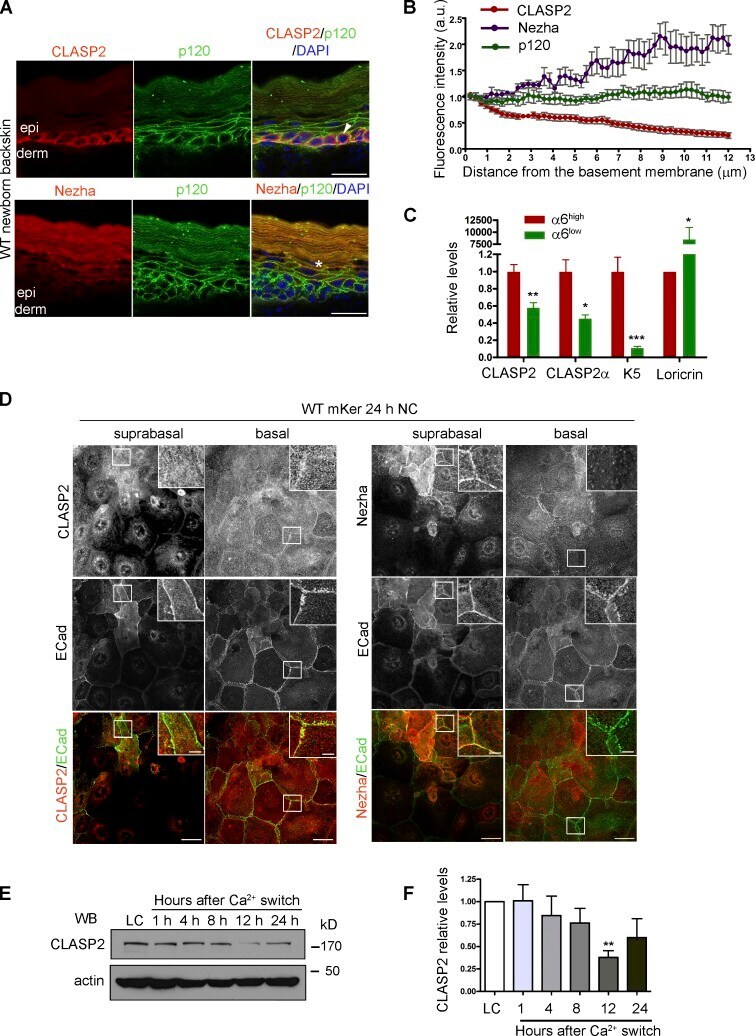
- Figure 8. Differential distribution of CLASP2 and Nezha in the epidermis. (A) Back skins from WT newborn mice stained for CLASP2/p120 or Nezha/p120. The arrow denotes the basal distribution of CLASP2, and the asterisk indicates suprabasal Nezha localization. epi, epidermis; derm, dermis. (B) Quantification of CLASP2, Nezha, and p120 levels in the epidermis of newborn WT mice. Individual plot profiles were generated across the epidermis, and mean values of fluorescence intensity relative to those expressed at the basement membrane are shown. Data are represented as means +- SEM. ( n = 3 mice, 30 plot profiles per mice per staining). a.u., arbitrary unit. (C) Real-time PCR analysis of mKer isolated from the back skin of newborn mice and FACS sorted according to their levels of alpha6 integrin into two populations: alpha6 high (basal mKer) and alpha6 low (suprabasal mKer). CLASP2 levels were analyzed with two different combinations of primers. Keratin 5 (K5) and loricrin were used as markers of basal and suprabasal mKer, respectively. For each primer pair, values were normalized to the transcript levels of the alpha6 high population. Data are represented as means +- SEM; ***, P < 0.0004; **, P < 0.002; *, P < 0.03, Student's t test. (D) WT mKer subjected to a 24-h calcium switch in vitro and immunostained for either CLASP2 or Nezha together with p120 and ECad. Insets are magnifications of the boxed regions. (E) Immunoblot analysis of CLASP2 levels in WT mKer subjected to a
- Submitted by
- Invitrogen Antibodies (provider)
- Main image
- Experimental details
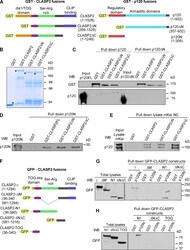
- Figure 2. p120 and CLASP2 interact via the N-terminal domain of p120 and the Ser/Arg-rich region of CLASP2. (A) GST-tagged constructs of p120 and CLASP2 used for the in vitro pull-down assays. (B) SDS-PAGE gel showing the purified GST-CLASP2 recombinant proteins stained with Coomassie blue. Asterisks indicate bands of the expected molecular mass. (C) In vitro binding assay of GST-CLASP2 recombinant proteins with purified p120FL and p120DeltaN (previously cleaved from GST with the PreScission Protease). (D) In vitro binding of GST-CLASP2 recombinant proteins with purified p120N. (E) Pull-down assay using the recombinant GST-CLASP2 proteins as bait for endogenous p120 present in lysates of mKer treated with calcium for 4 h. (E) GFP-tagged constructs of CLASP2. (F) Pull-down assays using GST-p120N recombinant protein and lysates of 293T cells expressing equal amounts of the GFP-tagged CLASP2 constructs of E. Pulled down proteins were immunoblotted for GFP. (H) Pull-down assay using GST-p120N recombinant protein and lysates of 293T cells expressing equal amounts of either GFP-CLASP2-N1 or GFP-CLASP2-DeltaNDeltaC or GFP-CLASP2-TOG. WB, Western blot.

- Submitted by
- Invitrogen Antibodies (provider)
- Main image
- Experimental details
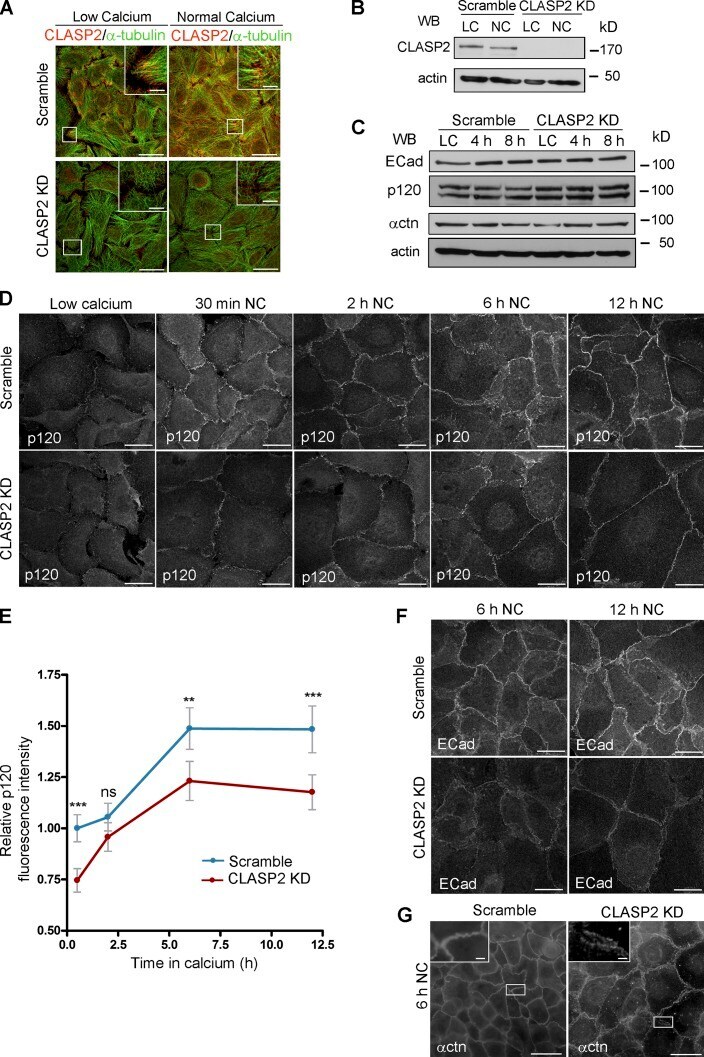
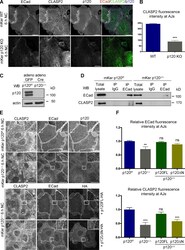
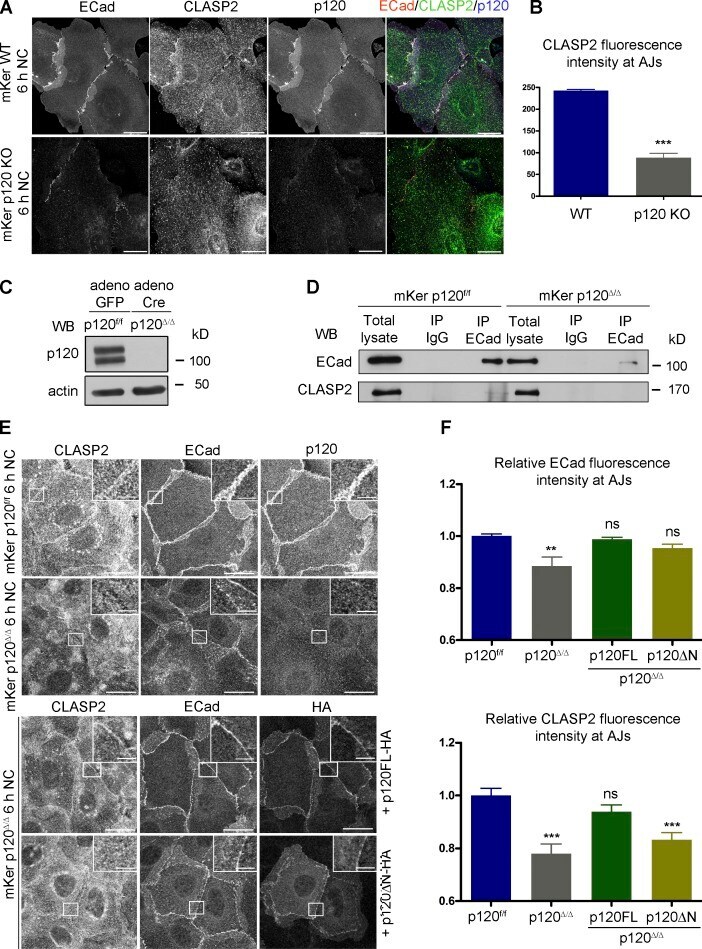
- Figure 3. p120 is required for the recruitment of CLASP2 to AJs. (A) WT and p120 KO primary mKer immunostained for ECad, CLASP2, and p120 in the presence of calcium (NC). (B) Random individual plot profiles ( n = 10 per cell/10 cells) were obtained from WT and p120 KO mKer. The fluorescence intensity level of CLASP2 corresponding to the maximum ECad intensity in each profile was quantified. Data are represented as means +- SEM; ***, P < 0.0001, Mann-Whitney U test. (C) Western blot (WB) showing the levels of p120 in primary mKer infected either with adeno-GFP (p120 f/f ) as a control or adeno-Cre-GFP (p120 Delta/Delta ). (D) ECad was immunoprecipitated from control p120 f/f or from p120- mKer (p120 Delta/Delta ). The immunoprecipitates (IP) were analyzed for ECad and CLASP2 by immunoblotting. (E) p120 Delta/Delta mKer were transfected with either p120FL-HA or p120DeltaN-HA and switched to a normal calcium media (NC) for 6 h. p120 f/f and p120 Delta/Delta mKer nontransfected were used as controls. Cells were immunostained for CLASP2, ECad, and HA. Insets are magnifications of the boxed regions. (F) Quantification of ECad and CLASP2 fluorescence intensity at AJs. Random individual plot profiles were generated at sites of cell-cell adhesion. The maximum value of ECad fluorescence intensity in the profile and its associated CLASP2 fluorescence intensity were quantified. Data were normalized to control values (p120 f/f mKer) and represented as means +- SEM. **, P < 0.002, Mann
- Submitted by
- Invitrogen Antibodies (provider)
- Main image
- Experimental details
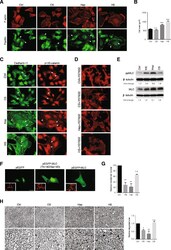
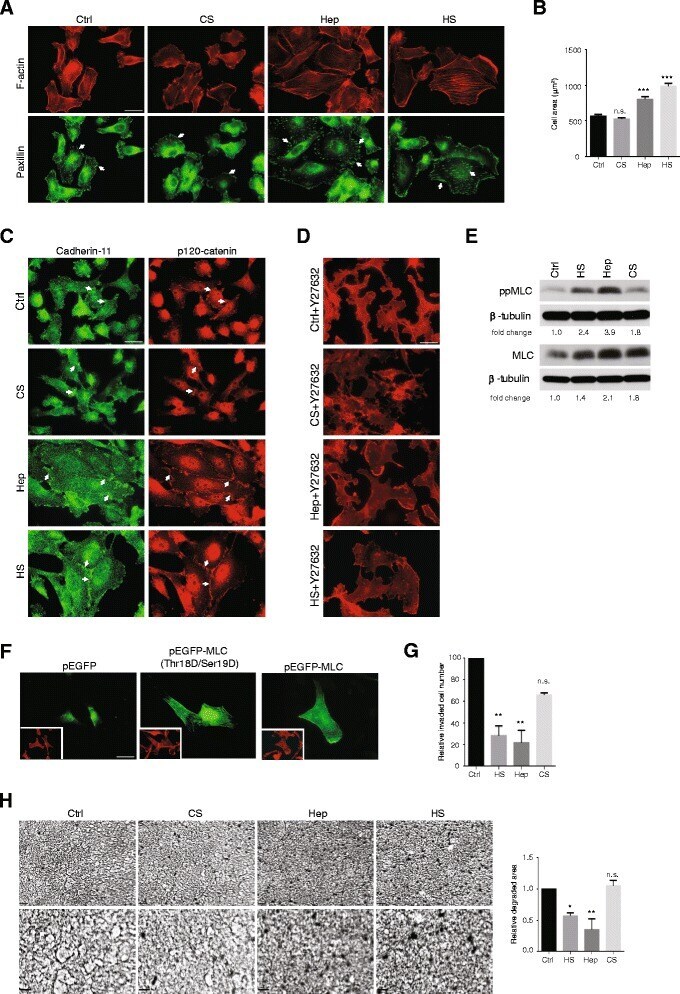
- Figure 1 Heparinoids promote adhesion and reduced invasive activity. MDA-MB231 cultures were treated with 20 mug/ml heparan sulfate (HS), chondroitin sulfate (CS), heparin (Hep) or untreated (Ctrl) for 24 h after which cells were fixed and assessed for (A) F-actin (red) to detect microfilament bundles and paxillin (green) to detect focal adhesions (arrows), (B) spread cell areas (n >= 50 per condition), (C) adherens junction (arrows) components cadherin-11 (green) and p120-catenin (red). (D) Sensitivity of microfilament organisation to 30 muM of Rho kinase inhibitor, Y-27632 added for 30 min before fixation and staining for F-actin, Bars = 25 mum in A, C, D. (E) Representative western blot of diphosphorylated (Thr18/Ser19) myosin light chain (ppMLC) and total MLC from cells treated with glycosaminoglycans or untreated. Quantitation for ppMLC and total MLC levels relative to beta-tubulin is shown under the blots. Similar results were obtained in three independent experiments. (F) F-actin organization in cells transfected with cDNAs encoding wild type MLC (pEGFP-MLC), phosphomimetic MLC (pEGFP-MLC Thr18Asp/Ser19Asp) or control vector (pEGFP). Phalloidin-stained cultures of the same areas are shown in the inserts. Bar, 25 mum. (G) Cells were plated onto type I collagen gel coated transwells in the presence or absence of glycosaminoglycans. After 24 h, invading cells were fixed, stained with DAPI and counted. (H) Cells were cultured on native type I collagen coated plates in the
- Submitted by
- Invitrogen Antibodies (provider)
- Main image
- Experimental details
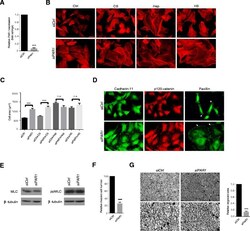
- Figure 2 Effects of heparinoids partly results from inhibition of thrombin. MDA-MB231 cells were transfected with PAR-1 or control siRNA. (A) After 48 h, RNAs were extracted and subjected to qRT-PCR analysis to ascertain PAR-1 mRNA expression levels. siCtrl - control siRNA treatment. (B) PAR-1 depleted and control cells were incubated with glycosaminoglycans for 24 h, fixed and stained for F-actin. (C) Cell spreading induced by PAR-1 depletion and addition of glycosaminoglycans to PAR-1 depleted cells was quantified, n >= 50 cells per condition. (D) PAR-1 depleted and control cells were stained for paxillin, cadherin-11 and p120-catenin. Small focal adhesions are arrowed. (E) . Levels of phosphomyosin light chain (ppMLC) are unchanged by PAR-1 depeletion by siRNA. Total myosin light chain (MLC) and beta-tubulin are shown. (F) Quantification of PAR-1 and control siRNA treated cells that invaded type I collagen gels after 24 h. (G) Images and quantification of type I collagen degradation by control and PAR-1 depleted cells. Images at higher magnification are shown in the lower panels. Bars = 25 mum in B and D. Bar = 100 mum in G. Error bars = s.e.m. from three independent experiments. **p < 0.01, ***p < 0.001, n.s.: not significant. Significance was tested by one-way ANOVA with Tukey's post-hoc test (C) or two-tailed paired t-test (A, F and G) .

- Submitted by
- Invitrogen Antibodies (provider)
- Main image

- Experimental details
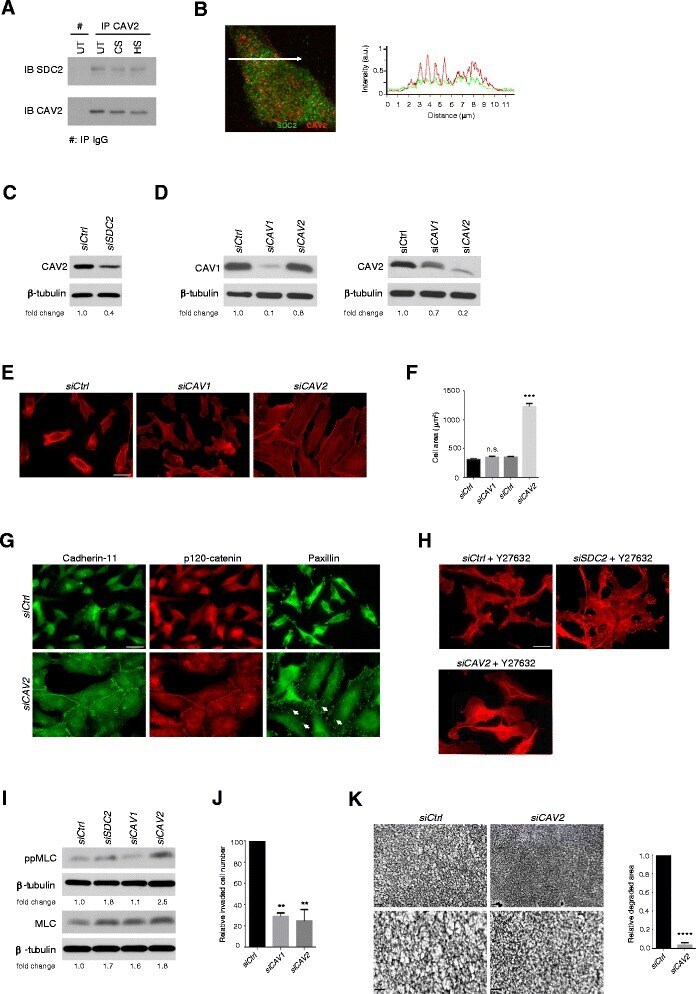
- Figure 6 Caveolin-2 interacts with syndecan-2 and regulates cell adhesion in MDA-MB231 cells. (A) Syndecan-2, but not syndecan-4, was co-immunoprecipitated with caveolin-2 from cell lysates. Co-immunoprecipitation was not affected by ectopic glycosaminoglycan treatment of the cells (UT; untreated, CS; chondroitin sulfate, HS; heparan sulfate). (B) Confocal laser scanning microscopy and profile of the line scanning (white arrow on image) confirmed partial co-localization of syndecan-2 (green) and caveolin-2 (red). (C) Caveolin-2 levels were reduced where syndecan-2 was depleted by siRNA, compared with control siRNA. (D) Western blotting verified the knockdown efficiency of siRNA targeting caveolin-1 and -2 compared to control siRNA. Downregulation of caveolin-1 reduced the expression of caveolin-2 by around 30%, but knockdown of caveolin-2 had no impact on caveolin-1 levels. (E) F-actin containing microfilament bundles were abundant after caveolin-2, but not caveolin-1 depletion. Bar = 25 mum. (F) Spread cell areas were measured in caveolin-2 depleted cells and control cells, n >= 50 per condition. (G) Adherens junctions and focal adhesions (arrows) were characteristic of caveolin-2 depleted cells, shown by cadherin-11 and p120-catenin, or paxillin distributions. Bar = 25 mum. (H) Microfilament bundles formed in response to either syndecan-2 or caveolin-2 knockdown were sensitive to 30 muM Rho kinase inhibitor, Y-27632. Bar = 25 mum. (I) Diphosphorylated myosin light chain (pp