Explore
 Validate
 Learn
LearnPA1-38737
antibody from Invitrogen Antibodies
Targeting: TGFBR1
ACVRLK4, ALK-5, ALK5, ESS1, MSSE, TBR-i, TBRI
 Western blot
Antibody data
- Antibody Data
- Antigen structure
- References [6]
- Comments [0]
- Validations
- Western blot [3]
- Immunocytochemistry [1]
- Immunohistochemistry [1]
- Other assay [2]
Submit
Validation data
Reference
Comment
Report error
- Product number
- PA1-38737 - Provider product page

- Provider
- Invitrogen Antibodies
- Product name
- TGFBR1 Polyclonal Antibody
- Antibody type
- Polyclonal
- Antigen
- Synthetic peptide
- Reactivity
- Human, Mouse, Rat, Bovine
- Host
- Rabbit
- Isotype
- IgG
- Vial size
- 1 mL
- Concentration
- 1.0 mg/mL
- Storage
- -20° C, Avoid Freeze/Thaw Cycles
Submitted references Proteomic Characterization, Biodistribution, and Functional Studies of Immune-Therapeutic Exosomes: Implications for Inflammatory Lung Diseases.
TAGLN and High-mobility Group AT-Hook 2 (HMGA2) Complex Regulates TGF-β-induced Colorectal Cancer Metastasis.
Complex fibroblast response to glucocorticoids may underlie variability of clinical efficacy in the vocal folds.
The neovascularization effect of dedifferentiated fat cells.
Human osteoarthritis cartilage-derived stromal cells activate joint degeneration through TGF-beta lateral signaling.
Fibroblast-enriched endoplasmic reticulum protein TXNDC5 promotes pulmonary fibrosis by augmenting TGFβ signaling through TGFBR1 stabilization.
Elashiry M, Elsayed R, Elashiry MM, Rashid MH, Ara R, Arbab AS, Elawady AR, Hamrick M, Liu Y, Zhi W, Lucas R, Vazquez J, Cutler CW
Frontiers in immunology 2021;12:636222
Frontiers in immunology 2021;12:636222
TAGLN and High-mobility Group AT-Hook 2 (HMGA2) Complex Regulates TGF-β-induced Colorectal Cancer Metastasis.
Zhou H, Li L, Xie W, Wu L, Lin Y, He X
OncoTargets and therapy 2020;13:10489-10498
OncoTargets and therapy 2020;13:10489-10498
Complex fibroblast response to glucocorticoids may underlie variability of clinical efficacy in the vocal folds.
Nakamura R, Mukudai S, Bing R, Garabedian MJ, Branski RC
Scientific reports 2020 Nov 24;10(1):20458
Scientific reports 2020 Nov 24;10(1):20458
The neovascularization effect of dedifferentiated fat cells.
Watanabe H, Goto S, Kato R, Komiyama S, Nagaoka Y, Kazama T, Yamamoto C, Li Y, Konuma N, Hagikura K, Matsumoto T
Scientific reports 2020 Jun 8;10(1):9211
Scientific reports 2020 Jun 8;10(1):9211
Human osteoarthritis cartilage-derived stromal cells activate joint degeneration through TGF-beta lateral signaling.
Liu W, Feng M, Jayasuriya CT, Peng H, Zhang L, Guan Y, Froehlich JA, Terek RM, Chen Q
FASEB journal : official publication of the Federation of American Societies for Experimental Biology 2020 Dec;34(12):16552-16566
FASEB journal : official publication of the Federation of American Societies for Experimental Biology 2020 Dec;34(12):16552-16566
Fibroblast-enriched endoplasmic reticulum protein TXNDC5 promotes pulmonary fibrosis by augmenting TGFβ signaling through TGFBR1 stabilization.
Lee TH, Yeh CF, Lee YT, Shih YC, Chen YT, Hung CT, You MY, Wu PC, Shentu TP, Huang RT, Lin YS, Wu YF, Lin SJ, Lu FL, Tsao PN, Lin TH, Lo SC, Tseng YS, Wu WL, Chen CN, Wu CC, Lin SL, Sperling AI, Guzy RD, Fang Y, Yang KC
Nature communications 2020 Aug 26;11(1):4254
Nature communications 2020 Aug 26;11(1):4254
No comments: Submit comment
Supportive validation
- Submitted by
- Invitrogen Antibodies (provider)
- Main image
- Experimental details
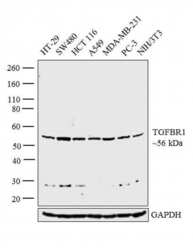
- Western blot analysis was performed on whole cell extracts (30 µg lysate) of HT-29 (Lane 1), SW480 (Lane 2), HCT 116 (Lane 3), A549 (Lane 4), MDA-MB-231 (Lane 5), PC-3 (Lane 6) and NIH/3T3 (Lane 7). The blot was probed with Anti-TGFBR1 Polyclonal Antibody (Product # PA1-38737, 1:500 dilution) and detected by chemiluminescence using Goat anti-Rabbit IgG (H+L) Superclonal™ Secondary Antibody, HRP conjugate (Product # A27036, 0.25 µg/mL, 1:4000 dilution). A 56 kDa band corresponding to TGFBR1 was observed across the cell lines tested.

- Submitted by
- Invitrogen Antibodies (provider)
- Main image

- Experimental details
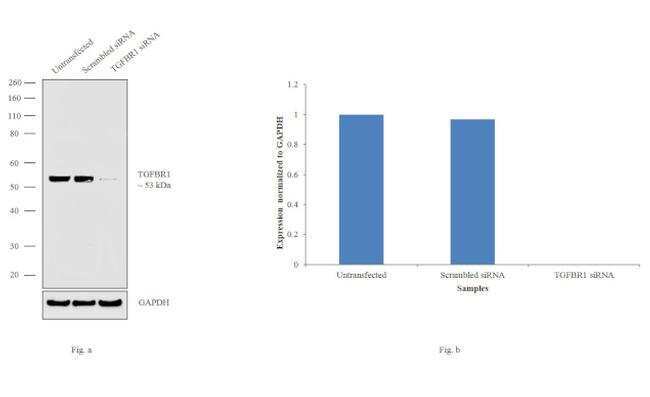
- Knockdown of TGFBR1 was achieved by transfecting HCT116 with TGFBR1 specific siRNAs (Silencer® select Product # s14071). Western blot analysis (Fig. a) was performed using membrane enriched extracts from the HCT116 knockdown cells (lane 3), non-specific scrambled siRNA transfected cells (lane 2) and untransfected cells (lane 1). The blots were probed with TGFBR1 Polyclonal Antibody (Product # PA5-32631, 1:1000 dilution) and Goat anti-Rabbit IgG (H+L) Superclonal™ Secondary Antibody, HRP conjugate (Product # A27036, 0.25µg/mL, 1:4000 dilution). Densitometric analysis of this western blot is shown in histogram (Fig. b). Densitometric analysis of this western blot is shown in histogram (Fig. b). Complete loss of signal upon siRNA mediated knock down confirms that antibody is specific to TGFBR1.
- Submitted by
- Invitrogen Antibodies (provider)
- Main image
- Experimental details
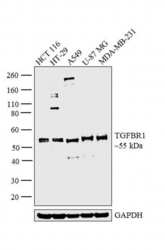
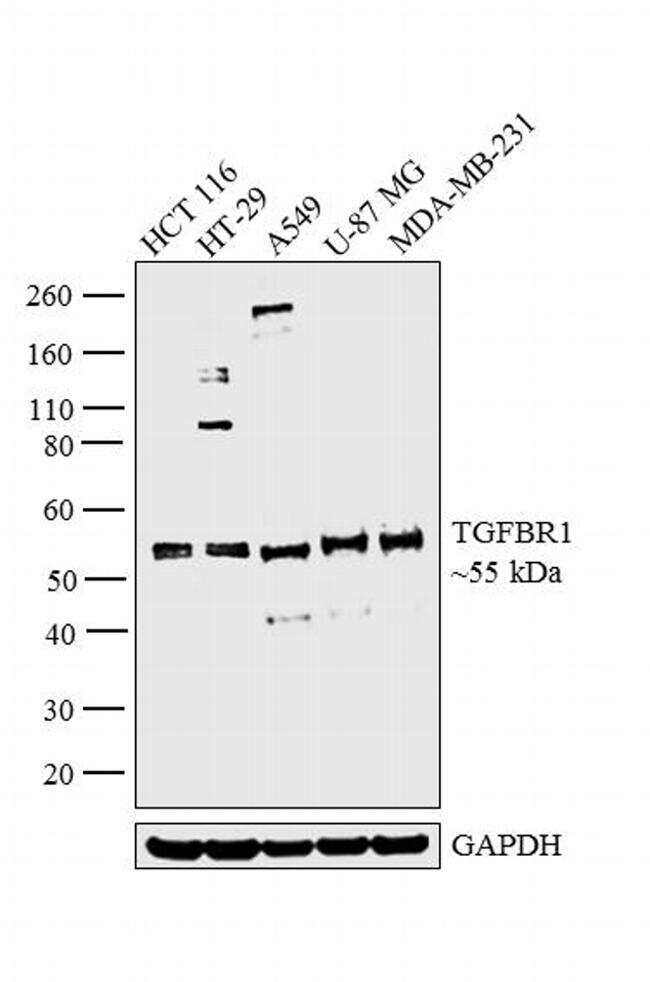
- Western blot analysis was performed on whole cell extracts (30 µg lysate) of HCT 116 (Lane 1), HT-29 (Lane 2), A549 (Lane 3), U-87 MG (Lane 4) and MDA-MB-231 (Lane 5). The blot was probed with Anti-TGFBR1 Polyclonal Antibody (Product # PA5-32631, 1:1000 dilution) and detected by chemiluminescence using Goat anti-Rabbit IgG (H+L) Superclonal™ Secondary Antibody, HRP conjugate (Product # A27036, 0.25 µg/mL, 1:4000 dilution). A 55 kDa band corresponding to TGFBR1 was observed across the cell lines tested.
Supportive validation
- Submitted by
- Invitrogen Antibodies (provider)
- Main image
- Experimental details
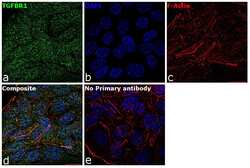
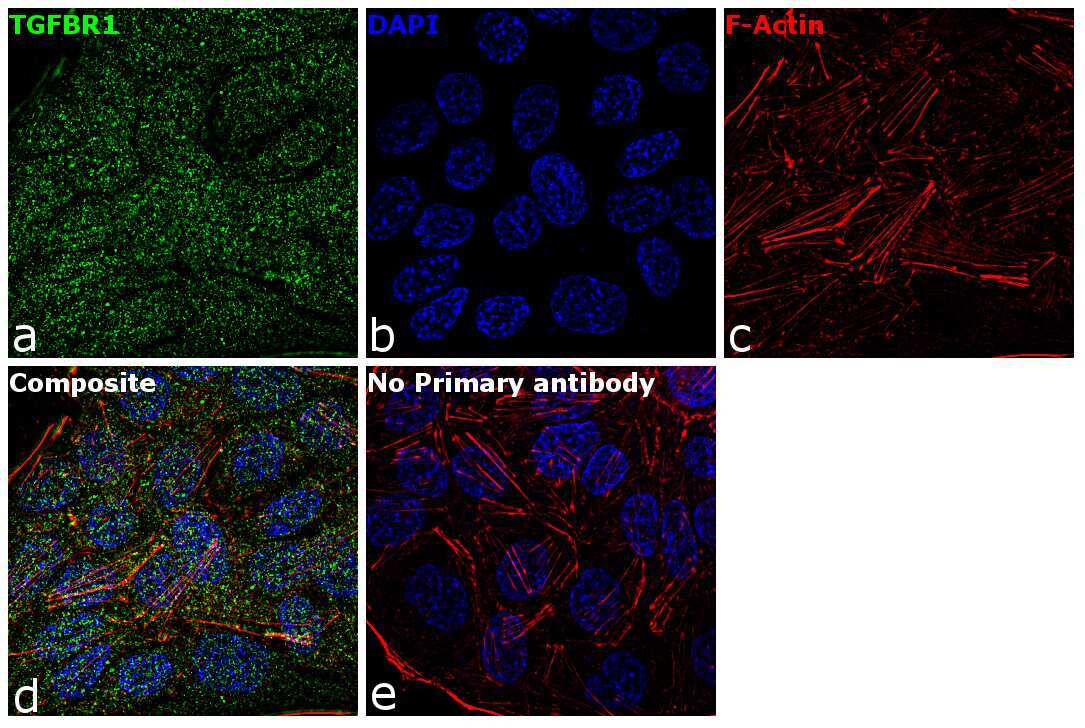
- Immunofluorescence analysis of TGFBR1 was performed using 70% confluent log phase HT-29 cells. The cells were fixed with 4% paraformaldehyde for 10 minutes, permeabilized with 0.1% Triton™ X-100 for 15 minutes, and blocked with 1% BSA for 1 hour at room temperature. The cells were labeled with TGFBR1 Rabbit Polyclonal Antibody(Product # PA5-32631) at 1:100 dilution in 0.1% BSA, incubated at 4 degree Celsius overnight and then labeled with Goat anti-Rabbit IgG (H+L) Superclonal™ Secondary Antibody, Alexa Fluor® 488 conjugate (Product # A27034) at a dilution of 1:2000 for 45 minutes at room temperature (Panel a: green). Nuclei (Panel b: blue) were stained with SlowFade® Gold Antifade Mountant with DAPI (Product # S36938). F-actin (Panel c: red) was stained with Rhodamine Phalloidin (Product # R415, 1:300). Panel d represents the merged image showing membrane localization. Panel e represents control cells with no primary antibody to assess background. The images were captured at 60X magnification.
Supportive validation
- Submitted by
- Invitrogen Antibodies (provider)
- Main image
- Experimental details
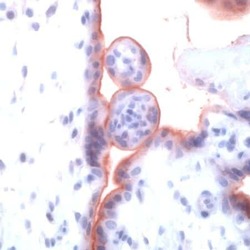
- Immunohistochemical analysis of Transforming Growth Factor R1 using anti-Transforming Growth Factor R1 Polyclonal Antibody (Product # PA5-32631) in Placenta Tissue. The recommened dilution for this antibody in immunohistochemistry applications is 1:50.

Supportive validation
- Submitted by
- Invitrogen Antibodies (provider)
- Main image
- Experimental details
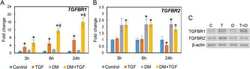
- Figure 5 Expression levels of TGF-beta receptors in vocal fold fibroblasts after treatment with TGF-beta and dexamethasone. HVOX cells were treated with TGF-beta1 (TGF-beta; 10 ng/mL), dexamethasone (DM; 10 -7 M), and RU486 (RU; 10 -6 M) for 3, 6, and 24 h. TGFBR1 and TGFBR2 mRNA expression was examined by qPCR ( A , B ). Relative expression levels of each gene to GAPDH were compared with those of the control group, and are shown as mean +- SEM (n = 3). * P < 0.05 vs. control. |= P < 0.05 vs. TGF-beta. TGFBR1 and TGFBR2 protein expression in the cells treated for 24 h were examined by Western blotting ( C ).

- Submitted by
- Invitrogen Antibodies (provider)
- Main image
- Experimental details
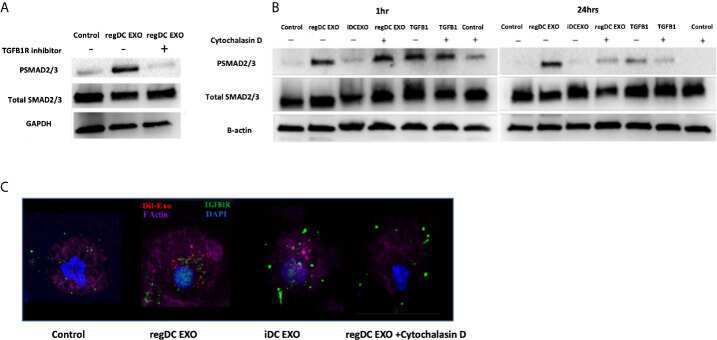
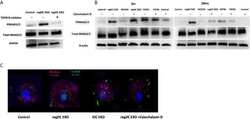
- Figure 10 Early and sustained pSMAD2/3 signaling by uptake of regDC EXO with TGFbetaRI: (A) Immunoblot of Psmad2/3 and total smad2/3 in recipient DCs co-cultured for 24 h with reg DCS EXO +/- TGFbeta1R inhibitor SB431542. Loading control was GAPDH (B) Immunoblot of Psmad2/3 and total smad2/3 in recipient DCs co-cultured for 1 and 24 h with reg DC EXO or iDC EXO +/- cytochalasin D. Loading control was B-actin. (C) Uptake of Dil labeled EXO (red) by recipient DCs, DAPI (blue), Alexa Fluor 680 phalloidin (violet) for FActin, Alexa flour 488 (green)-mouse anti-TGFbetaR1, visualized under confocal microscopy. Dil-DCs EXO or no EXO were added to recipient DCs at a 10:1 EXO : DC ratio (24 h shown). Results shown are representative of three independent experiments.