Explore
 Validate
 Learn
Learn Western blot
 Immunocytochemistry
Antibody data
- Antibody Data
- Antigen structure
- References [28]
- Comments [0]
- Validations
- Immunocytochemistry [7]
- Immunohistochemistry [2]
- Other assay [32]
Submit
Validation data
Reference
Comment
Report error
- Product number
- PA1-046 - Provider product page

- Provider
- Invitrogen Antibodies
- Product name
- SynGAP Polyclonal Antibody
- Antibody type
- Polyclonal
- Antigen
- Recombinant protein fragment
- Description
- PA1-046 detects synaptic Ras-GTPase activating protein (SynGAP) from mouse and rat tissues. The PA1-046 has been successfully used in Western blot and immunocytochemistry procedures. By Western blot, this antibody detects an ~135 kDa protein representing SynGAP from mouse brain tissue homogenate. Immunocytochemical staining of SynGAP in rat hippocampal neurons with PA1-046 yields a pattern consistent with vesicular staining. PA1-046 immunogen is residues 947-1167 of rat SynGAP.
- Reactivity
- Human, Mouse, Rat
- Host
- Rabbit
- Isotype
- IgG
- Vial size
- 100 μg
- Concentration
- 1 mg/mL
- Storage
- -20°C, Avoid Freeze/Thaw Cycles
Submitted references Early postnatal serotonin modulation prevents adult-stage deficits in Arid1b-deficient mice through synaptic transcriptional reprogramming.
Cyfip1 Regulates SynGAP1 at Hippocampal Synapses.
SynGAP splice variants display heterogeneous spatio-temporal expression and subcellular distribution in the developing mammalian brain.
A sex difference in the response of the rodent postsynaptic density to synGAP haploinsufficiency.
Dynamic- and Frequency-Specific Regulation of Sleep Oscillations by Cortical Potassium Channels.
Tumor Suppression of Ras GTPase-Activating Protein RASA5 through Antagonizing Ras Signaling Perturbation in Carcinomas.
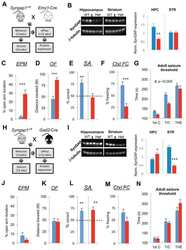
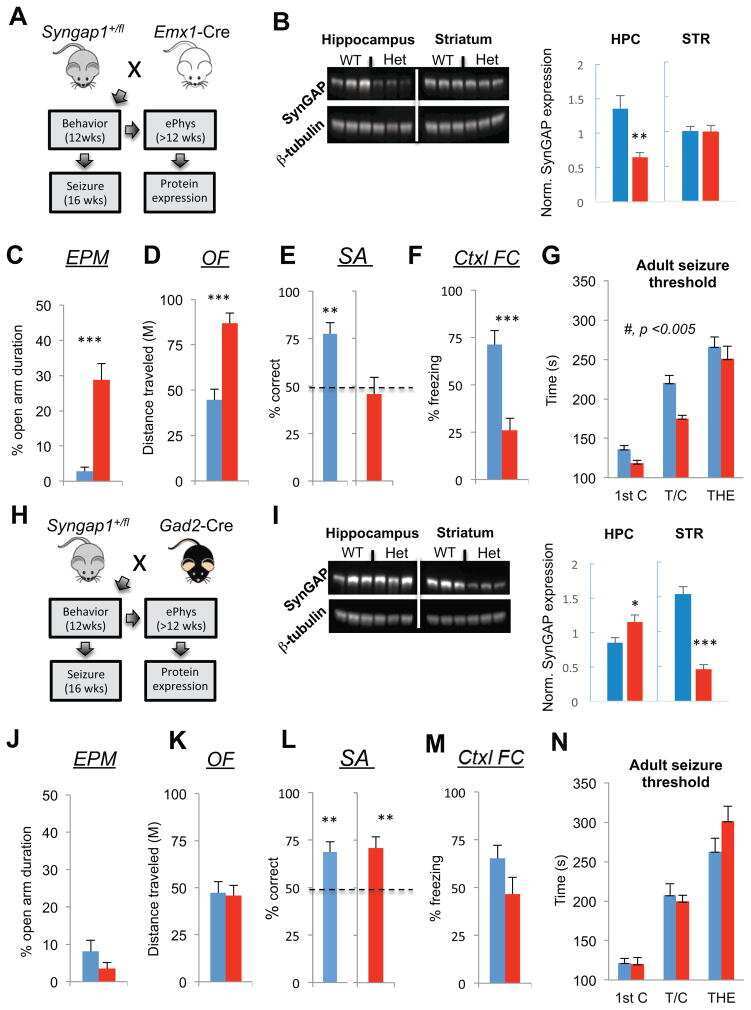
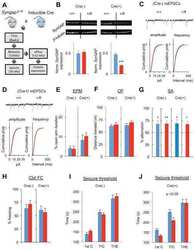
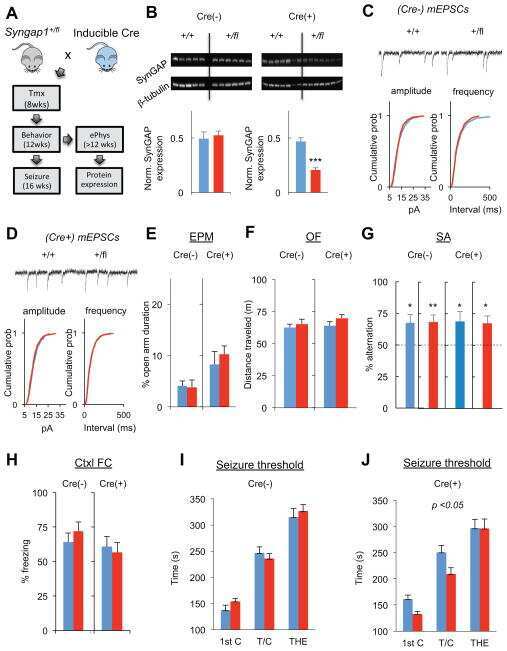
Re-expression of SynGAP protein in adulthood improves translatable measures of brain function and behavior.
A model for regulation by SynGAP-α1 of binding of synaptic proteins to PDZ-domain 'Slots' in the postsynaptic density.
The calcium sensor Copine-6 regulates spine structural plasticity and learning and memory.
Syngap1 haploinsufficiency damages a postnatal critical period of pyramidal cell structural maturation linked to cortical circuit assembly.
GluN2B-Containing NMDA Receptors Regulate AMPA Receptor Traffic through Anchoring of the Synaptic Proteasome.
Cadherin-8 expression, synaptic localization, and molecular control of neuronal form in prefrontal corticostriatal circuits.
Phosphorylation of synaptic GTPase-activating protein (synGAP) by Ca2+/calmodulin-dependent protein kinase II (CaMKII) and cyclin-dependent kinase 5 (CDK5) alters the ratio of its GAP activity toward Ras and Rap GTPases.
Reduced cognition in Syngap1 mutants is caused by isolated damage within developing forebrain excitatory neurons.
Impaired synaptic clustering of postsynaptic density proteins and altered signal transmission in hippocampal neurons, and disrupted learning behavior in PDZ1 and PDZ2 ligand binding-deficient PSD-95 knockin mice.
Deletion of densin-180 results in abnormal behaviors associated with mental illness and reduces mGluR5 and DISC1 in the postsynaptic density fraction.
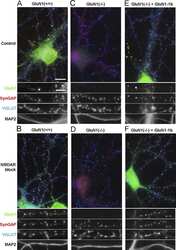
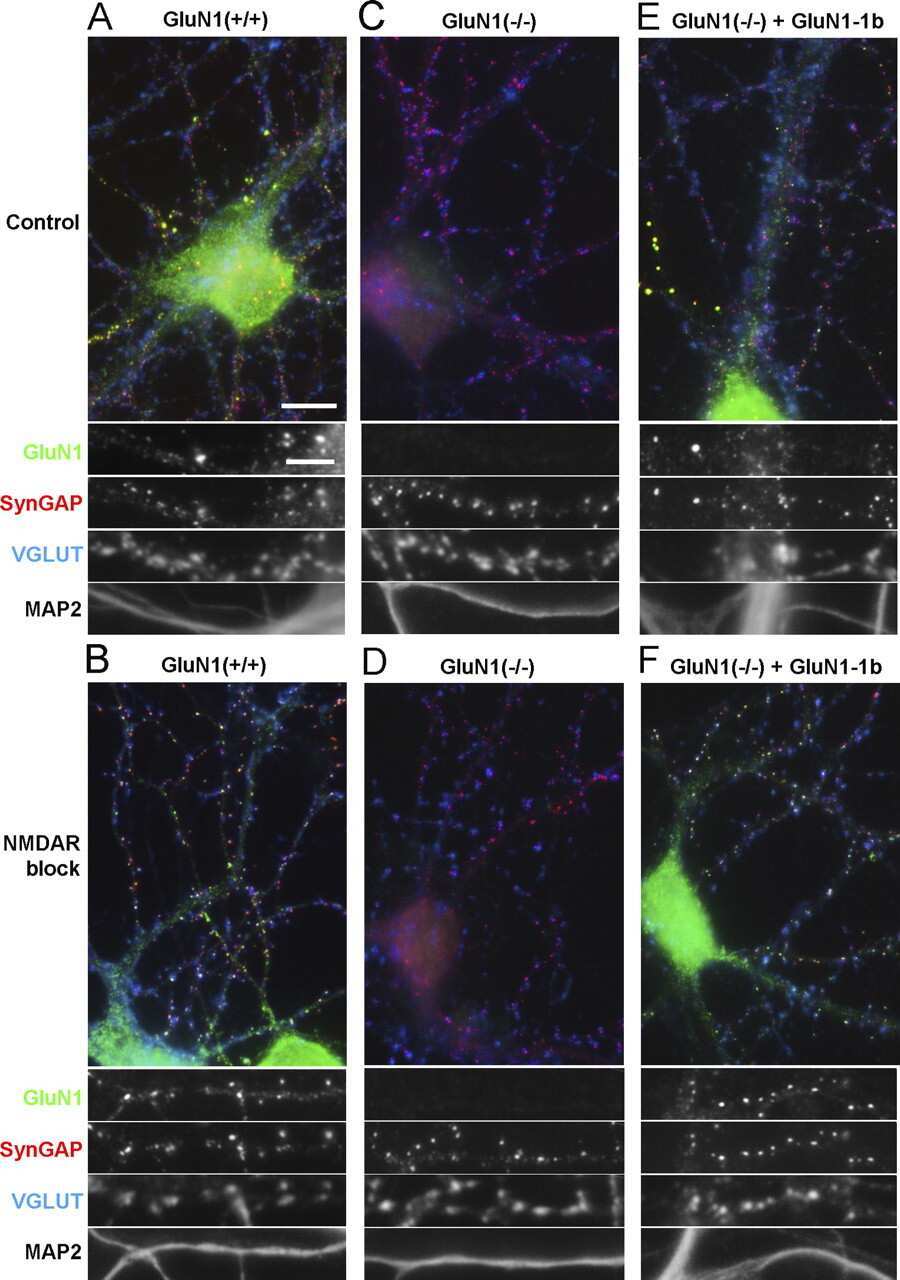
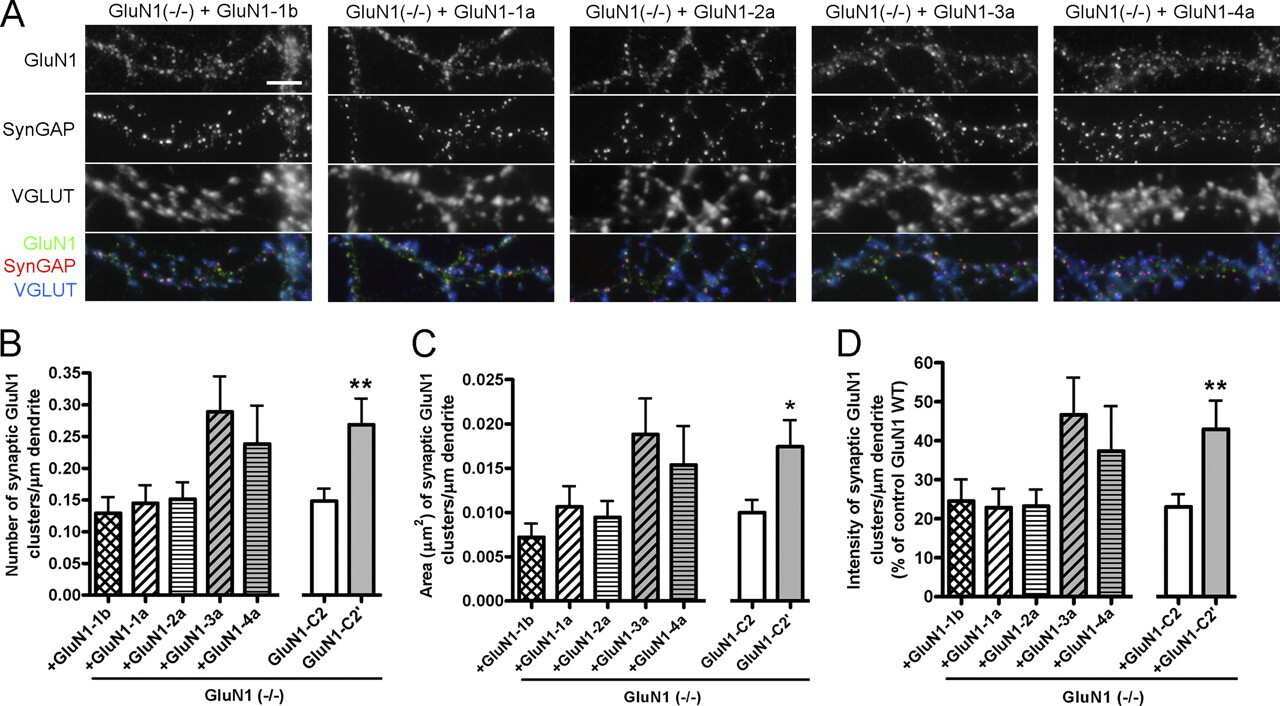
Activity and protein kinase C regulate synaptic accumulation of N-methyl-D-aspartate (NMDA) receptors independently of GluN1 splice variant.
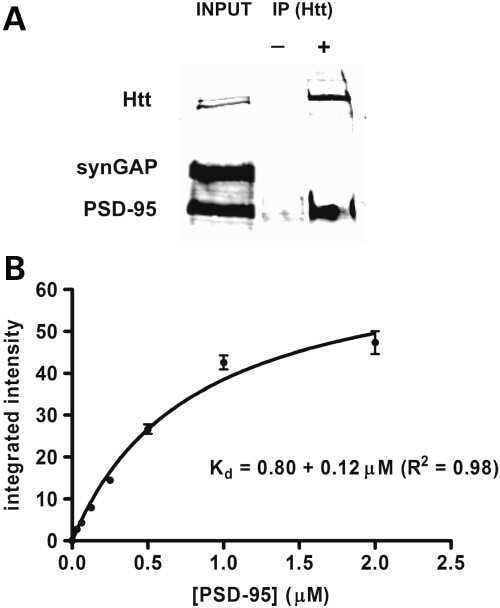
The Huntington's disease mutation impairs Huntingtin's role in the transport of NF-κB from the synapse to the nucleus.
Trans-synaptic EphB2-ephrin-B3 interaction regulates excitatory synapse density by inhibition of postsynaptic MAPK signaling.
In vivo composition of NMDA receptor signaling complexes differs between membrane subdomains and is modulated by PSD-95 and PSD-93.
Age-related accumulation of Reelin in amyloid-like deposits.
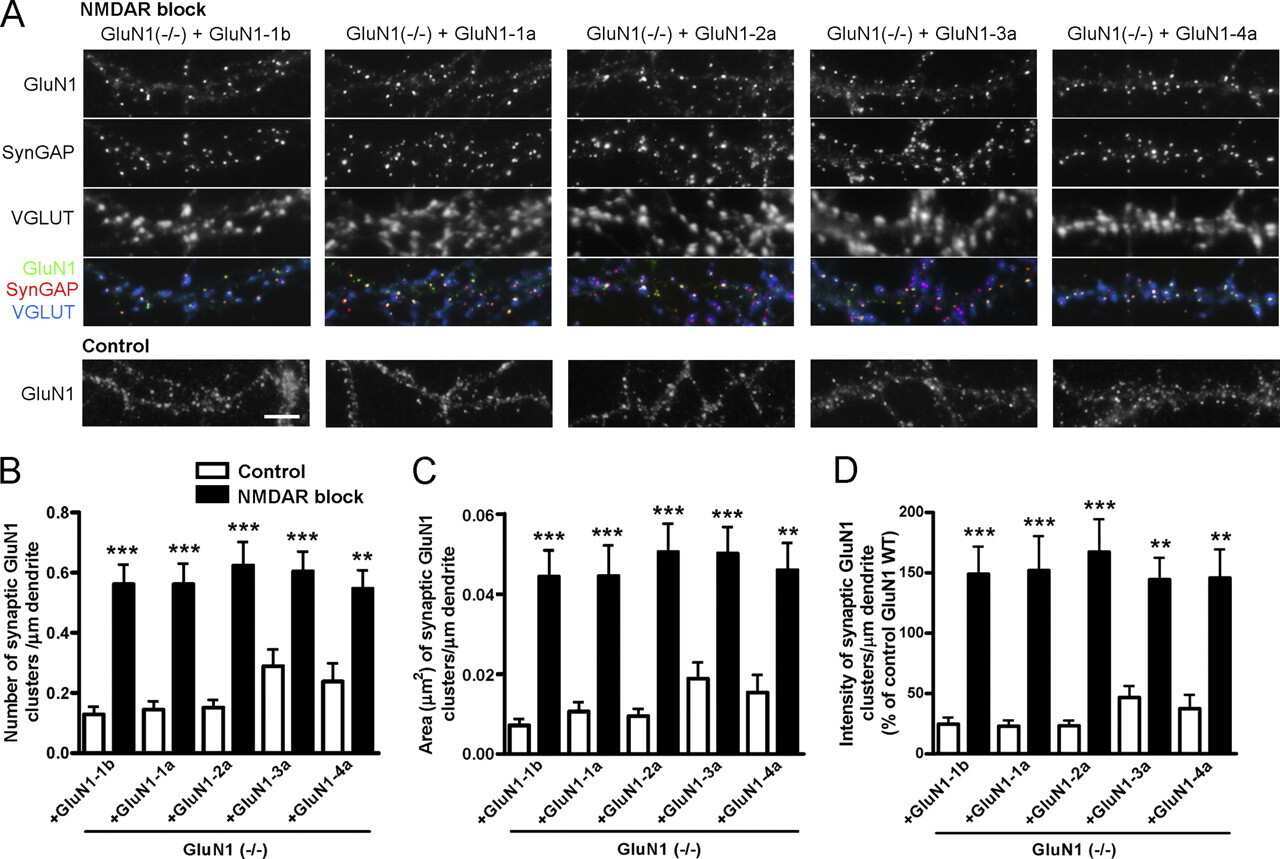
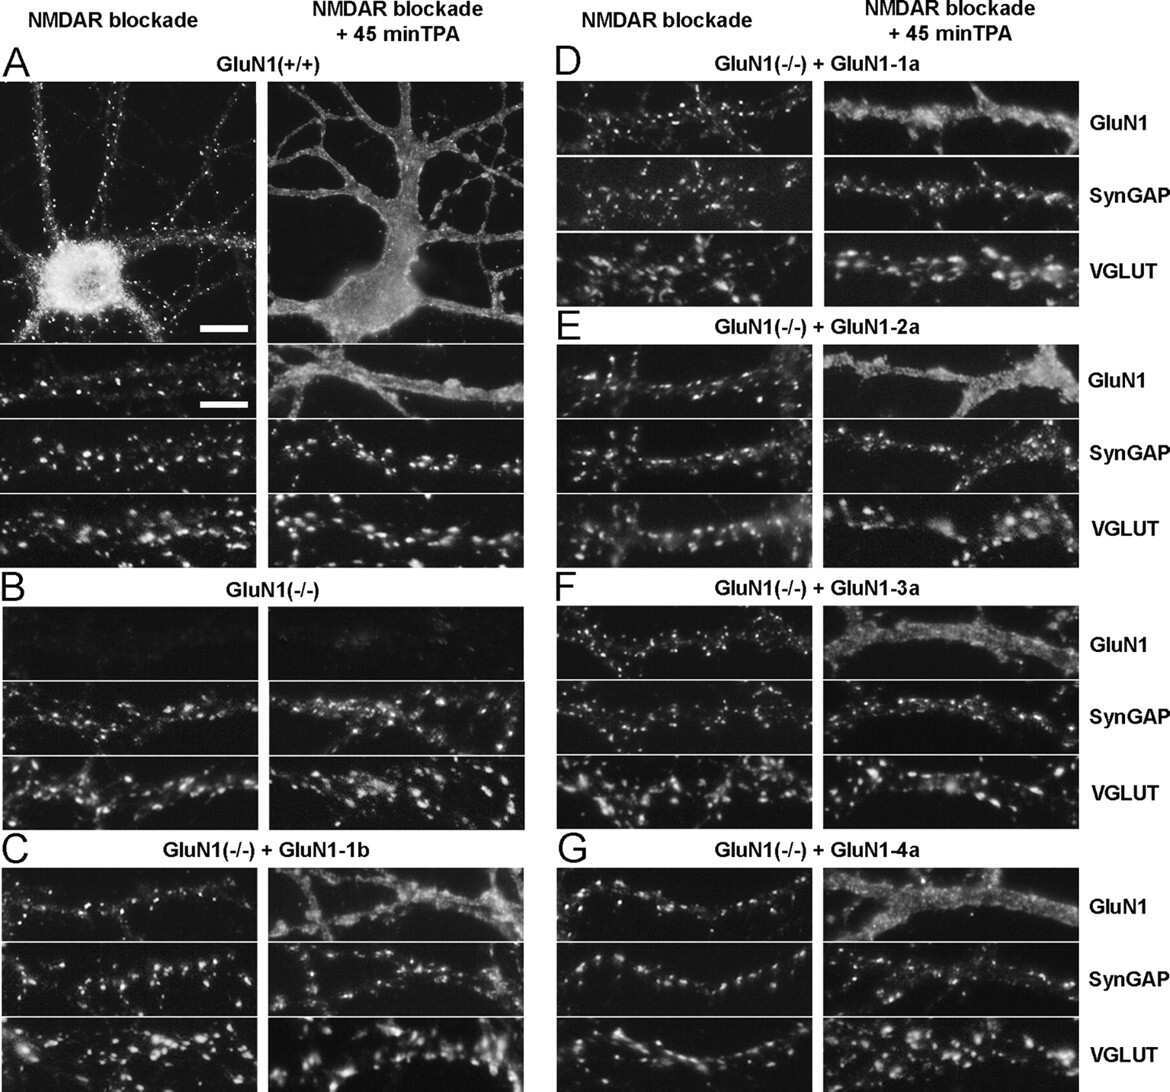
Synapse composition and organization following chronic activity blockade in cultured hippocampal neurons.
Gephyrin is critical for glycine receptor clustering but not for the formation of functional GABAergic synapses in hippocampal neurons.
Regulation of the neuron-specific Ras GTPase-activating protein, synGAP, by Ca2+/calmodulin-dependent protein kinase II.
Dystroglycan is selectively associated with inhibitory GABAergic synapses but is dispensable for their differentiation.
A synaptic Ras-GTPase activating protein (p135 SynGAP) inhibited by CaM kinase II.
A synaptic Ras-GTPase activating protein (p135 SynGAP) inhibited by CaM kinase II.
SynGAP: a synaptic RasGAP that associates with the PSD-95/SAP90 protein family.
Kim H, Kim D, Cho Y, Kim K, Roh JD, Kim Y, Yang E, Kim SS, Ahn S, Kim H, Kang H, Bae Y, Kim E
Nature communications 2022 Aug 27;13(1):5051
Nature communications 2022 Aug 27;13(1):5051
Cyfip1 Regulates SynGAP1 at Hippocampal Synapses.
Sahasrabudhe A, Begum F, Guevara CA, Morrison C, Hsiao K, Kezunovic N, Bozdagi-Gunal O, Benson DL
Frontiers in synaptic neuroscience 2020;12:581714
Frontiers in synaptic neuroscience 2020;12:581714
SynGAP splice variants display heterogeneous spatio-temporal expression and subcellular distribution in the developing mammalian brain.
Gou G, Roca-Fernandez A, Kilinc M, Serrano E, Reig-Viader R, Araki Y, Huganir RL, de Quintana-Schmidt C, Rumbaugh G, Bayés À
Journal of neurochemistry 2020 Sep;154(6):618-634
Journal of neurochemistry 2020 Sep;154(6):618-634
A sex difference in the response of the rodent postsynaptic density to synGAP haploinsufficiency.
Mastro TL, Preza A, Basu S, Chattarji S, Till SM, Kind PC, Kennedy MB
eLife 2020 Jan 15;9
eLife 2020 Jan 15;9
Dynamic- and Frequency-Specific Regulation of Sleep Oscillations by Cortical Potassium Channels.
Muheim CM, Spinnler A, Sartorius T, Dürr R, Huber R, Kabagema C, Ruth P, Brown SA
Current biology : CB 2019 Sep 23;29(18):2983-2992.e3
Current biology : CB 2019 Sep 23;29(18):2983-2992.e3
Tumor Suppression of Ras GTPase-Activating Protein RASA5 through Antagonizing Ras Signaling Perturbation in Carcinomas.
Li L, Fan Y, Huang X, Luo J, Zhong L, Shu XS, Lu L, Xiang T, Chan ATC, Yeo W, Chen C, Chan WY, Huganir RL, Tao Q
iScience 2019 Nov 22;21:1-18
iScience 2019 Nov 22;21:1-18
Re-expression of SynGAP protein in adulthood improves translatable measures of brain function and behavior.
Creson TK, Rojas C, Hwaun E, Vaissiere T, Kilinc M, Jimenez-Gomez A, Holder JL Jr, Tang J, Colgin LL, Miller CA, Rumbaugh G
eLife 2019 Apr 26;8
eLife 2019 Apr 26;8
A model for regulation by SynGAP-α1 of binding of synaptic proteins to PDZ-domain 'Slots' in the postsynaptic density.
Walkup WG, Mastro TL, Schenker LT, Vielmetter J, Hu R, Iancu A, Reghunathan M, Bannon BD, Kennedy MB
eLife 2016 Sep 13;5
eLife 2016 Sep 13;5
The calcium sensor Copine-6 regulates spine structural plasticity and learning and memory.
Reinhard JR, Kriz A, Galic M, Angliker N, Rajalu M, Vogt KE, Ruegg MA
Nature communications 2016 May 19;7:11613
Nature communications 2016 May 19;7:11613
Syngap1 haploinsufficiency damages a postnatal critical period of pyramidal cell structural maturation linked to cortical circuit assembly.
Aceti M, Creson TK, Vaissiere T, Rojas C, Huang WC, Wang YX, Petralia RS, Page DT, Miller CA, Rumbaugh G
Biological psychiatry 2015 May 1;77(9):805-15
Biological psychiatry 2015 May 1;77(9):805-15
GluN2B-Containing NMDA Receptors Regulate AMPA Receptor Traffic through Anchoring of the Synaptic Proteasome.
Ferreira JS, Schmidt J, Rio P, Águas R, Rooyakkers A, Li KW, Smit AB, Craig AM, Carvalho AL
The Journal of neuroscience : the official journal of the Society for Neuroscience 2015 Jun 3;35(22):8462-79
The Journal of neuroscience : the official journal of the Society for Neuroscience 2015 Jun 3;35(22):8462-79
Cadherin-8 expression, synaptic localization, and molecular control of neuronal form in prefrontal corticostriatal circuits.
Friedman LG, Riemslagh FW, Sullivan JM, Mesias R, Williams FM, Huntley GW, Benson DL
The Journal of comparative neurology 2015 Jan 1;523(1):75-92
The Journal of comparative neurology 2015 Jan 1;523(1):75-92
Phosphorylation of synaptic GTPase-activating protein (synGAP) by Ca2+/calmodulin-dependent protein kinase II (CaMKII) and cyclin-dependent kinase 5 (CDK5) alters the ratio of its GAP activity toward Ras and Rap GTPases.
Walkup WG 4th, Washburn L, Sweredoski MJ, Carlisle HJ, Graham RL, Hess S, Kennedy MB
The Journal of biological chemistry 2015 Feb 20;290(8):4908-4927
The Journal of biological chemistry 2015 Feb 20;290(8):4908-4927
Reduced cognition in Syngap1 mutants is caused by isolated damage within developing forebrain excitatory neurons.
Ozkan ED, Creson TK, Kramár EA, Rojas C, Seese RR, Babyan AH, Shi Y, Lucero R, Xu X, Noebels JL, Miller CA, Lynch G, Rumbaugh G
Neuron 2014 Jun 18;82(6):1317-33
Neuron 2014 Jun 18;82(6):1317-33
Impaired synaptic clustering of postsynaptic density proteins and altered signal transmission in hippocampal neurons, and disrupted learning behavior in PDZ1 and PDZ2 ligand binding-deficient PSD-95 knockin mice.
Nagura H, Ishikawa Y, Kobayashi K, Takao K, Tanaka T, Nishikawa K, Tamura H, Shiosaka S, Suzuki H, Miyakawa T, Fujiyoshi Y, Doi T
Molecular brain 2012 Dec 26;5:43
Molecular brain 2012 Dec 26;5:43
Deletion of densin-180 results in abnormal behaviors associated with mental illness and reduces mGluR5 and DISC1 in the postsynaptic density fraction.
Carlisle HJ, Luong TN, Medina-Marino A, Schenker L, Khorosheva E, Indersmitten T, Gunapala KM, Steele AD, O'Dell TJ, Patterson PH, Kennedy MB
The Journal of neuroscience : the official journal of the Society for Neuroscience 2011 Nov 9;31(45):16194-207
The Journal of neuroscience : the official journal of the Society for Neuroscience 2011 Nov 9;31(45):16194-207
Activity and protein kinase C regulate synaptic accumulation of N-methyl-D-aspartate (NMDA) receptors independently of GluN1 splice variant.
Ferreira JS, Rooyakkers A, She K, Ribeiro L, Carvalho AL, Craig AM
The Journal of biological chemistry 2011 Aug 12;286(32):28331-42
The Journal of biological chemistry 2011 Aug 12;286(32):28331-42
The Huntington's disease mutation impairs Huntingtin's role in the transport of NF-κB from the synapse to the nucleus.
Marcora E, Kennedy MB
Human molecular genetics 2010 Nov 15;19(22):4373-84
Human molecular genetics 2010 Nov 15;19(22):4373-84
Trans-synaptic EphB2-ephrin-B3 interaction regulates excitatory synapse density by inhibition of postsynaptic MAPK signaling.
McClelland AC, Hruska M, Coenen AJ, Henkemeyer M, Dalva MB
Proceedings of the National Academy of Sciences of the United States of America 2010 May 11;107(19):8830-5
Proceedings of the National Academy of Sciences of the United States of America 2010 May 11;107(19):8830-5
In vivo composition of NMDA receptor signaling complexes differs between membrane subdomains and is modulated by PSD-95 and PSD-93.
Delint-Ramirez I, Fernández E, Bayés A, Kicsi E, Komiyama NH, Grant SG
The Journal of neuroscience : the official journal of the Society for Neuroscience 2010 Jun 16;30(24):8162-70
The Journal of neuroscience : the official journal of the Society for Neuroscience 2010 Jun 16;30(24):8162-70
Age-related accumulation of Reelin in amyloid-like deposits.
Knuesel I, Nyffeler M, Mormède C, Muhia M, Meyer U, Pietropaolo S, Yee BK, Pryce CR, LaFerla FM, Marighetto A, Feldon J
Neurobiology of aging 2009 May;30(5):697-716
Neurobiology of aging 2009 May;30(5):697-716
Synapse composition and organization following chronic activity blockade in cultured hippocampal neurons.
Harms KJ, Craig AM
The Journal of comparative neurology 2005 Sep 12;490(1):72-84
The Journal of comparative neurology 2005 Sep 12;490(1):72-84
Gephyrin is critical for glycine receptor clustering but not for the formation of functional GABAergic synapses in hippocampal neurons.
Lévi S, Logan SM, Tovar KR, Craig AM
The Journal of neuroscience : the official journal of the Society for Neuroscience 2004 Jan 7;24(1):207-17
The Journal of neuroscience : the official journal of the Society for Neuroscience 2004 Jan 7;24(1):207-17
Regulation of the neuron-specific Ras GTPase-activating protein, synGAP, by Ca2+/calmodulin-dependent protein kinase II.
Oh JS, Manzerra P, Kennedy MB
The Journal of biological chemistry 2004 Apr 23;279(17):17980-8
The Journal of biological chemistry 2004 Apr 23;279(17):17980-8
Dystroglycan is selectively associated with inhibitory GABAergic synapses but is dispensable for their differentiation.
Lévi S, Grady RM, Henry MD, Campbell KP, Sanes JR, Craig AM
The Journal of neuroscience : the official journal of the Society for Neuroscience 2002 Jun 1;22(11):4274-85
The Journal of neuroscience : the official journal of the Society for Neuroscience 2002 Jun 1;22(11):4274-85
A synaptic Ras-GTPase activating protein (p135 SynGAP) inhibited by CaM kinase II.
Chen HJ, Rojas-Soto M, Oguni A, Kennedy MB
Neuron 1998 May;20(5):895-904
Neuron 1998 May;20(5):895-904
A synaptic Ras-GTPase activating protein (p135 SynGAP) inhibited by CaM kinase II.
Chen HJ, Rojas-Soto M, Oguni A, Kennedy MB
Neuron 1998 May;20(5):895-904
Neuron 1998 May;20(5):895-904
SynGAP: a synaptic RasGAP that associates with the PSD-95/SAP90 protein family.
Kim JH, Liao D, Lau LF, Huganir RL
Neuron 1998 Apr;20(4):683-91
Neuron 1998 Apr;20(4):683-91
No comments: Submit comment
Supportive validation
- Submitted by
- Invitrogen Antibodies (provider)
- Main image
- Experimental details
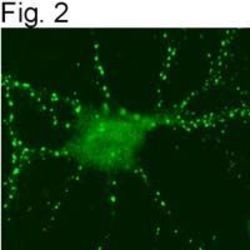
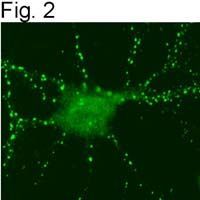
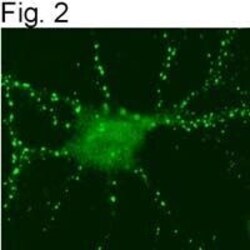
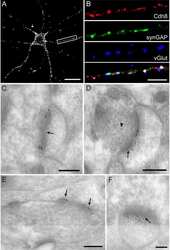
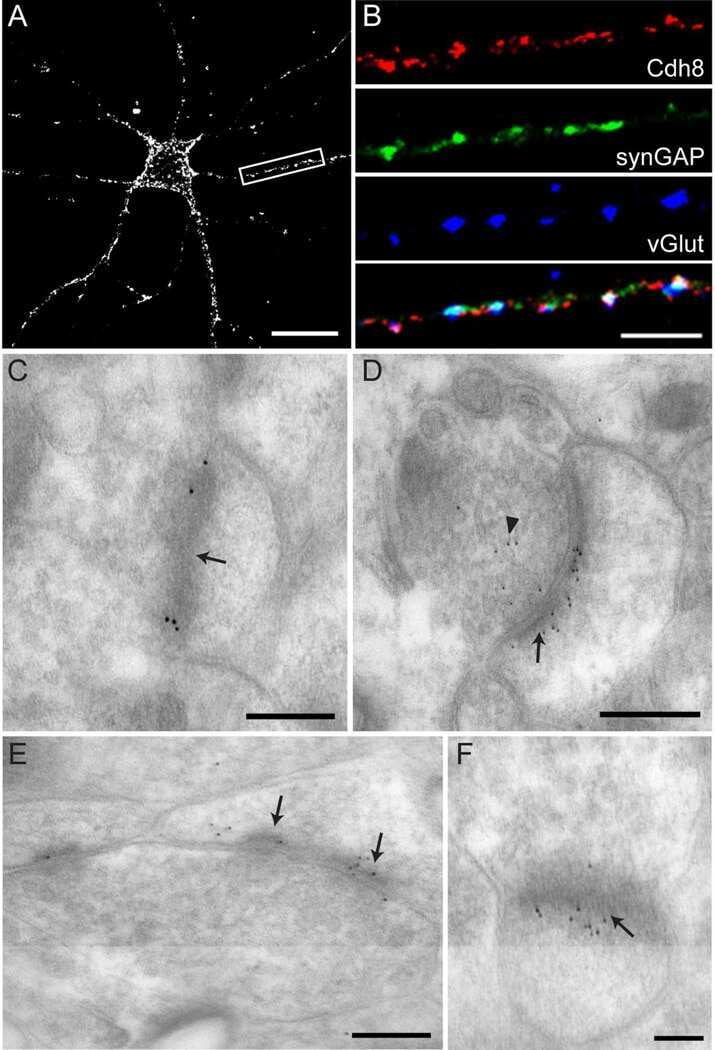
- Figures 2 illustrate immunolocalization of SynGAP in rat hippocampal neurons using Product # PA1-046.
- Submitted by
- Invitrogen Antibodies (provider)
- Main image
- Experimental details
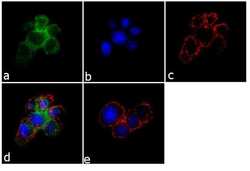
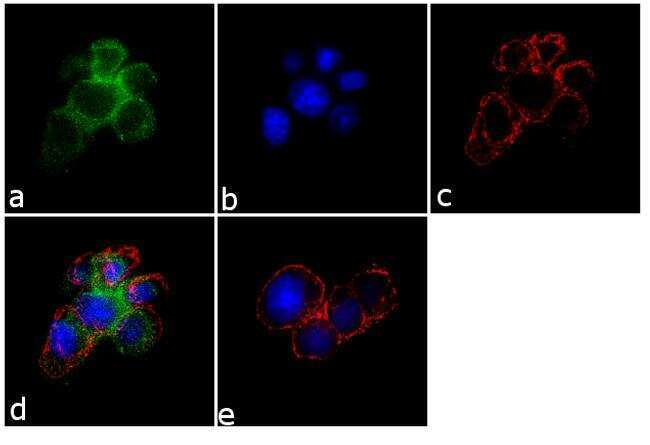
- Immunofluorescence analysis of SynGAP was performed using 70% confluent log phase PC-12 cells. The cells were fixed with 4% paraformaldehyde for 10 minutes, permeabilized with 0.1% Triton™ X-100 for 10 minutes, and blocked with 1% BSA for 1 hour at room temperature. The cells were labeled with SynGAP Rabbit Polyclonal Antibody (Product # PA1-046) at 2 µg/mL in 0.1% BSA and incubated for 3 hours at room temperature and then labeled with Goat anti-Rabbit IgG (H+L) Superclonal™ Secondary Antibody, Alexa Fluor® 488 conjugate (Product # A27034) at a dilution of 1:2000 for 45 minutes at room temperature (Panel a: green). Nuclei (Panel b: blue) were stained with SlowFade® Gold Antifade Mountant with DAPI (Product # S36938). F-actin (Panel c: red) was stained with Alexa Fluor® 555 Rhodamine Phalloidin (Product # R415, 1:300). Panel d represents the merged image showing membranous localization. Panel e shows the no primary antibody control. The images were captured at 60X magnification.
- Submitted by
- Invitrogen Antibodies (provider)
- Main image

- Experimental details
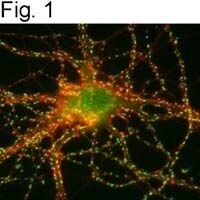
- Figures 1 illustrate immunolocalization of SynGAP in rat hippocampal neurons using Product # PA1-046.

- Submitted by
- Invitrogen Antibodies (provider)
- Main image
- Experimental details
- Figures 2 illustrate immunolocalization of SynGAP in rat hippocampal neurons using Product # PA1-046.

- Submitted by
- Invitrogen Antibodies (provider)
- Main image

- Experimental details
- Immunofluorescence analysis of SynGAP was performed using 70% confluent log phase PC-12 cells. The cells were fixed with 4% paraformaldehyde for 10 minutes, permeabilized with 0.1% Triton™ X-100 for 10 minutes, and blocked with 1% BSA for 1 hour at room temperature. The cells were labeled with SynGAP Rabbit Polyclonal Antibody (Product # PA1-046) at 2 µg/mL in 0.1% BSA and incubated for 3 hours at room temperature and then labeled with Goat anti-Rabbit IgG (Heavy Chain) Superclonal™ Secondary Antibody, Alexa Fluor® 488 conjugate (Product # A27034) at a dilution of 1:2000 for 45 minutes at room temperature (Panel a: green). Nuclei (Panel b: blue) were stained with SlowFade® Gold Antifade Mountant with DAPI (Product # S36938). F-actin (Panel c: red) was stained with Alexa Fluor® 555 Rhodamine Phalloidin (Product # R415, 1:300). Panel d represents the merged image showing membranous localization. Panel e shows the no primary antibody control. The images were captured at 60X magnification.

- Submitted by
- Invitrogen Antibodies (provider)
- Main image

- Experimental details
- Figures 1 illustrate immunolocalization of SynGAP in rat hippocampal neurons using Product # PA1-046.
- Submitted by
- Invitrogen Antibodies (provider)
- Main image

- Experimental details
- Figures 2 illustrate immunolocalization of SynGAP in rat hippocampal neurons using Product # PA1-046.

Supportive validation
- Submitted by
- Invitrogen Antibodies (provider)
- Main image
- Experimental details
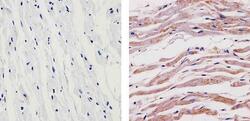
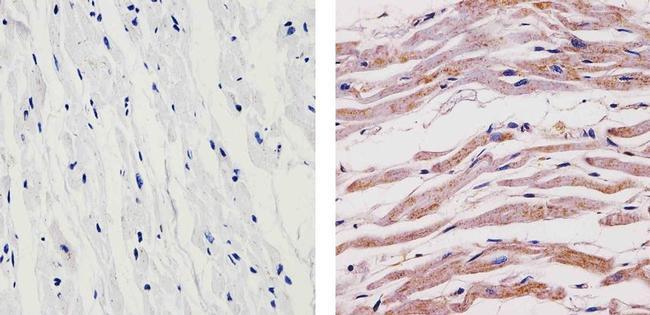
- Immunohistochemistry analysis of SYNGAP showing staining in the cytoplasm of paraffin-embedded human heart tissue (right) compared to a negative control without primary antibody (left). To expose target proteins, antigen retrieval was performed using 10mM sodium citrate (pH 6.0), microwaved for 8-15 min. Following antigen retrieval, tissues were blocked in 3% H2O2-methanol for 15 min at room temperature, washed with ddH2O and PBS, and then probed with a SYNGAP Rabbit Polyclonal Antibody (Product # PA1-046) diluted in 3% BSA-PBS at a dilution of 1:100 for 1 hour at 37ºC in a humidified chamber. Tissues were washed extensively in PBST and detection was performed using an HRP-conjugated secondary antibody followed by colorimetric detection using a DAB kit. Tissues were counterstained with hematoxylin and dehydrated with ethanol and xylene to prep for mounting.
- Submitted by
- Invitrogen Antibodies (provider)
- Main image
- Experimental details
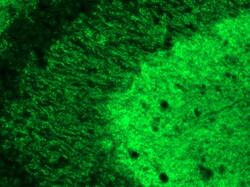
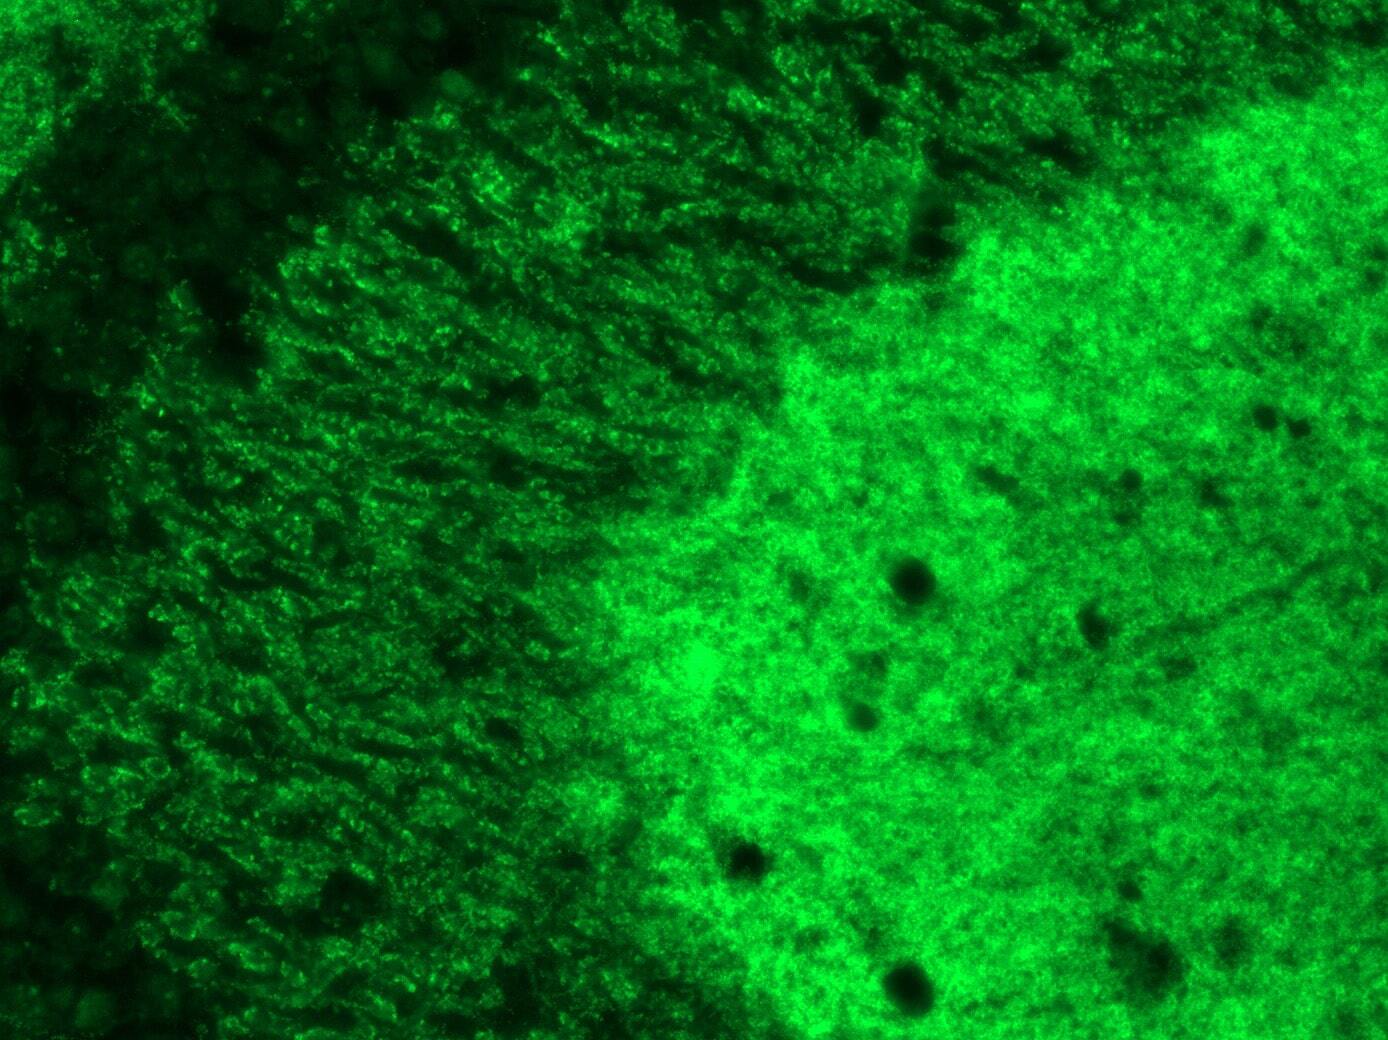
- Immunofluorescence analysis of SynGAP1 was performed on sections of adult rat brain. Tissue sections on slides were probed for 24 h at 4°C in a humidified chamber with rabbit polyclonal anti-SynGAP1 (Product # PA1-046) at an antibody concentration of 2 µg/mL diluted in 50 mM Tris-HCl, pH 7.4, containing 1.5% NaCl, 0.3% Triton X-100 (TBST) and 4% normal goat serum. After overnight incubation, sections were washed extensively for 1 hr in TBST, and detection of primary antibody was performed for 1.5 h at room temperature with AlexaFluor-488-conjugated donkey anti-rabbit diluted 1:600 in TBST. Sections were then washed in TBST, then in TBS (without Triton) and then coversliped with anti-fade medium. Images were taken on a scanning imager microscope at x20 objective magnification, and show immunofluorescence labelling of SynGAP1 localized at synapses in rat hippocampus. Data courtesy of Dr. Nagy's lab.
Supportive validation
- Submitted by
- Invitrogen Antibodies (provider)
- Main image
- Experimental details
- NULL
- Submitted by
- Invitrogen Antibodies (provider)
- Main image
- Experimental details
- NULL
- Submitted by
- Invitrogen Antibodies (provider)
- Main image

- Experimental details
- NULL

- Submitted by
- Invitrogen Antibodies (provider)
- Main image
- Experimental details
- NULL
- Submitted by
- Invitrogen Antibodies (provider)
- Main image
- Experimental details
- NULL
- Submitted by
- Invitrogen Antibodies (provider)
- Main image
- Experimental details
- NULL
- Submitted by
- Invitrogen Antibodies (provider)
- Main image

- Experimental details
- NULL
- Submitted by
- Invitrogen Antibodies (provider)
- Main image
- Experimental details
- NULL
- Submitted by
- Invitrogen Antibodies (provider)
- Main image
- Experimental details
- NULL
- Submitted by
- Invitrogen Antibodies (provider)
- Main image
- Experimental details
- NULL
- Submitted by
- Invitrogen Antibodies (provider)
- Main image
- Experimental details
- NULL

- Submitted by
- Invitrogen Antibodies (provider)
- Main image

- Experimental details
- NULL
- Submitted by
- Invitrogen Antibodies (provider)
- Main image
- Experimental details
- NULL
- Submitted by
- Invitrogen Antibodies (provider)
- Main image
- Experimental details
- NULL

- Submitted by
- Invitrogen Antibodies (provider)
- Main image
- Experimental details
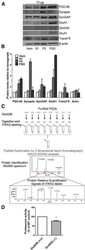
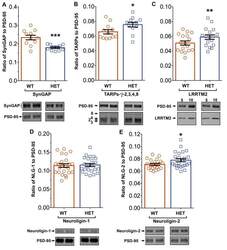
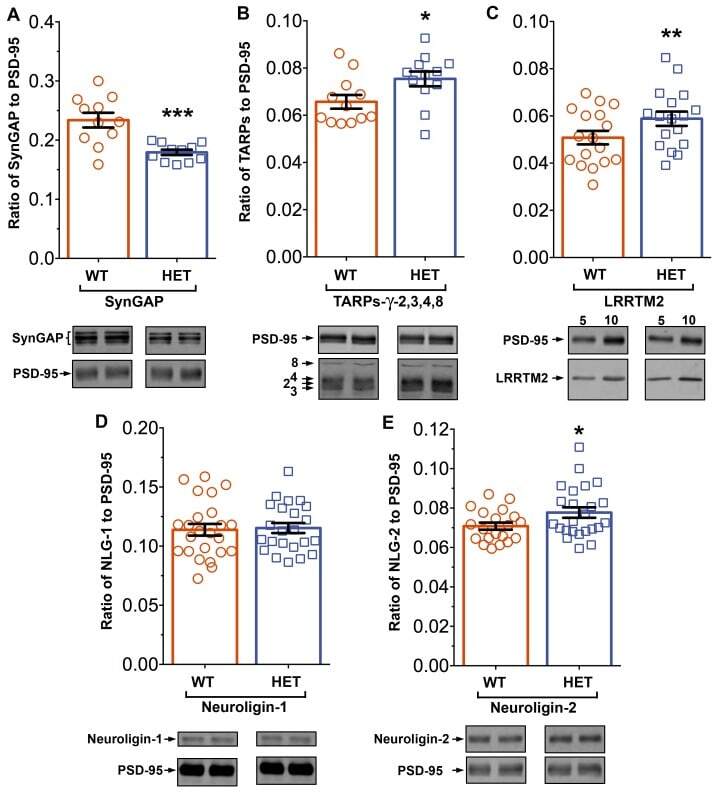
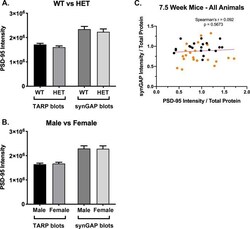
- Figure 11. Altered composition of the PSD in mice with heterozygous deletion of synGAP . Ratios of amounts of the indicated proteins to PSD-95 in each lane were measured as described in 'Materials and methods' and are reported as mean +- S.E. For all blots except those for neuroligin-1, PSD-95 was detected with a secondary Ab labeled with AlexaFluor680 and the binding protein was detected with secondary Ab labeled with IRDye 800. On the neuroligin-1 blot, both PSD-95 and neuroligin-1 were detected with AlexaFluor680; the two bands were well-separated in each lane. Representative sets of visualized bands for WT and HET from the same blot are shown below the graphs. Individual points represent the ratio of the indicated protein to PSD-95 in a single lane (n refers to these technical replicates). The WT and HET PSD preparations were each made from six animals; thus, each of the two preparations represents six biological replicates. ( A ) SynGAP to PSD-95 ratio. Data were collected for 22 lanes from two blots containing 5 ug total PSD fraction per lane. One blot contained six lanes WT and six lanes HET samples, the other contained five lanes of each. The mean ratio of synGAP to PSD-95 was 0.234 +- 0.012 for WT (n = 11) and 0.179 +- 0.005 (n = 11) for HET (-24%). Means were compared by unpaired, one-tailed t-test with Welch correction, p = 0.0007. Effect size, d = 1.75. ( B ) TARP g -2,3,4,8 to PSD-95 ratio. Data were collected for 24 lanes from two blots containing 10 u
- Submitted by
- Invitrogen Antibodies (provider)
- Main image
- Experimental details
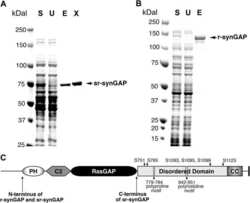
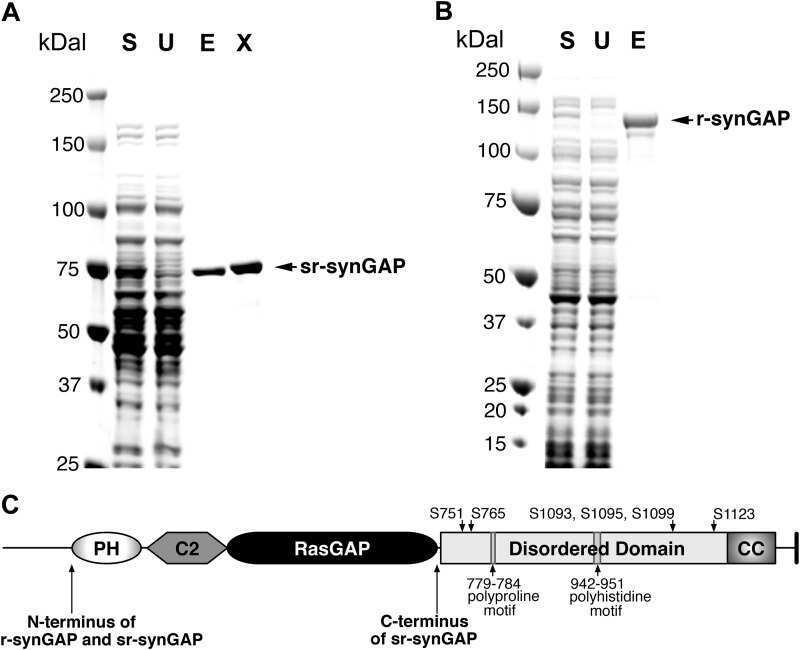
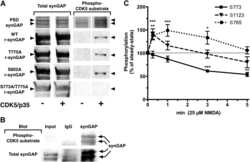
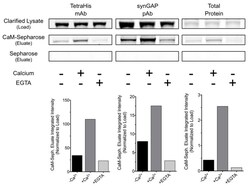
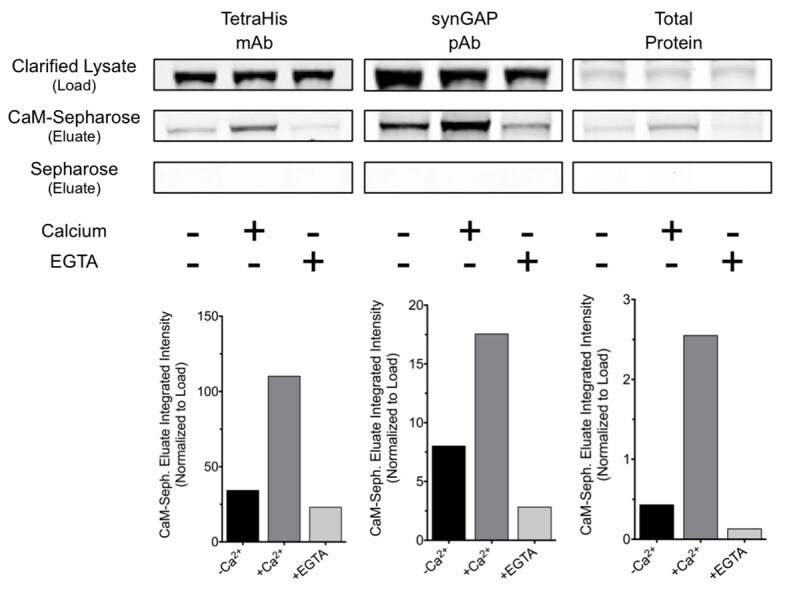
- Figure 8--figure supplement 1. R-synGAP-alpha1 binds to CaM affinity resin. Clarified E. coli lysate (Load) containing r-synGAP-alpha1 was incubated with CaM-Sepharose 4B or control Sepharose 4B resin in the presence of 0 or 5 mM CaCl 2 and 0 or 10 mM EGTA, as described under 'Materials and methods.' After washing, bound protein was eluted from the resin with 100 mM EGTA (Eluate), fractionated by SDS-PAGE, and visualized by staining with Gel Code Blue(Total Protein) or transferred to a PVDF membrane. R-synGAP-alpha1 was detected on the immunoblots with anti-synGAP or anti-TetraHis antibodies, as described under 'Materials and methods.' In the absence of exogenous calcium, r-synGAP-alpha1 bound weakly to the CaM-Sepharose, but not to control Sepharose beads. When 5 mM Ca 2+ was included in the binding and wash buffers its binding to CaM-Sepharose increased, while addition of 10 mM EGTA to the buffers nearly abolished binding. CaM-Sepharose eluate was quantified by scanning the stained blots and gel on a Li-Cor Imager as described under 'Materials and methods.' DOI: http://dx.doi.org/
- Submitted by
- Invitrogen Antibodies (provider)
- Main image
- Experimental details
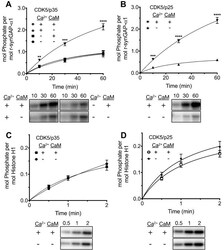
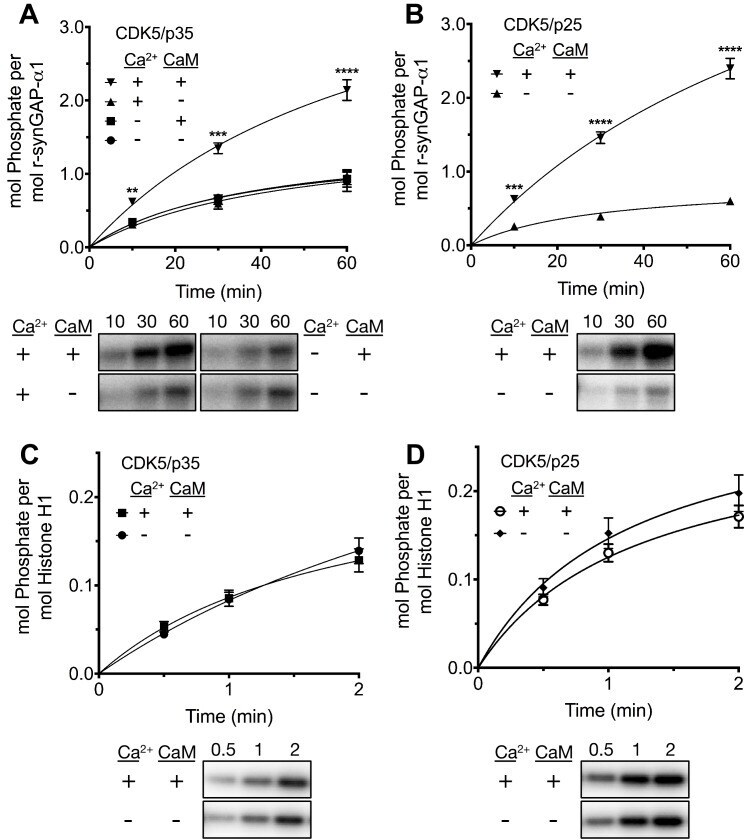
- Figure 8. Effect of Ca 2+ /CaM on stoichiometry of phosphorylation of r-synGAP-alpha1 and histone H1 by CDK5. Stoichiometry of phosphorylation of r-synGAP-alpha1 ( A and B ) and histone H1 ( C and D ) by CDK5/p35 or CDK5/p25. R-synGAP-alpha1 (286 nM) or histone H1 (4.3 muM) were incubated with CDK5/p35 or CDK5/p25 as described under 'Materials and methods' in the presence or absence of 0.7 mM CaCl 2 or 3.4 muM CaM, as indicated in each panel. Reactions were quenched at the indicated times by addition of 3x Laemmli sample buffer and radiolabeled r-synGAP-alpha1 and histone H1 were quantified as described under 'Materials and methods.' Data are plotted as mean +- S.E. (n = 4-7). The statistical significance of differences in phosphorylation in the presence of Ca 2+ and CaM were determined by ordinary one way ANOVA (uncorrected Fisher's LSD). **p
- Submitted by
- Invitrogen Antibodies (provider)
- Main image
- Experimental details
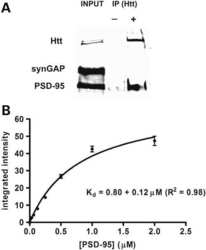
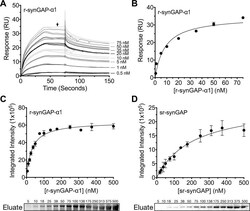
- Figure 9. Affinity of r-synGAP-alpha1 and sr-synGAP for Ca 2+ /CaM determined by equilibrium analysis. ( A and B ) The affinity of r-synGAP-alpha1 for Ca 2+ /CaM was measured by SPR with CaM immobilized on the chip and r-synGAP-alpha1 injected at 0-75 nM onto the chip surface as described under 'Materials and methods.' ( A ) Sensorgrams with the blank and reference flow cell readings subtracted show the response upon injection of r-synGAP-alpha1 onto the chip surface (0-75 s) and its dissociation from the chip surface (75-150 s). ( B ) RUs at equilibrium (marked by arrow in A ) were plotted against the corresponding concentrations of r-synGAP-alpha1 and fitted to a hyperbolic curve. A K D of 9 +- 1 nM was calculated as described under 'Materials and methods.' ( C and D ) The affinities of r-synGAP-alpha1 ( C ) and sr-synGAP ( D ), (0-500 nM) for Ca 2+ /CaM were measured by incubation with CaM-Sepharose resin as described under 'Materials and methods.' Integrated intensities of bound r-synGAP-alpha1 and sr-synGAP were measured from immunoblots as described under 'Materials and methods' and plotted versus the corresponding concentrations incubated with resin. Integrated intensities from Western blots were linear over the range of r-synGAP-alpha1 and sr-synGAP concentrations used in the assays. Data in C and D are plotted as mean +- S.E. (n = 3). DOI: http://dx.doi.org/

- Submitted by
- Invitrogen Antibodies (provider)
- Main image
- Experimental details
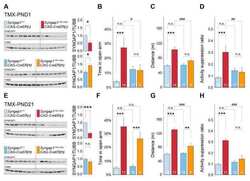
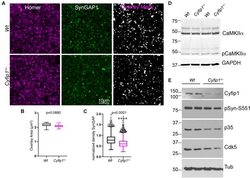
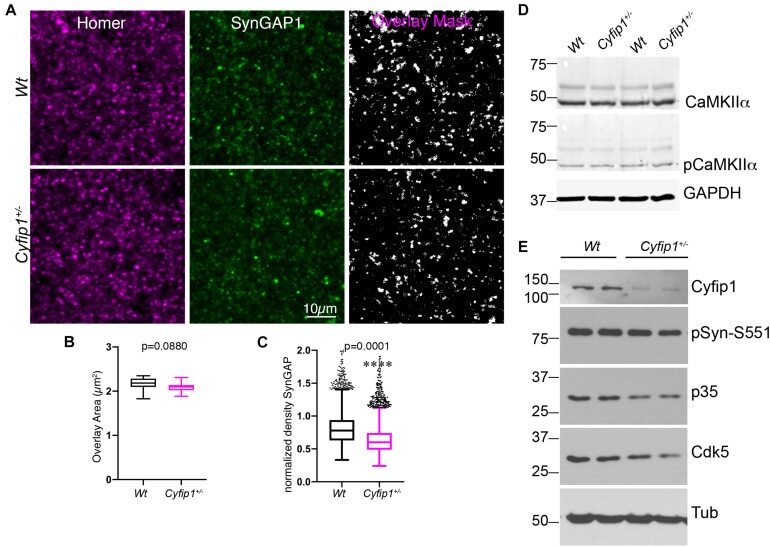
- FIGURE 2 Reduced synaptic SynGAP and Cdk5 activity. Area CA1 in Wt and Cyfip1 +/- mice was imaged at high magnification in sections immunolabeled for SynGAP1 [green; (A) ] and Homer1b/c [red; (A) ], analyzed using ImageJ [overlay mask in panel (A) ]. Box plots show the mean area of overlap (B) and the integrated intensity of SynGAP puncta (C) in Wt and Cyfip1 +/- CA1. Data were compared using unpaired t -test, p = 0.0880 (B) and p = 0.0001 (C) . (D) Western blot for total and phosphorylated CaMKIIalpha (comparison values are in the text). (E) Western blots for Cdk5, its activator, p35, and a substrate, p-Synapsin-Ser 551 in Wt and Cyfip1 +/- mutant mouse hippocampi (comparison values are in the text).
- Submitted by
- Invitrogen Antibodies (provider)
- Main image

- Experimental details
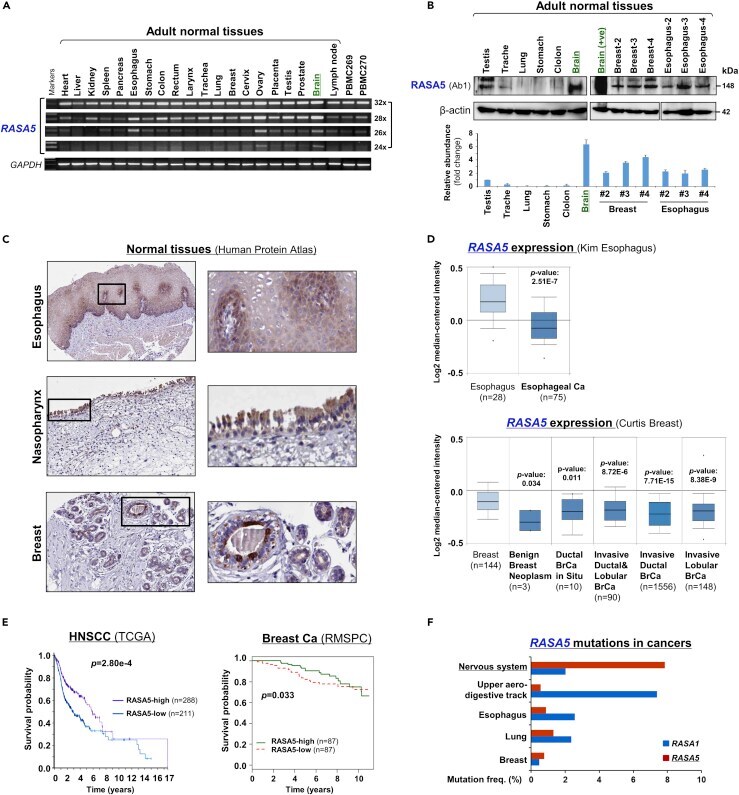
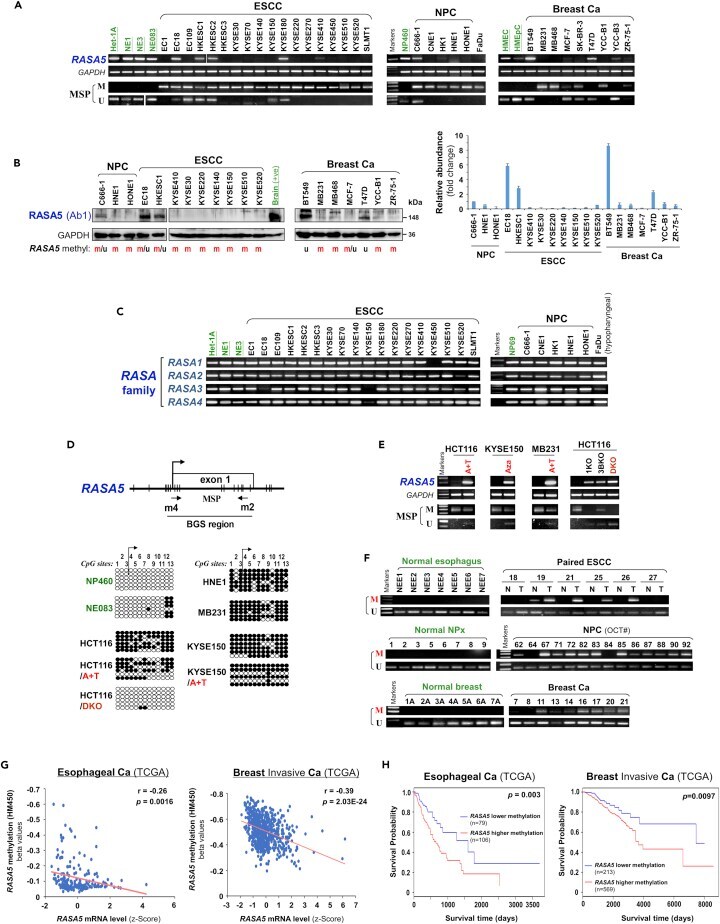
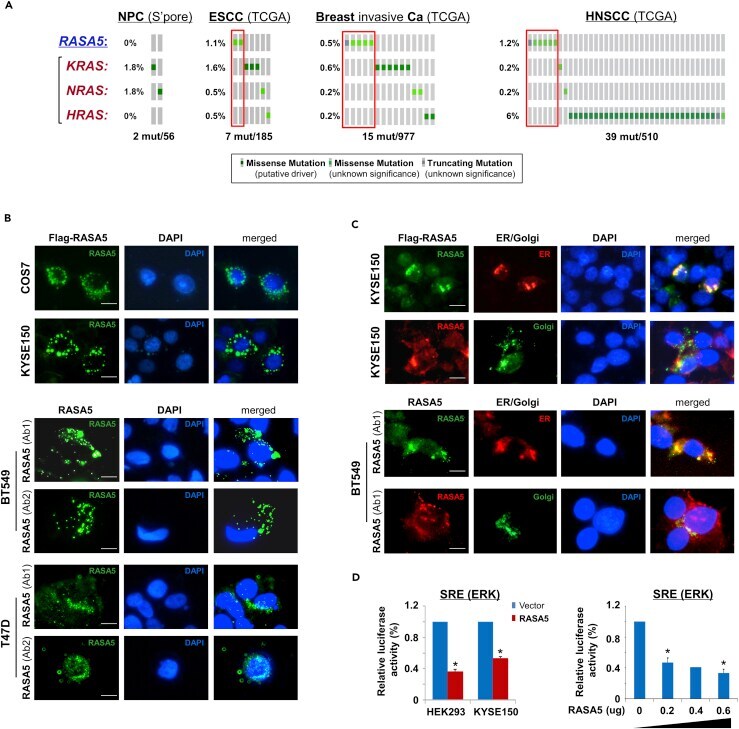
- Figure 1 RASA5 Is Expressed in Multiple Normal Tissues including Brain but Downregulated in Carcinomas (A) Examination of RASA5 transcript in normal tissues by semi-quantitative RT-PCR, using different PCR cycles (28, 26, and 24 cycles), with GAPDH as a control. PBMC, peripheral blood mononuclear cells. (B) RASA5 protein expression in normal tissues detected by Western blot, with brain tissue as the highest level. Anti-RASA5 antibody (Ab1, ThermoFisher, PA1-046) was used, with beta-actin as a loading control (upper panel). Graph represents quantification of Western blots with fold change (lower panel). Data were presented as mean +- SEM of three independent experiments and representative data were shown. (C) IHC of normal tissue microarrays (esophagus, nasopharynx, breast) from Human Protein Atlas ( www.proteinatlas.org , version 17). Anti-RASA5/SYNGAP1 pAb (HPA038373, Sigma-Aldrich) was used at a 1:35 ratio for staining. (D) Box plots showing RASA5 mRNA expression levels between ESCC and normal esophagus tissues, normal breast, and breast neoplasm with different stages (Oncomine datasets). The number of samples (n) and p values (determined by two-tailed Student's t test and Mann-Whitney U test) were shown. (E) Kaplan-Meier curve showing overall survival of patients with HNSCC (The Cancer Genome Atlas) (log rank p = 2.80 x 10 -4 ) or breast cancer (RMSPC) (log rank p = 0.033). (F) Somatic mutations of RASA5 and RASA1 genes in human cancers ( https://cancer.sanger.ac.uk/cosmic
- Submitted by
- Invitrogen Antibodies (provider)
- Main image
- Experimental details
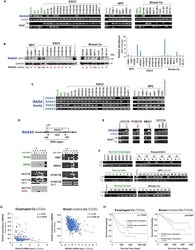
- Figure 2 Promoter CpG Methylation Mediates RASA5 Downregulation in Cancers (A) RASA5 expression and methylation analyzed in carcinomas with fewer Ras mutations. RASA5 expression levels determined by semi-quantitative RT-PCR. NPC, nasopharyngeal carcinoma; ESCC, esophageal squamous cell carcinoma. Ca, cancer. RASA5 promoter methylation was analyzed by methylation-specific PCR (MSP). M, methylated; U, unmethylated. (B) Western blot of RASA5 expression in representative tumor cell lines. Anti-RASA5 antibody (Ab1, ThermoFisher) was used, with GAPDH as a loading control. Graph represents quantification of Western blots with fold change (right). Data were presented as mean +- SEM of three independent experiments and representative data were shown. (C) Expression of other RASA family members ( RASA1, 2, 3 , and 4 ) in ESCC and NPC cell lines as detected by semi-quantitative RT-PCR. (D) RASA5 promoter CpG island, CpG sites shown as short vertical lines, methylation-specific PCR (MSP) primers, and bisulfite genomic sequencing (BGS) region indicated. BGS was used to examine RASA5 methylation in tumor cells. Every row of circles represented an individual promoter allele clone sequenced. Filled circles indicated methylated CpG sites, whereas empty ones unmethylated sites. Cell lines treated with demethylating agent Aza (A), combined with or without Trichostatin A (T). Genetic demethylation of colorectal cell line HCT116 with double knockout of DNMT1 and DNMT3B (DKO). (E) Pharmacologic an
- Submitted by
- Invitrogen Antibodies (provider)
- Main image
- Experimental details
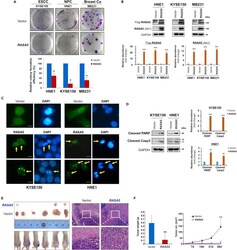
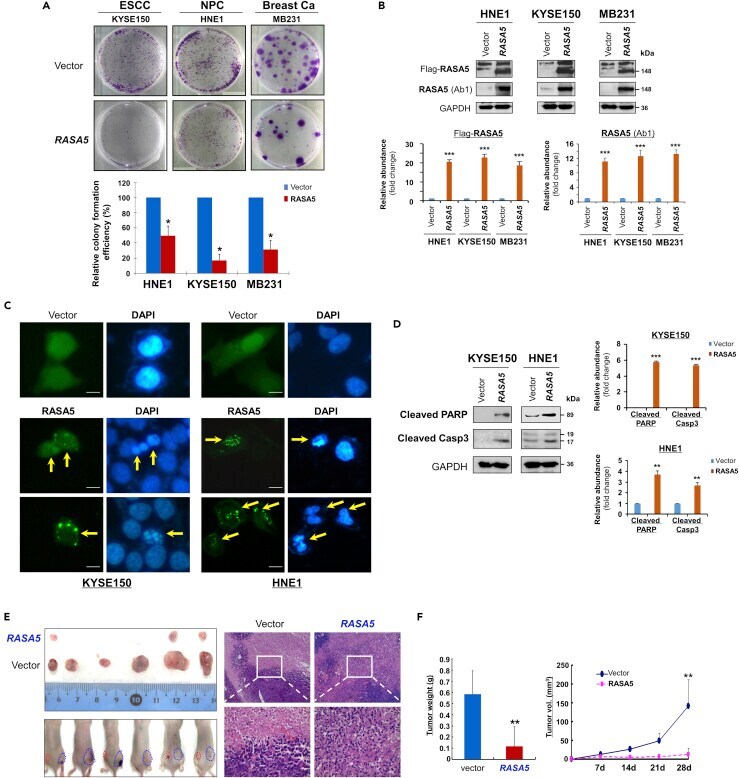
- Figure 3 RASA5 Functions as a Tumor Suppressor in Carcinoma Cells (A) Representative colony formation assay by monolayer culture of RASA5 -expressing ESCC, NPC, and breast tumor cells. Quantitative analyses of colony numbers shown as values of mean +- SEM of three independent experiments using Student's t test (lower panel), with colonies (>50 cells) in empty vector-transfected cells set as 100; *, p < 0.05. (B) RASA5 expression was confirmed using both anti-Flag and anti-RASA5 (Ab1, ThermoFisher) by Western blot. The straight arrow represents the specific band of RASA5 detected by anti-Flag antibody. Graphs represent quantification of Western blots with fold change compared with controls (lower panel). Data were presented as mean +- SEM of three independent experiments via Student's t test. ***, p < 0.001. (C) Characteristic nuclear changes of apoptotic cells after RASA5 expression. Arrows indicate EGFP+ cells. (D) Cleavage of apoptotic markers, PARP and caspase-3, in carcinoma cells transfected with Flag-tagged RASA5 construct. GAPDH served as a loading control. Graphs represent quantification of Western blots with fold change compared with controls (right). **, p < 0.01; ***, p < 0.001. Data were presented as mean +- SEM of three independent experiments via Student's t test. (E) Xenograft tumor formation of MB231 carcinoma cells expressing RASA5 or vector only. Cells were injected subcutaneously into nude mice. Representative photographs of H&E staining of xenografts (200x
- Submitted by
- Invitrogen Antibodies (provider)
- Main image
- Experimental details
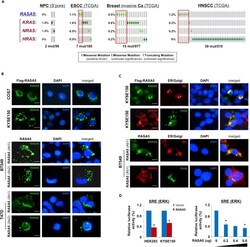
- Figure 4 RASA5 Is Partially Co-localized with ER/Golgi and Actin Tails in Carcinoma Cells (A) RASA5 mutations in cancer databases ( http://www.cbioportal.org/ ), together with KRAS, HRAS, and NRAS mutations. (B) RASA5 subcellular localization stained by indirect immunofluorescence. Exogenous expression of RASA5 was examined by anti-Flag antibody (green) in COS7 and KYSE150 cells. Endogenous expression of RASA5 in BT549 and T47D cells was examined by two different anti-RASA5 antibodies (Ab1, ThermoFisher; Ab2, Epitomics, green), nuclei counterstained with DAPI (blue). Original magnification, 400x. Scale bar 200 muM. (C) Co-localization of RASA5 with ER/Golgi compartments and actin tails. KYSE150 cells were co-transfected with Flag-RASA5 plasmid and either ER- or Golgi-specific plasmid (pDsRed-ER and pEYFP-Golgi, respectively). BT549 cells were transfected with ER- or Golgi-specific plasmid, respectively. Nuclei counterstained with DAPI (blue). Original magnification, 400x. Scale bar 200 muM. (D) Promoter activities of SRE reporter were evaluated in RASA5-expressing cells by dual-luciferase assay, normalized to values of Renilla luciferase activity. Results were expressed as fold reduction of activity and shown as mean +- SEM of three independent experiments performed in triplicate analyzed by Student's t test. Bottom panel: SRE-Luc reporter activity was reduced in KYSE150 cells with a RASA5 dosage-dependent manner; *, p < 0.05.
- Submitted by
- Invitrogen Antibodies (provider)
- Main image
- Experimental details
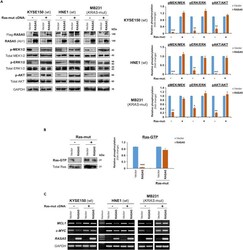
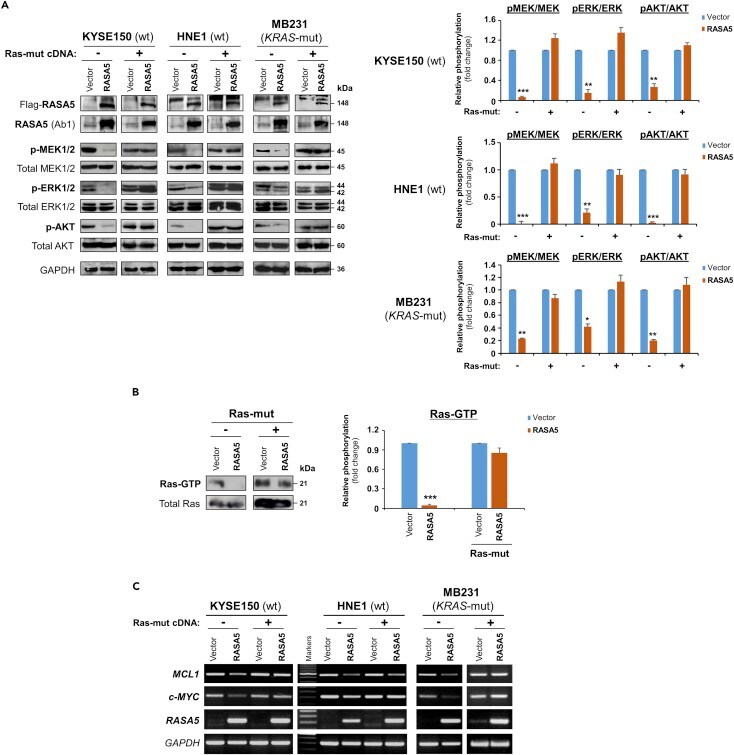
- Figure 5 RASA5 Functions as a RasGAP and Antagonizes RAS Signaling (A) Western blot of phosphor-MEK (pMEK), phosphor-ERK (pERK), and phosphor-Akt (pAKT) following RASA5 expression in RAS-wild-type (wt) KYSE150 and HNE1 cells, as well as KRAS-mutant (mut) MB231 cells. Ectopic expression of RASA5 downregulated phosphorylation levels of RAS signaling effectors, whereas active RAS mutant form (HRAS Q61L) counteracted this suppression. GAPDH used as a control. Quantification of the phosphor-immunoblots normalized to corresponding total protein levels (right). Data were presented as mean +- SEM of three independent experiments via Student's t test and representative data were shown. *, p < 0.05; **, p < 0.01; ***, p < 0.001. (B) Active GTP-bound form of Ras was pulled down by Raf-RBD and subjected to Western blot analysis. RASA5 downregulated Ras-GTP level, but overexpression of oncogenic HRAS Q61L reversed this suppression. Graph represents quantification of Western blots with fold change compared with controls (right). Data were presented as mean +- SEM of three independent experiments via Student's t test and representative data were shown. ***, p < 0.001. (C) Semi-quantitative RT-PCR analyses of RASA5 inhibitory effect on Ras target oncogenes MCL1 and c-MYC at mRNA levels. Ectopic expression of HRAS Q61L mutant abrogated this inhibition. wt, wild-type; mut, mutant.
- Submitted by
- Invitrogen Antibodies (provider)
- Main image
- Experimental details
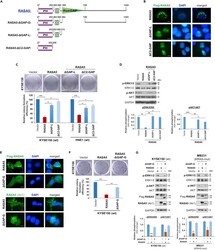
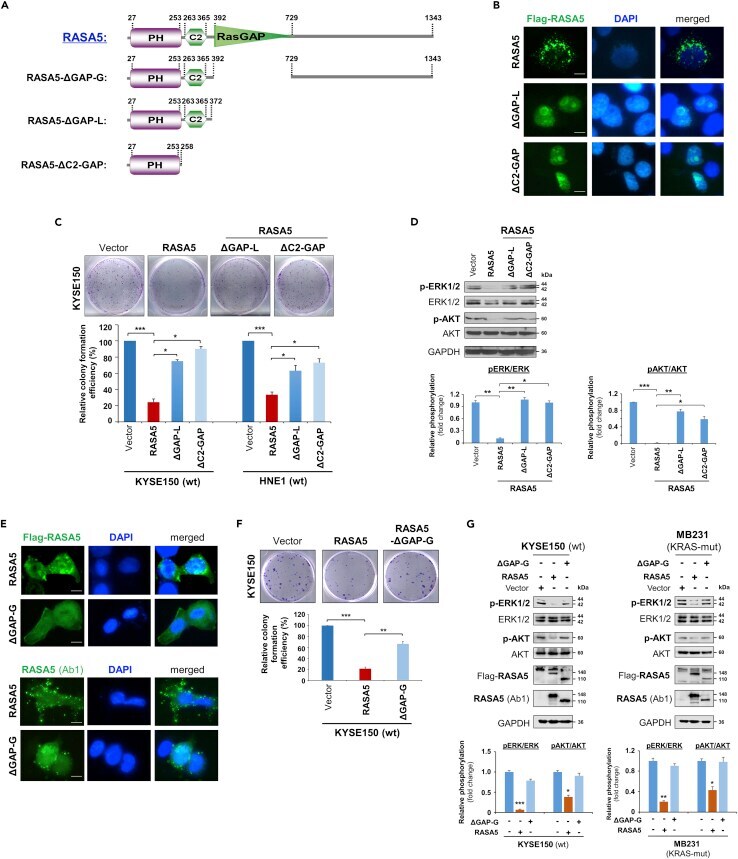
- Figure 7 RASA5 Exerts Its Tumor Suppressive Function Dependent on its GAP Domain (A) Schematic view of full-length RASA5 (wild type) and three truncated mutants (RASA5 DeltaGAP-G , RASA5 DeltaGAP-L , RASA5 DeltaC2-GAP ). DeltaGAP-G: RASA5 with only RasGAP domain deleted; DeltaGAP-L: RASA5 with PH and C2 domains remained; DeltaC2-GAP: RASA5 with C2 and RasGAP domains deleted. (B and E) Representative immunofluorescence analysis of subcellular localization of wild-type RASA5 and truncated mutants, RASA5 DeltaGAP-L and RASA5 DeltaC2-GAP mutants (B); RASA5 DeltaGAP-G mutant (E), labeled with anti-Flag antibody (green) or anti-RASA5 (Ab1, ThermoFisher). Nuclei marked by DAPI (blue). Original magnification, 400x. Scale bar 200 muM. (C and F) Effects of deletions of GAP domain and C2-GAP tandem on cell growth by colony formation assay. KYSE150 cells transiently transfected with plasmid expressing RASA5 or either of the three mutants, RASA5 DeltaGAP-L and RASA5 DeltaC2-GAP mutants (C); RASA5 DeltaGAP-G mutant (F). Number of colonies was presented in a bar graph (data were mean +- SEM of three independent experiments, *, p < 0.05; **, p < 0.01; ***, p < 0.001). Data were presented as mean +- SEM of three independent experiments by One Way ANOVA with multiple comparison post hoc analysis and representative data were shown. (D and G) Western blot of phosphorylation of ERK1/2 and AKT in tumor cells with expression of RASA5 or three truncated mutants. (D) Effects of RASA5 and two indicate
- Submitted by
- Invitrogen Antibodies (provider)
- Main image
- Experimental details
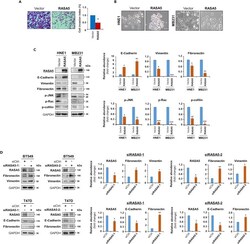
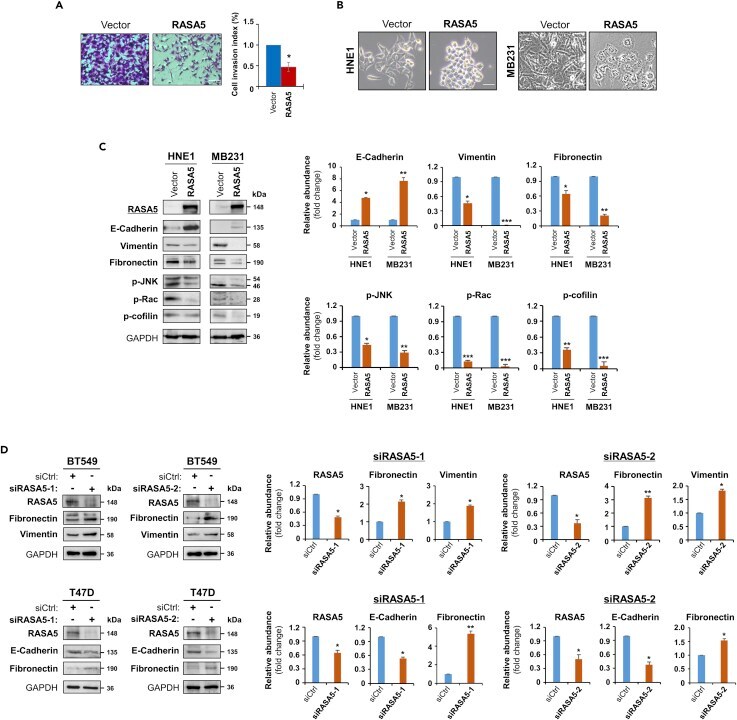
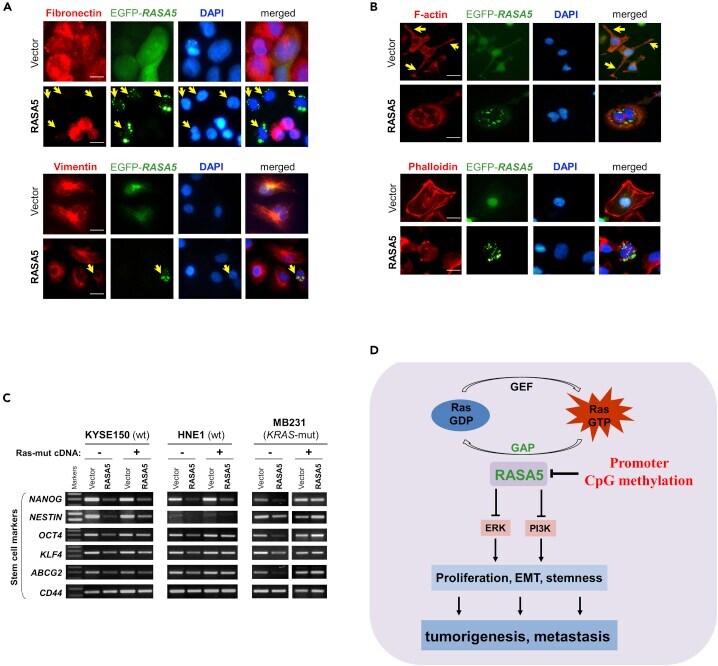
- Figure 8 RASA5 Restoration Suppresses Tumor Cell Invasion and Reverses Cell EMT Phenotype (A) Matrigel invasion chamber assay of RASA5-expressing MB231 cells. Invaded cells at the lower surface of transwell filter were stained and counted. *, p < 0.05. Scale bar 200 muM. Each bar represented mean +- SEM of three independent experiments with control cells as the baseline using Student's t test. (B) Morphology changes of HNE1 and MB231 cells stably expressing RASA5. Original magnification, 400x. Scale bar 200 muM. (C) Ectopic RASA5 expression upregulated E-cadherin, downregulated vimentin, fibronectin and phosphorylation levels of Rac, cofilin, and JNK1/2 by Western blot in HNE1 and MB231 cells. GADPH as a loading control. Graphs represent quantification of Western blots with fold changes compared with controls (right). Data were presented as mean +- SEM of three independent experiments via Student's t test and representative data were shown. *, p < 0.05; **, p < 0.01; ***, p < 0.001. (D) Expression of EMT markers (E-cadherin, vimentin, and fibronectin) was examined by Western blot in BT549 and T47D cells with RASA5-knockdown through two different siRNAs (siRASA5-1, siRASA5-2). Right panel graphs represent quantification of Western blots with fold changes compared with controls (right). *, p < 0.05; **, p < 0.01. Data were presented as mean +- SEM of three independent experiments via Student's t test and representative data were shown.
- Submitted by
- Invitrogen Antibodies (provider)
- Main image
- Experimental details
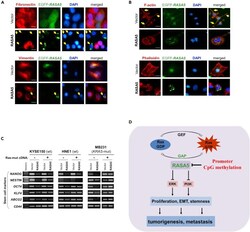
- Figure 9 RASA5 Restoration Reversed Cell EMT Phenotype in Carcinoma Cells (A) Immunofluorescence labeling of EMT markers (fibronectin and vimentin) in HNE1 and MB231 cells with RASA5 re-expression. Cells transiently transfected with RASA5-EGFP construct or empty vector. Arrows indicate EGFP+ cells. Original magnification, 400x. Scale bar 200 muM. (B) Immunofluorescence analysis of actin cytoskeletal protein F-actin in RASA5-expressing cells. HNE1 cells expressing RASA5 were round in shape and mostly lacked a clearly defined leading edge protrusion of F-actin that vector-transfected cells usually showed (arrows). Proper F-actin stress fibers formed in control cells after stress treatment, while impaired in RASA5-expressing MB231 cells by rhodamine-labeled phalloidin staining. Original magnification, 400x. Scale bar 200 muM. (C) Representative stem cell markers detected by semi-quantitative RT-PCR in HNE1, KYSE150, and MB231 cells with stable expression of RASA5, along with or without concomitantly expressed active RAS mutant form (HRAS Q61L). (D) Proposed model of alternative mechanism of activating Ras signaling via deregulation of RasGAP protein RASA5 during human carcinogenesis. Loss of RASA5 is detected in multiple carcinomas and tightly correlated with promoter CpG methylation. RASA5 restoration inhibits carcinoma cell growth and metastasis through inhibiting Ras signaling.
- Submitted by
- Invitrogen Antibodies (provider)
- Main image
- Experimental details
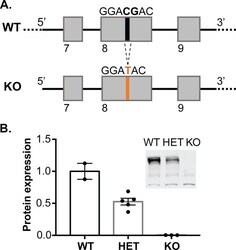
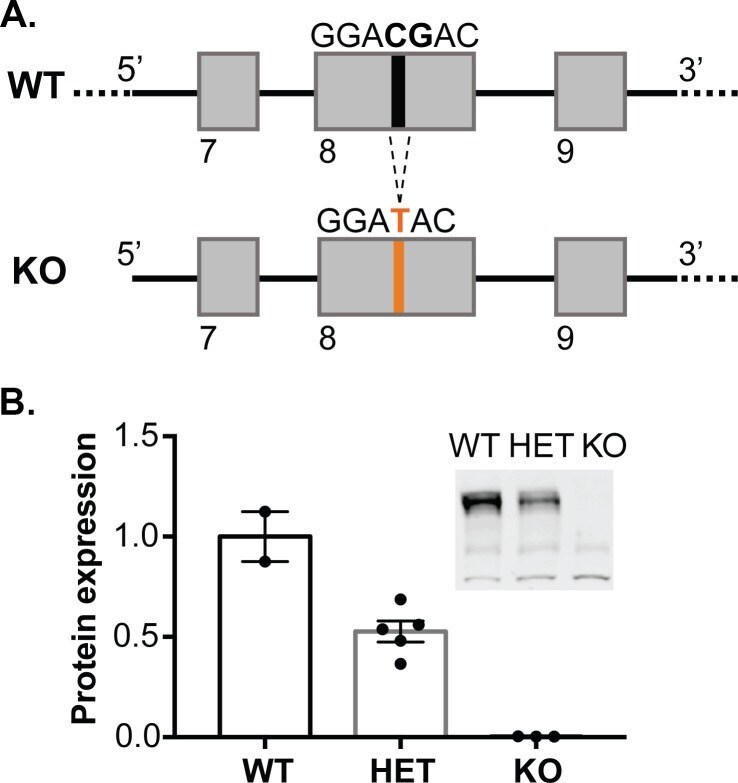
- Figure 1. Generation of synGAP rats. ( A ) SynGAP targeting strategy introduces a frame shift mutation into exon 8. ( B ) Quantification of synGAP immunoblots (inset) of cortical homogenates was performed as described in Materials and methods.
- Submitted by
- Invitrogen Antibodies (provider)
- Main image
- Experimental details
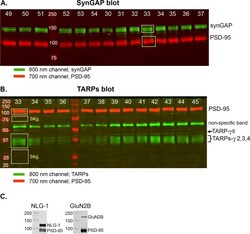
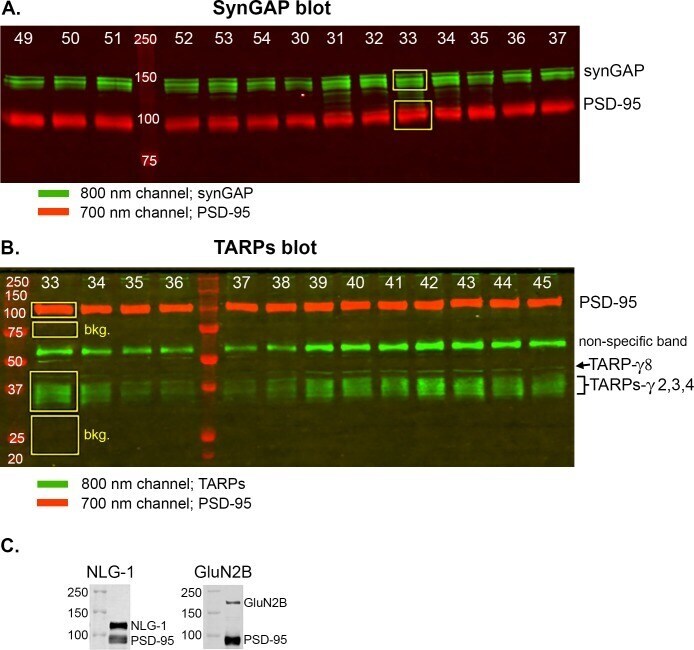
- Figure 2--figure supplement 1. Measurement of densities and calculation of ratios. ( A ) Example of an immunoblot that was double-stained for synGAP and PSD-95 as described under Materials and methods. ( B ) Example of an immunoblot that was double-stained for TARPs and PSD-95 as described under Materials and methods. The numbers at the top of each lane identify samples from individual rodents. The fluorescent signals at 700 and 800 nm on double-stained blots were scanned separately on the LiCor Odyssey scanner and stored in separate files. The figure is a superposition of images of the two scans. The brightness of each image was adjusted to provide the most accurate visual appearance. The LiCor system has two important advantages; adjustment of the brightness and contrast of images does not alter the underlying digital data; and the digital data can be recorded over a very large linear range. The images show examples of 'regions of interest (ROI)' placed with LiCor software on each of the four underlying digital files. Digital fluorescence densities within each ROI were recorded and transferred to Excel. To record background densities We used similarly sized boxes placed immediately below the target fluorescent bands. The bkg. boxes are shown only in B) to avoid visual confusion, but were recorded for all signals. ( C ) Specificity of antibodies for neuroligin-1 and GluN2B. For staining of synGAP, TARPS, and neuroligin-2, we used the same antibodies that were documented in W
- Submitted by
- Invitrogen Antibodies (provider)
- Main image
- Experimental details
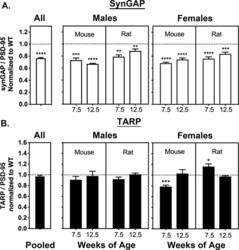
- Figure 2. Averaged ratios of synGAP and TARPs to PSD-95 in PSDs from WT and HET Rats and Mice. PSDs were purified from the brains of individual animals as described under Materials and methods. The ratios of synGAP to PSD-95 ( A ) and TARPs to PSD-95 ( B ) were determined as described under Materials and methods and in Figure 2--figure supplement 1 . Ratios from HET animals (bars) are normalized to the ratios from WT animals (dotted lines). Antibodies against synGAP, TARPS, and PSD-95 are the same as those used in Walkup et al. (2016) . The antibody against synGAP (AB_2287112) recognizes all isoforms of synGAP. The antibody against TARPs (AB_877307) recognizes TARP-gamma2, gamma3, gamma4, and gamma8. The sample sizes for each group and the significance tests are as follows. A) all animals WT = 79 and HET = 78, one-tailed Wilcoxon matched-pairs signed rank test; male mouse 7.5 weeks WT = 11 and HET = 9, one-tailed Student T-test; male mouse 12.5 weeks WT = 11 and HET = 8, one-tailed Student T-test with Welch's correction; male rat 7.5 weeks WT = 11 and HET = 10, one-tailed Student T-test; male rat 12.5 weeks WT = 10 and HET = 11, one-tailed Student T-test; female mouse 7.5 weeks WT = 10 and HET = 12, one-tailed Student T-test with Welch's correction; female mouse 12.5 WT = 9 and HET = 9, one-tailed Student T-test; female rat 7.5 weeks WT = 10 and HET = 10, one-tailed Student T-test; female rat 12.5 weeks WT = 9 and HET = 10, one-tailed Student T-test. B) all animals WT = 77 an

- Submitted by
- Invitrogen Antibodies (provider)
- Main image
- Experimental details
- Figure 3--figure supplement 1. Intensity of PSD-95 bands on immunoblots. Blots were double-stained for PSD-95 and the target proteins as described under Materials and methods. SynGAP, GluN2B, NLG-1 and NLG-2 were fractionated on 8% gels. TARPS were fractionated on 12% gels. The averaged intensity of staining of PSD-95 was not statistically different between WT and HET ( A ) or between Male and Female ( B ), measured on blots of 8% or 12% gels. ( C ) For each set of blots, a separate gel of the same individual samples was stained for protein with Coomassie blue. For the blots of 7.5 week old mice, synGAP intensity was divided by Coomassie intensity for each individual. PSD-95 intensity (from blots double stained for TARP) was divided by Coomassie intensity for each individual. Plots of synGAP intensity against PSD-95 intensity revealed no significant correlation between the two values. This data shows that the correlation between the synGAP/PSD-95 ration and the TARP/PSD-95 ratio in 7.5 week mice was not influenced by a correlation between levels of synGAP and PSD-95. Separate plots of data from 7.5 week old HET female mice, in which the largest correlation between synGAP and TARP was observed, produced a Spearman's r = -0.0.2069 with p=0.5187. Plots of data for 7.5 week old male mice also showed no significant correlation.

- Submitted by
- Invitrogen Antibodies (provider)
- Main image
- Experimental details
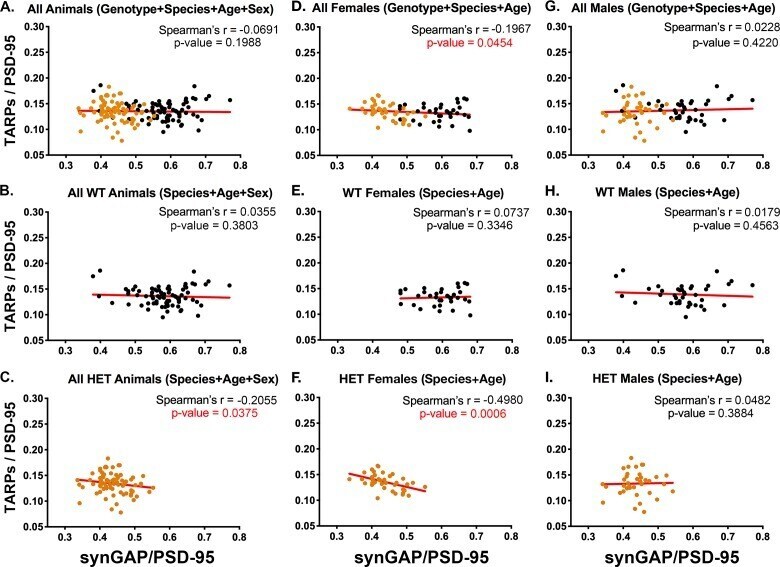
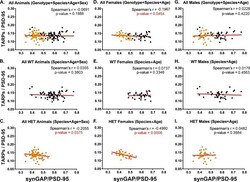
- Figure 3. Correlation of the ratios TARPs/PSD-95 and synGAP/PSD-95 among individual animals. Each point represents mean ratios for a single animal. Corrected ratios and Spearman's rank correlation coefficients were determined as described under Materials and methods. ( A ) All animals, including all genotypes, ages, species, and sexes; n = 152. ( B ) All WT animals, including all ages, species, and sexes; n = 76. ( C ) All HET animals, including all ages, species, and sexes; n = 76. ( D ) All female animals, including all genotypes, ages, and species; n = 75. ( E ) All WT females including all ages and species; n = 36. ( F ) All HET females, including all ages and species; n = 39. ( G ) All male animals, including all genotypes, ages, and species; n = 77. ( H ) All WT males, including all ages and species; n = 40. ( I ) All HET males, including all ages and species; n = 37. Black symbols, WT; Orange symbols, HET. P-values for Spearman's rank correlation coefficient are one-tailed. Significant p-values are shown in red. Figure 3--figure supplement 1. Intensity of PSD-95 bands on immunoblots. Blots were double-stained for PSD-95 and the target proteins as described under Materials and methods. SynGAP, GluN2B, NLG-1 and NLG-2 were fractionated on 8% gels. TARPS were fractionated on 12% gels. The averaged intensity of staining of PSD-95 was not statistically different between WT and HET ( A ) or between Male and Female ( B ), measured on blots of 8% or 12% gels. ( C ) For each se