Explore
 Validate
 Learn
Learn Western blot
Antibody data
- Antibody Data
- Antigen structure
- References [1]
- Comments [0]
- Validations
- Western blot [1]
- Immunohistochemistry [3]
- Other assay [1]
Submit
Validation data
Reference
Comment
Report error
- Product number
- PA5-95288 - Provider product page

- Provider
- Invitrogen Antibodies
- Product name
- HTR2A Polyclonal Antibody
- Antibody type
- Polyclonal
- Antigen
- Synthetic peptide
- Description
- Reconstitute with 0.2 mL of distilled water to yield a concentration of 500 µg/mL. Positive Control - WB: Rat Brain Tissue, Rat Testis Tissue, U87 whole cell. IHC: human glioma tissue, rat brain tissue.|Store at -20°C for one year from date of receipt. After reconstitution, at 4°C for one month. It can also be aliquotted and stored frozen at -20°C for six months. Avoid repeated freeze-thaw cycles.
- Reactivity
- Human, Rat
- Host
- Rabbit
- Isotype
- IgG
- Vial size
- 100 μg
- Concentration
- 500 μg/mL
- Storage
- -20°C
Submitted references Mechanisms Underlying the Action of Ziziphi Spinosae Semen in the Treatment of Insomnia: A Study Involving Network Pharmacology and Experimental Validation.
Bian Z, Zhang W, Tang J, Fei Q, Hu M, Chen X, Su L, Fei C, Ji D, Mao C, Tong H, Yuan X, Lu T
Frontiers in pharmacology 2021;12:752211
Frontiers in pharmacology 2021;12:752211
No comments: Submit comment
Supportive validation
- Submitted by
- Invitrogen Antibodies (provider)
- Main image
- Experimental details
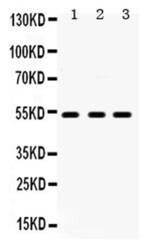
- Western blot analysis of HTR2A in Lane 1: rat brain tissue lysate, Lane 2: rat testis tissue lysate, Lane 3: U87 whole cell lysate. Electrophoresis was performed with 5-20% SDS-PAGE gel (70V, Stacking gel; 90V Resolving gel, Time: 2-3 hours), transferred to a nitrocellulose membrane and blocked using 5% Non-fat Milk/TBS (1.5 hrs at room temperature). Samples were incubated with HTR2A polyclonal antibody (Product # PA5-95288) using a 0.5 µg/mL dilution, followed by a goat anti-rabbit IgG-HRP at a dilution of 1:10,000, and developed with enhanced chemiluminescence (ECL).

Supportive validation
- Submitted by
- Invitrogen Antibodies (provider)
- Main image
- Experimental details
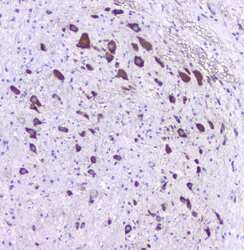
- Immunohistochemistry analysis of HTR2A in paraffin-embedded rat brain tissues. Antigen retrieval was performed on the tissue using citrate buffer (pH 6, 20 min) and blocked with 10% goat serum. Samples were incubated with HTR2A polyclonal antibody (Product # PA5-95288) at a 1 µg/mL dilution, followed by biotinylated goat anti-rabbit IgG (30 min, 37°C), and developed with Strepavidin-Biotin-Complex and DAB.
- Submitted by
- Invitrogen Antibodies (provider)
- Main image

- Experimental details
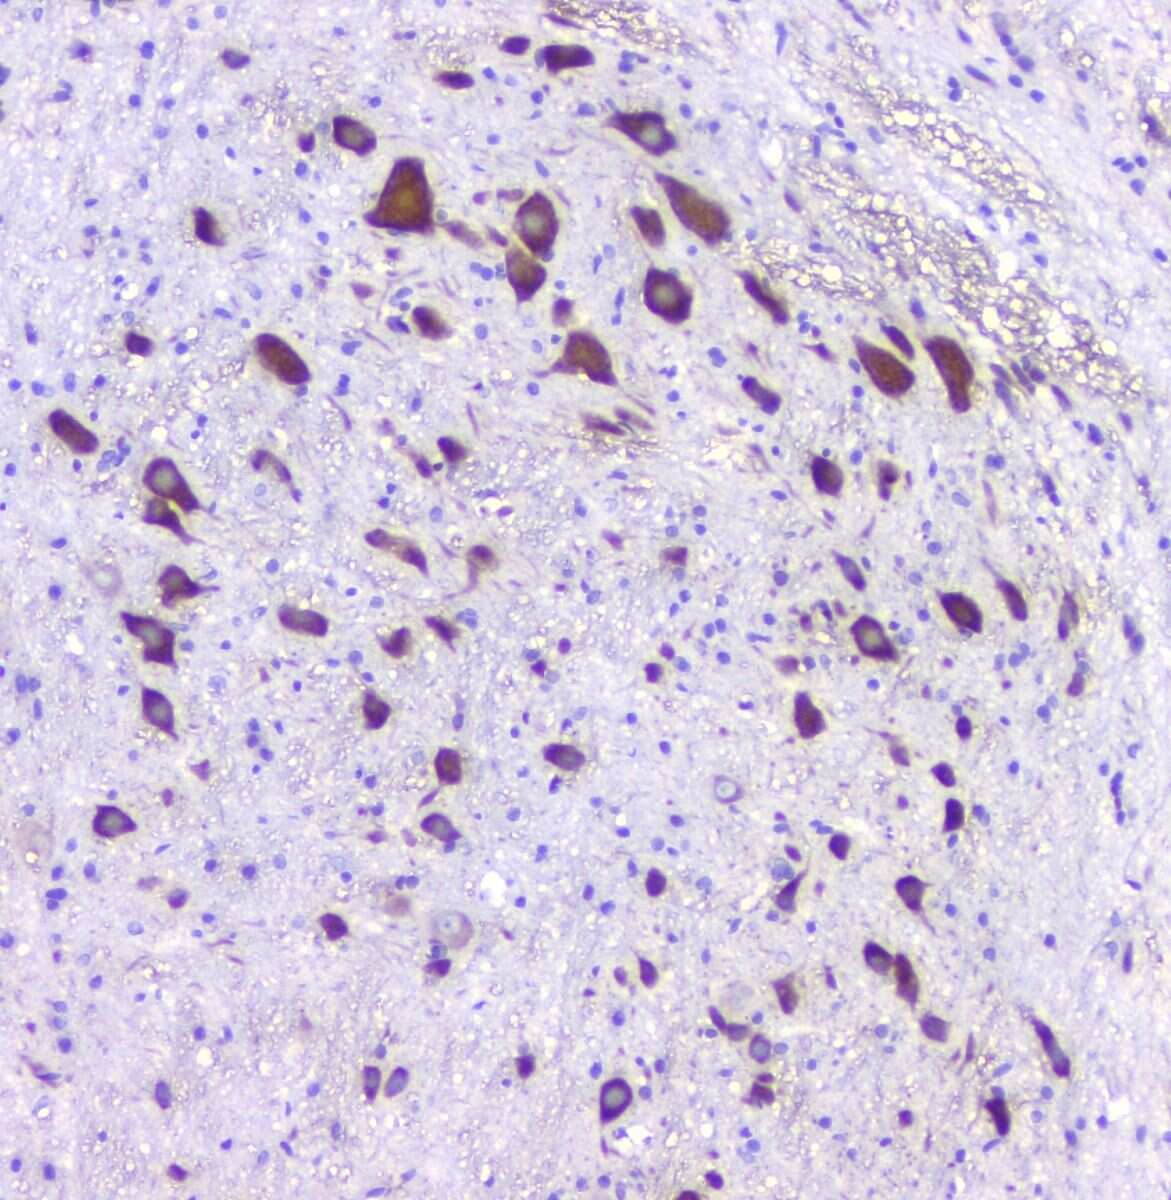
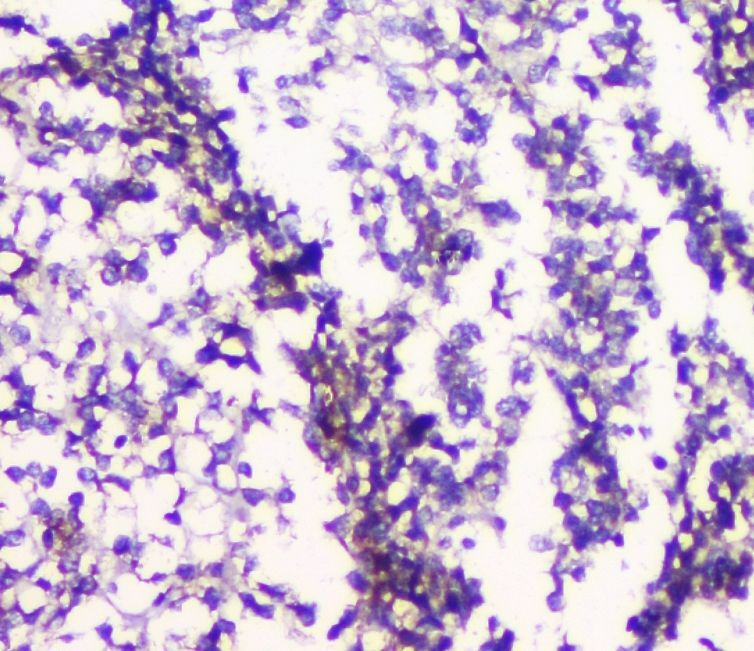
- Immunohistochemistry analysis of HTR2A in paraffin-embedded human glioma tissue. Antigen retrieval was performed on the tissue using citrate buffer (pH 6, 20 min) and blocked with 10% goat serum. Samples were incubated with HTR2A polyclonal antibody (Product # PA5-95288) at a 1 µg/mL dilution, followed by biotinylated goat anti-rabbit IgG (30 min, 37°C), and developed with Strepavidin-Biotin-Complex and DAB.

- Submitted by
- Invitrogen Antibodies (provider)
- Main image

- Experimental details
- Immunohistochemistry analysis of HTR2A in paraffin-embedded human glioma tissue. Antigen retrieval was performed on the tissue using citrate buffer (pH 6, 20 min) and blocked with 10% goat serum. Samples were incubated with HTR2A polyclonal antibody (Product # PA5-95288) at a 1 µg/mL dilution, followed by biotinylated goat anti-rabbit IgG (30 min, 37°C), and developed with Strepavidin-Biotin-Complex and DAB.
Supportive validation
- Submitted by
- Invitrogen Antibodies (provider)
- Main image

- Experimental details
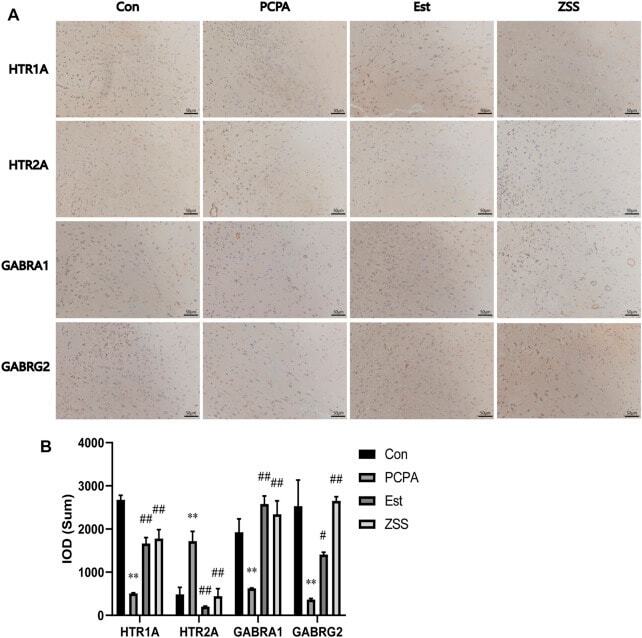
- FIGURE 8 The effects of ZSS on the expression of HTR1A, HTR2A, GABRA1 and GABRG2 in the hypothalamus (A) and immunohistochemistry results (the sum of the IOD) (B) . ** p < 0.01 compared with the control group, ## p < 0.01 compared with the model group. Data are shown as mean +- SD values and n = 3.