Explore
 Validate
 Learn
Learn Western blot
 Immunocytochemistry
Antibody data
- Antibody Data
- Antigen structure
- References [5]
- Comments [0]
- Validations
- Immunocytochemistry [2]
- Other assay [7]
Submit
Validation data
Reference
Comment
Report error
- Product number
- 44-308G - Provider product page

- Provider
- Invitrogen Antibodies
- Product name
- OPRM1 Polyclonal Antibody
- Antibody type
- Polyclonal
- Antigen
- Synthetic peptide
- Reactivity
- Human, Mouse, Rat, Rabbit
- Host
- Rabbit
- Isotype
- IgG
- Vial size
- 100 μL
- Storage
- -20°C
Submitted references Effects of electroacupuncture on pain sensation in a rat model of hyperalgesia with nicotine dependence.
Inhibition of mu-opioid receptor suppresses proliferation of hepatocellular carcinoma cells via CD147-p53-MAPK cascade signaling pathway.
Changes in midbrain pain receptor expression, gait and behavioral sensitivity in a rat model of radiculopathy.
Familial hemiplegic migraine type 1 mutations W1684R and V1696I alter G protein-mediated regulation of Ca(V)2.1 voltage-gated calcium channels.
Quantitative Detection of µ Opioid Receptor: Western Blot Analyses Using µ Opioid Receptor Knockout Mice.
Wang SJ, Zhang YP, Candiotti KA
Neural regeneration research 2022 Apr;17(4):905-910
Neural regeneration research 2022 Apr;17(4):905-910
Inhibition of mu-opioid receptor suppresses proliferation of hepatocellular carcinoma cells via CD147-p53-MAPK cascade signaling pathway.
Zhang JJ, Song CG, Dai JM, Zhang XQ, Lin P, Li L, Yang XM, Chen ZN
American journal of translational research 2021;13(5):3967-3986
American journal of translational research 2021;13(5):3967-3986
Changes in midbrain pain receptor expression, gait and behavioral sensitivity in a rat model of radiculopathy.
Hwang PY, Allen KD, Shamji MF, Jing L, Mata BA, Gabr MA, Huebner JL, Kraus VB, Richardson WJ, Setton LA
The open orthopaedics journal 2012;6:383-91
The open orthopaedics journal 2012;6:383-91
Familial hemiplegic migraine type 1 mutations W1684R and V1696I alter G protein-mediated regulation of Ca(V)2.1 voltage-gated calcium channels.
Garza-López E, Sandoval A, González-Ramírez R, Gandini MA, Van den Maagdenberg A, De Waard M, Felix R
Biochimica et biophysica acta 2012 Aug;1822(8):1238-46
Biochimica et biophysica acta 2012 Aug;1822(8):1238-46
Quantitative Detection of µ Opioid Receptor: Western Blot Analyses Using µ Opioid Receptor Knockout Mice.
Kasai S, Yamamoto H, Kamegaya E, Uhl GR, Sora I, Watanabe M, Ikeda K
Current neuropharmacology 2011 Mar;9(1):219-22
Current neuropharmacology 2011 Mar;9(1):219-22
No comments: Submit comment
Supportive validation
- Submitted by
- Invitrogen Antibodies (provider)
- Main image
- Experimental details
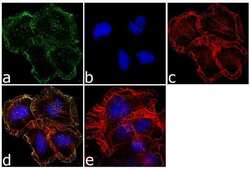
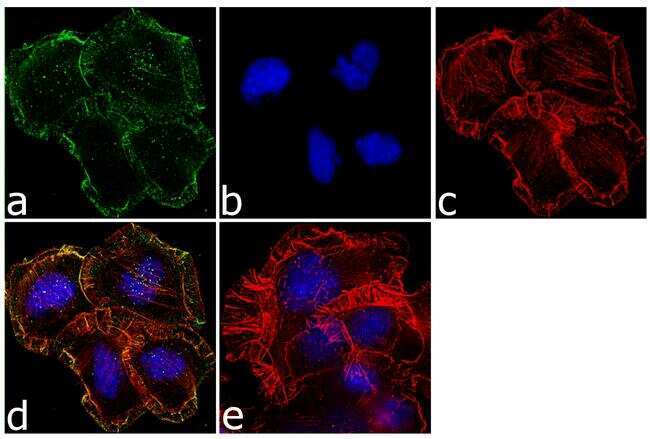
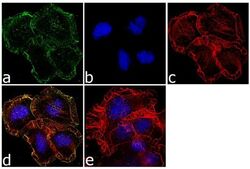
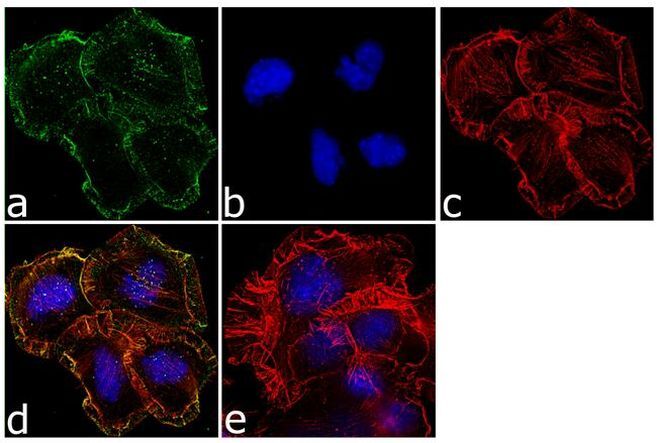
- Immunofluorescence analysis of OPIOID RECEPTOR was performed using 70% confluent log phase Neuro-2A cells. The cells were fixed with 4% paraformaldehyde for 10 minutes, permeabilized with 0.1% Triton™ X-100 for 10 minutes, and blocked with 1% BSA for 1 hour at room temperature. The cells were labeled with OPRM1 Rabbit Polyclonal Antibody (Product # 44-308G) at 1:250 dilution in 0.1% BSA and incubated for 3 hours at room temperature and then labeled with Goat anti-Rabbit IgG (H+L) Superclonal™ Secondary Antibody, Alexa Fluor® 488 conjugate (Product # A27034) at a dilution of 1:2000 for 45 minutes at room temperature (Panel a: green). Nuclei (Panel b: blue) were stained with SlowFade® Gold Antifade Mountant with DAPI (Product # S36938). F-actin (Panel c: red) was stained with Rhodamine Phalloidin (Product # R415, 1:300). Panel d represents the merged image showing membranous localization. Panel e shows the no primary antibody control. The images were captured at 60X magnification.
- Submitted by
- Invitrogen Antibodies (provider)
- Main image
- Experimental details
- Immunofluorescence analysis of OPIOID RECEPTOR was performed using 70% confluent log phase Neuro-2A cells. The cells were fixed with 4% paraformaldehyde for 10 minutes, permeabilized with 0.1% Triton™ X-100 for 10 minutes, and blocked with 1% BSA for 1 hour at room temperature. The cells were labeled with OPRM1 Rabbit Polyclonal Antibody (Product # 44-308G) at 1:250 dilution in 0.1% BSA and incubated for 3 hours at room temperature and then labeled with Goat anti-Rabbit IgG (Heavy Chain) Superclonal™ Secondary Antibody, Alexa Fluor® 488 conjugate (Product # A27034) at a dilution of 1:2000 for 45 minutes at room temperature (Panel a: green). Nuclei (Panel b: blue) were stained with SlowFade® Gold Antifade Mountant with DAPI (Product # S36938). F-actin (Panel c: red) was stained with Rhodamine Phalloidin (Product # R415, 1:300). Panel d represents the merged image showing membranous localization. Panel e shows the no primary antibody control. The images were captured at 60X magnification.
Supportive validation
- Submitted by
- Invitrogen Antibodies (provider)
- Main image
- Experimental details
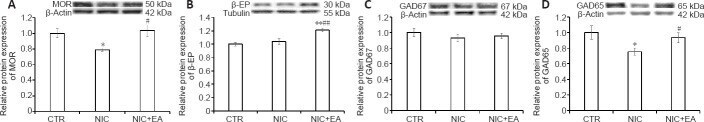
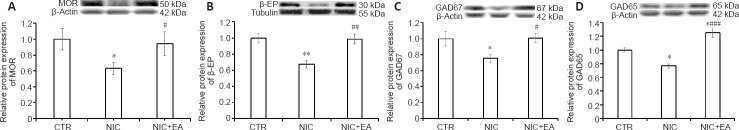
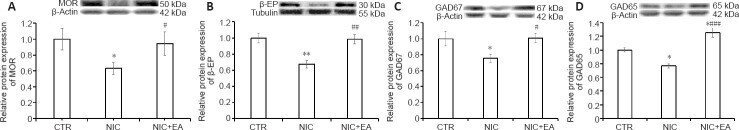
- Figure 4 Electroacupuncture effects on MOR, beta-EP, GAD67, and GAD65 protein expression in the spinal cord of nicotine-induced hyperalgesic rats . (A-D) Western blot analysis of MOR (A), beta-EP (B), GAD67 (C), and GAD65 (D) in the spinal cord of rats in the three groups. Data (mean +- SEM) are presented as relative values to control levels (CTR: n = 6, NIC: n = 6, NIC + EA: n = 6). * P < 0.05, ** P < 0.01, vs . CTR group; # P < 0.05, ## P < 0.01, ### P < 0.001, vs . NIC group (one-way analysis of variance followed by Newman-Keuls multiple comparison test). CTR: Age-matched control group; NIC: nicotine-exposed group; NIC + EA: nicotine-exposed/electroacupuncture-treated group. GAD65: glutamic acid decarboxylase 65; GAD67: glutamic acid decarboxylase 67; MOR: mu-opioid receptor; beta-EP: beta-endorphin.
- Submitted by
- Invitrogen Antibodies (provider)
- Main image
- Experimental details
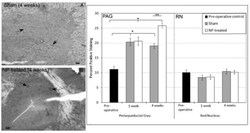
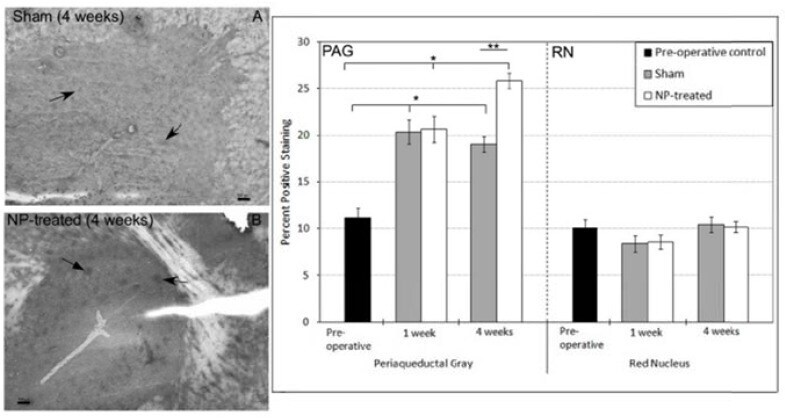
- Fig. (5) Mu-Opioid (u-OR) Receptor Immunostaining: PAG: (left) Representative images of u-OR immunohistochemical images for sham( A ) and NP-treated ( B ) 4 weeks after surgery (dark spots represent positive staining; arrows indicate representative positive staining; scalebar = 100 um). Increased expression was observed in both sham (* p
- Submitted by
- Invitrogen Antibodies (provider)
- Main image
- Experimental details
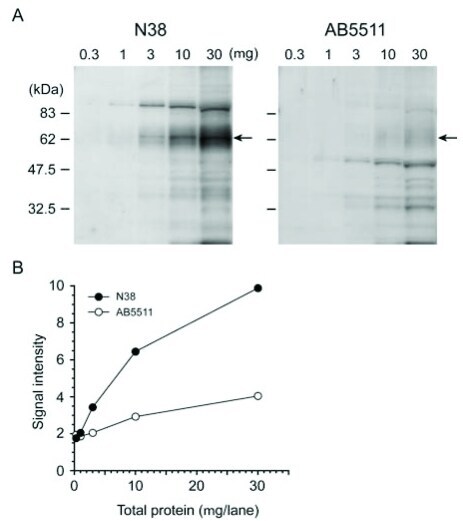
- Fig. (3) Western blot analyses with N38 and AB5511 antibodies for MOP detection in a protein dose-dependent manner. The P2 fractions were isolated from the cortex of adult male C57BL/6J mice. 0.3, 1, 3, 10, and 30 ug of proteins were subjected to SDS-PAGE. Protein blots were reacted with N38 (1:100) and AB5511 (1:5,000) antibodies, followed by reaction with secondary antibody and visualization ( A ). The optical density of migrating bands indicated by arrows around 60-67 kDa was quantified using Image J software ( B ).
- Submitted by
- Invitrogen Antibodies (provider)
- Main image
- Experimental details
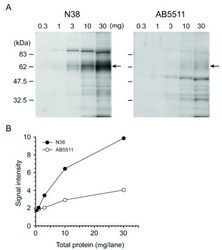
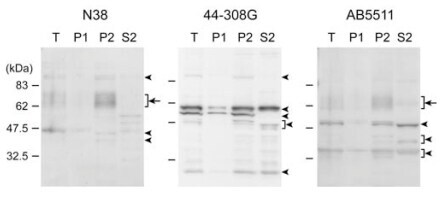
- Fig. (1) Western blot analyses with three anti-MOP antibodies produced against peptides from different MOP regions. Anti-MOP rabbit polyclonal antibodies (N38, 44-308G, and AB5511) were produced against the N -terminus, internal region, and C -terminus of MOP, respectively. Total cortex homogenate (T) from adult male C57BL/6J mice was fractionated to nuclear fraction (P1), cytoplasmic membrane fraction (P2), and cytoplasm fraction (S2) by two-step centrifugation at 800 x g and subsequently 22,000 x g . 10 ug of each fraction was subjected to SDS-PAGE. Protein blots were incubated with anti-MOP antibodies at appropriate dilution (N38, 1:400; 44-308G, 1:5,000; AB5511, 1:20,000), followed by reaction with secondary antibody and visualization.
- Submitted by
- Invitrogen Antibodies (provider)
- Main image

- Experimental details
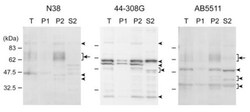
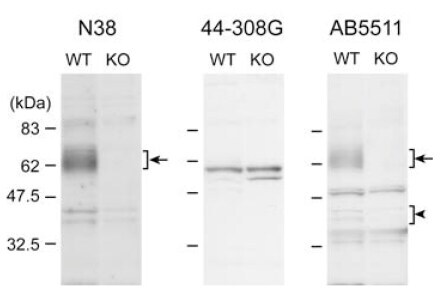
- Fig. (2) Western blot analyses at the P2 fraction derived from wildtype and Oprm1 knockout mice. The P2 fractions were isolated from the cortex of wildtype (WT) and Oprm1 knockout (KO) adult male mice. 10 ug of the P2 fraction from each genotype was subjected to SDS-PAGE. Protein blots were reacted with anti-MOP antibodies at appropriate dilution (N38, 1:400; 44-308G, 1:5,000; AB5511, 1:20,000), followed by reaction with secondary antibody and visualization.
- Submitted by
- Invitrogen Antibodies (provider)
- Main image

- Experimental details
- Figure 4 Electroacupuncture effects on MOR, beta-EP, GAD67, and GAD65 protein expression in the spinal cord of nicotine-induced hyperalgesic rats . (A-D) Western blot analysis of MOR (A), beta-EP (B), GAD67 (C), and GAD65 (D) in the spinal cord of rats in the three groups. Data (mean +- SEM) are presented as relative values to control levels (CTR: n = 6, NIC: n = 6, NIC + EA: n = 6). * P < 0.05, ** P < 0.01, vs . CTR group; # P < 0.05, ## P < 0.01, ### P < 0.001, vs . NIC group (one-way analysis of variance followed by Newman-Keuls multiple comparison test). CTR: Age-matched control group; NIC: nicotine-exposed group; NIC + EA: nicotine-exposed/electroacupuncture-treated group. GAD65: glutamic acid decarboxylase 65; GAD67: glutamic acid decarboxylase 67; MOR: mu-opioid receptor; beta-EP: beta-endorphin.
- Submitted by
- Invitrogen Antibodies (provider)
- Main image
- Experimental details
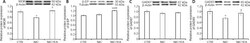
- Figure 5 Electroacupuncture effects on MOR, beta-EP, GAD67, and GAD65 protein expression in the PAG of nicotine-induced hyperalgesic rats . (A-D) Western blot analysis of MOR (A), beta-EP (B), GAD67 (C), and GAD65 (D) in the PAG of rats in the three groups. Data (mean +- SEM) are presented as relative values to control levels (CTR: n = 6, NIC: n = 6, NIC + EA: n = 6). * P < 0.05, ** P < 0.01, vs . CTR group; # P < 0.05, ## P < 0.01, vs . NIC group (one-way analysis of variance followed by Newman-Keuls multiple comparison test). CTR: Age-matched control group; NIC: nicotine-exposed group; NIC + EA: nicotine-exposed/electroacupuncture-treated group. GAD65: glutamic acid decarboxylase 65; GAD67: glutamic acid decarboxylase 67; MOR: mu-opioid receptor; PAG: periaqueductal gray; beta-EP: beta-endorphin.