 Explore
 Validate
 Learn
Learn Western blot
 Other assay
Antibody data
- Antibody Data
- Antigen structure
- References [2]
- Comments [0]
- Validations
- Other assay [1]
Submit
Validation data
Reference
Comment
Report error
- Product number
- PA1-46151 - Provider product page

- Provider
- Invitrogen Antibodies
- Product name
- mGluR1 Polyclonal Antibody
- Antibody type
- Polyclonal
- Antigen
- Synthetic peptide
- Description
- Suggested positive control: human brain lysate, rat dorsal root ganglion, and rat brain (cingulate cortex), antigen standard for GRIN1 (transient overexpression lysate).
- Reactivity
- Human, Mouse, Rat, Chicken/Avian
- Host
- Rabbit
- Isotype
- IgG
- Vial size
- 100 µg
- Concentration
- 1 mg/mL
- Storage
- Store at 4°C short term. For long term storage, store at -20°C, avoiding freeze/thaw cycles.
Submitted references Differential Retinoic Acid Signaling in the Hippocampus of Aged Rats with and without Memory Impairment.
Repeated Galvanic Vestibular Stimulation Modified the Neuronal Potential in the Vestibular Nucleus.
Wołoszynowska-Fraser MU, Rossi SL, Long JM, McCaffery PJ, Rapp PR
eNeuro 2021 Sep-Oct;8(5)
eNeuro 2021 Sep-Oct;8(5)
Repeated Galvanic Vestibular Stimulation Modified the Neuronal Potential in the Vestibular Nucleus.
Kim G, Lee S, Kim KS
Neural plasticity 2020;2020:5743972
Neural plasticity 2020;2020:5743972
No comments: Submit comment
Supportive validation
- Submitted by
- Invitrogen Antibodies (provider)
- Main image
- Experimental details
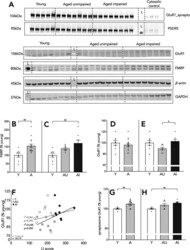
- Figure 6. FMRP expression and cellular and dendritic expression of GluR1 in the hippocampus. Representative blots for proteins of interest ( A ), FMRP expression relative to GAPDH (bottom four panels); cellular GluR1 expression relative to beta-actin, and synaptosome GluR1 levels relative to PSD95 (top two panels); L stands for molecular ladder lane. Cytosolic fraction included as confirmation of the fractionation. Hippocampal expression of FMRP ( B , C ). Whole hippocampus ( D , E ) and synaptosome GluR1 protein levels ( G , H ). Correlation of cytosolic GluR1 protein expression with LI scores ( F ). Results shown as bars with individual animal data plotted. Statistical analysis, unpaired two-tailed Student's t test ( B , D , G ), one-way ANOVA, with Tukey's multiple comparisons test ( C , E , H ), and linear regression ( F ; all animals, gray line; aged animals, black line); C, cytosolic fraction; ** p < 0.01. Y n = 8 and aged n = 16 (AU n = 8, AI n = 8; B-F ); Y n = 5 and aged n = 15 (AU n = 7, AI n = 8; G , H ). Error bars represent SEM.
