Explore
 Validate
 Learn
Learn Western blot
 Immunocytochemistry
Antibody data
- Antibody Data
- Antigen structure
- References [4]
- Comments [0]
- Validations
- Immunocytochemistry [2]
- Flow cytometry [1]
- Other assay [4]
Submit
Validation data
Reference
Comment
Report error
- Product number
- 38-9400 - Provider product page

- Provider
- Invitrogen Antibodies
- Product name
- Aurora C Polyclonal Antibody
- Antibody type
- Polyclonal
- Antigen
- Synthetic peptide
- Reactivity
- Human, Mouse
- Host
- Rabbit
- Isotype
- IgG
- Vial size
- 100 μg
- Concentration
- 0.25 mg/mL
- Storage
- -20°C
Submitted references Aurora-C Interactions with Survivin and INCENP Reveal Shared and Distinct Features Compared with Aurora-B Chromosome Passenger Protein Complex.
Overexpression of active Aurora-C kinase results in cell transformation and tumour formation.
Aurora-B regulates RNA methyltransferase NSUN2.
Anaplastic thyroid carcinoma: expression profile of targets for therapy offers new insights for disease treatment.
Sasai K, Katayama H, Hawke DH, Sen S
PloS one 2016;11(6):e0157305
PloS one 2016;11(6):e0157305
Overexpression of active Aurora-C kinase results in cell transformation and tumour formation.
Khan J, Ezan F, Crémet JY, Fautrel A, Gilot D, Lambert M, Benaud C, Troadec MB, Prigent C
PloS one 2011;6(10):e26512
PloS one 2011;6(10):e26512
Aurora-B regulates RNA methyltransferase NSUN2.
Sakita-Suto S, Kanda A, Suzuki F, Sato S, Takata T, Tatsuka M
Molecular biology of the cell 2007 Mar;18(3):1107-17
Molecular biology of the cell 2007 Mar;18(3):1107-17
Anaplastic thyroid carcinoma: expression profile of targets for therapy offers new insights for disease treatment.
Wiseman SM, Masoudi H, Niblock P, Turbin D, Rajput A, Hay J, Bugis S, Filipenko D, Huntsman D, Gilks B
Annals of surgical oncology 2007 Feb;14(2):719-29
Annals of surgical oncology 2007 Feb;14(2):719-29
No comments: Submit comment
Supportive validation
- Submitted by
- Invitrogen Antibodies (provider)
- Main image
- Experimental details
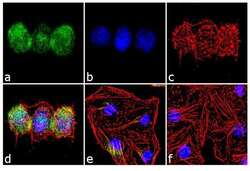
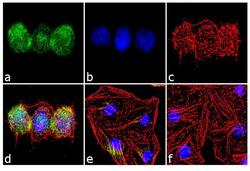
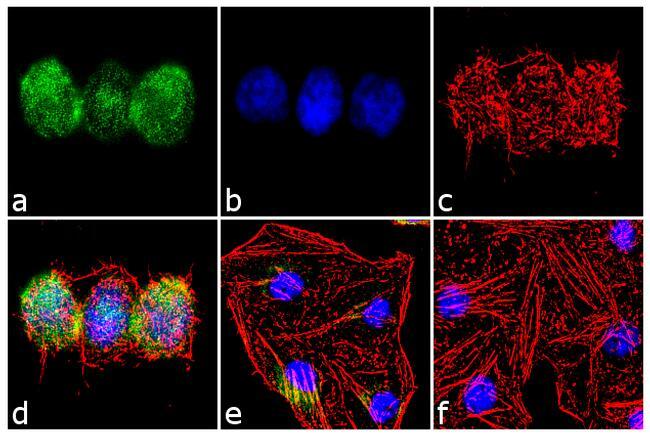
- Immunofluorescence analysis of Aurora C was performed using 70% confluent log phase HeLa cells treated with 3 uM of Nocodazole for 24 hours. The cells were fixed with 4% paraformaldehyde for 10 minutes, permeabilized with 0.1% Triton™ X-100 for 10 minutes, and blocked with 2% BSA for 1 hour at room temperature. The cells were labeled with Aurora C Rabbit Polyclonal Antibody (Product # 38-9400) at 2 µg/mL in 0.1% BSA and incubated for 3 hours at room temperature and then labeled with Goat anti-Rabbit IgG (H+L) Superclonal™ Secondary Antibody, Alexa Fluor® 488 conjugate (Product # A27034) a dilution of 1:2000 for 45 minutes at room temperature (Panel a: green). Nuclei (Panel b: blue) were stained with SlowFade® Gold Antifade Mountant with DAPI (Product # S36938). F-actin (Panel c: red) was stained with Alexa Fluor® 555 Rhodamine Phalloidin (Product # R415, 1:300). Panel d represents the merged image showing nuclear localization. Panel e shows untreated cells with less signal. Panel f represents control cells with no primary antibody to assess background. The images were captured at 60X magnification.
- Submitted by
- Invitrogen Antibodies (provider)
- Main image
- Experimental details
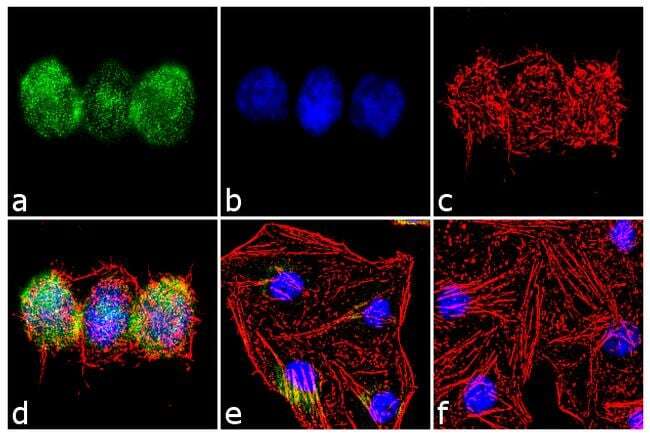
- Immunofluorescence analysis of Aurora C was performed using 70% confluent log phase HeLa cells treated with 3 uM of Nocodazole for 24 hours. The cells were fixed with 4% paraformaldehyde for 10 minutes, permeabilized with 0.1% Triton™ X-100 for 10 minutes, and blocked with 2% BSA for 1 hour at room temperature. The cells were labeled with Aurora C Rabbit Polyclonal Antibody (Product # 38-9400) at 2 µg/mL in 0.1% BSA and incubated for 3 hours at room temperature and then labeled with Goat anti-Rabbit IgG (Heavy Chain) Superclonal™ Secondary Antibody, Alexa Fluor® 488 conjugate (Product # A27034) a dilution of 1:2000 for 45 minutes at room temperature (Panel a: green). Nuclei (Panel b: blue) were stained with SlowFade® Gold Antifade Mountant with DAPI (Product # S36938). F-actin (Panel c: red) was stained with Alexa Fluor® 555 Rhodamine Phalloidin (Product # R415, 1:300). Panel d represents the merged image showing nuclear localization. Panel e shows untreated cells with less signal. Panel f represents control cells with no primary antibody to assess background. The images were captured at 60X magnification.
Supportive validation
- Submitted by
- Invitrogen Antibodies (provider)
- Main image

- Experimental details
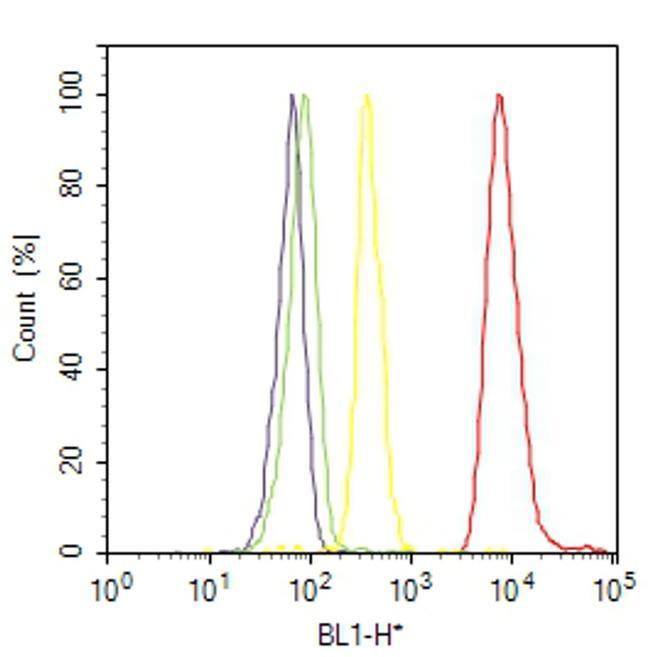
- Flow cytometry analysis of Aurora C was done on HeLa cells. Cells were fixed with 70% ethanol for 10 minutes, permeabilized with 0.25% Triton™ X-100 for 20 minutes, and blocked with 5% BSA for 30 minutes at room temperature. Cells were labeled with Aurora C Rabbit Polyclonal Antibody (389400, red histogram) or with rabbit isotype control (yellow histogram) at 3-5 ug/million cells in 2.5% BSA. After incubation at room temperature for 2 hours, the cells were labeled with Alexa Fluor® 488 Goat Anti-Rabbit Secondary Antibody (A11008) at a dilution of 1:400 for 30 minutes at room temperature. The representative 10,000 cells were acquired and analyzed for each sample using an Attune® Acoustic Focusing Cytometer. The purple histogram represents unstained control cells and the green histogram represents no-primary-antibody control.
Supportive validation
- Submitted by
- Invitrogen Antibodies (provider)
- Main image
- Experimental details
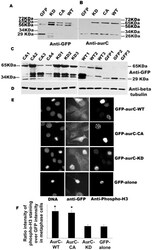
- Figure 1 Expression and activity of GFP-Aurora-C in transiently transfected cells and in stable cell lines. ( A-B ) NIH-3T3 cells were transfected with GFP-aurC-WT (Aurora-C-wild type), GFP-aurC-CA (Aurora-C-T191D, constitutively active), GFP-aurC-KD (Aurora-C-K72R, kinase dead) and GFP-alone plasmids. Proteins were extracted 24 hours after transfection and immunoprecipitated with mouse anti-GFP (A) and polyclonal rabbit anti-Aurora-C (B) antibodies. Western blots were revealed using (A) mouse Anti-GFP antibody and (B) polyclonal rabbit Anti-Aurora-C antibody and showed level of expression of GFP-aurC at about 65 kDa and GFP-alone at 29 kDa. ( C-D ) Western blots showed the level of expression of GFP-aurC protein in stable NIH-3T3 clones of GFP-aurC-KD (KD1 to KD3), GFP-aurC-CA (CA1 to CA4), GFP-aurC-WT (WT1 to WT3) and GFP-alone (GFP1 to GFP3) illustrating the different level of expression of GFP-aurC and GFP proteins by different clones. The antibodies were ( C ) mouse anti-GFP and ( D ) anti-beta tubulin antibody for loading control. ( E ) Immunofluorescence was performed on stable cell clones overexpressing GFP-aurC-WT, GFP-aurC-CA, GFP-aurC-KD and GFP-alone plasmids. Cells were stained with rabbit anti-phospho histone H3 ser-10 then anti-rabbit Alexa-555 and DAPI. The left column shows DAPI stained cells and the right column shows phosphorylated Histone-H3 ser-10 cells. (F) Histogram shows the ratio of H3-staining intensity (arbitrary unit from ImageJ) over GFP intensity

- Submitted by
- Invitrogen Antibodies (provider)
- Main image
- Experimental details
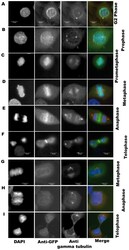
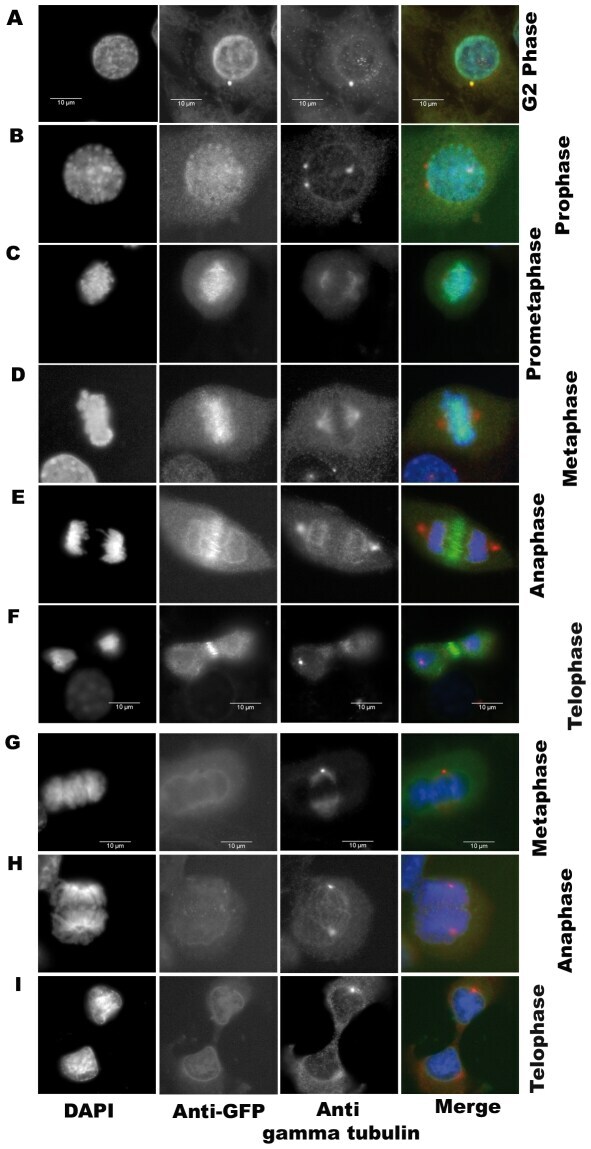
- Figure 2 Subcellular localization of GFP-Aurora C along cell cycle. Immunofluorescence was performed on stable cell clones overexpressing GFP-aurC-WT, GFP-aurC-CA, GFP-aurC-KD and GFP-alone plasmids. Cells were stained with DAPI, anti-GFP and anti-gamma-tubulin antibodies. The immunoflorescent microscopy images show the localization of ( A-F ) GFP-aurC-WT and ( G-I ) GFP-alone. Localization of GFP-aurC-WT at ( A ) centrosome in G2 phase, ( B ) chromosomes/centromeres in prophase, ( C ) chromosomes in prometaphase, ( D ) chromosomes in metaphase, ( E ) the midzone of spindles in anaphase, ( F ) midbody in telophase. ( G-I ) Localization of GFP-alone in ( G ) metaphase, ( H ) anaphase, and ( I ) telophase. The original magnification used was 63x.
- Submitted by
- Invitrogen Antibodies (provider)
- Main image
- Experimental details
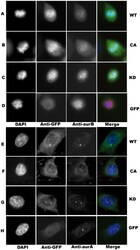
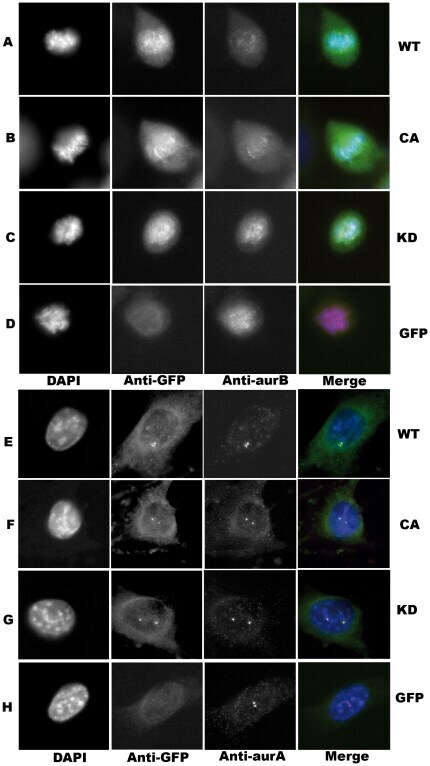
- Figure 3 Localization of endogenous Aurora-A and Aurora-B in cell line overexpressing GFP-aurC. Immunofluorescence was performed on stable cell clones overexpressing GFP-aurC-WT, GFP-aurC-CA, GFP-aurC-KD and GFP-alone plasmids. Cells were stained with DAPI, anti-GFP, and anti-Aurora-B antibodies ( A-D ) or anti-Aurora-A antibodies ( E-H ). The immunoflorescent microscopy images show also the localization of ( A, E ) GFP-aurC-WT, ( B, F ) GFP-aurC-CA, ( C, G ) GFP-aurC-KD and ( D, H ) GFP-alone during metaphase ( A-D ) or interphase ( E-F ). The original magnification used was 63x.
- Submitted by
- Invitrogen Antibodies (provider)
- Main image

- Experimental details
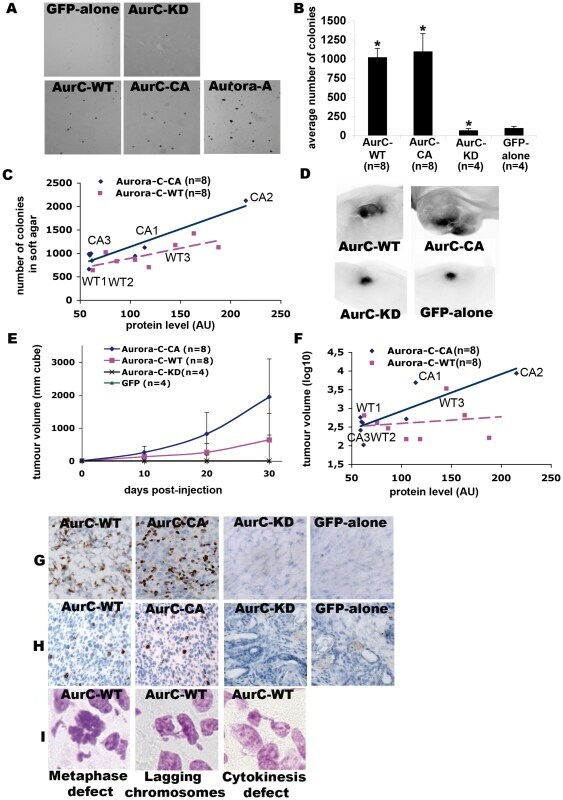
- Figure 5 Cell growth in soft agar and tumour formation correlated with the quantity of active Aurora-C. ( A-C ) Stable cell clones of GFP-aurC-WT (n = 9), GFP-aurC-CA (n = 9), GFP-aurC-KD (n = 4), GFP-alone (n = 4) and GFP-AurA (n = 2) were tested in a soft agar growth assay. ( A ) Foci of colonies of GFP-aurC-WT, GFP-aurC-CA and GFP-aurA stable cell lines and very negligible number of very small colonies of GFP-aurC-KD and GFP-alone cell lines. ( B ) Histogram of the average number of colonies. We performed non-parametric Mann-Whitney test. Results were considered as statistically significant (*) for a p-value under 0.05 when compared to GFP-alone condition. ( C ) The dot blot shows a positive correlation between protein expression level of GFP-aurC-WT and GFP-aurC-CA, quantified for each clone on immunoblot by ImageJ, and the number of colonies in soft agar. Full line and dotted line are linear regression for GFP-AurC-CA and GFP-AurC-WT respectively. The label of the cell lines are named after in Figure 1C . ( D-I ) Female immunocompromized mice (SWISS, nu/nu) were injected subcutaneously in the abdomen. We injected GFP-aurC-WT (n = 8 clones), GFP-aurC-CA (n = 8), GFP-aurC-KD (n = 4), and GFP-alone (n = 4) cell lines. ( D ) Visualization of the tumours formed by injecting GFP-aurC-WT and GFP-aurC-CA stable cell lines, and the remaining injected cells of GFP-aurC-KD and GFP-alone on the day of sacrifice. For these images, the cell line injected were WT3, CA2, KD2 and GFP2 ce