 Explore
 Validate
 Learn
Learn700366
antibody from Invitrogen Antibodies
Targeting: DDX58
DKFZp434J1111, FLJ13599, RIG-1, RIG-I, RIG1
 Western blot
Antibody data
- Antibody Data
- Antigen structure
- References [1]
- Comments [0]
- Validations
- Western blot [2]
- Immunocytochemistry [1]
- Immunohistochemistry [1]
- Other assay [3]
Submit
Validation data
Reference
Comment
Report error
- Product number
- 700366 - Provider product page

- Provider
- Invitrogen Antibodies
- Product name
- RIG-I Recombinant Rabbit Monoclonal Antibody (35H2L48)
- Antibody type
- Monoclonal
- Antigen
- Recombinant full-length protein
- Reactivity
- Human, Mouse
- Host
- Rabbit
- Isotype
- IgG
- Antibody clone number
- 35H2L48
- Vial size
- 100 µg
- Concentration
- 0.5 mg/mL
- Storage
- Store at 4°C short term. For long term storage, store at -20°C, avoiding freeze/thaw cycles.
Submitted references Klotho deficiency intensifies hypoxia-induced expression of IFN-α/β through upregulation of RIG-I in kidneys.
Urabe A, Doi S, Nakashima A, Ike T, Morii K, Sasaki K, Doi T, Arihiro K, Masaki T
PloS one 2021;16(10):e0258856
PloS one 2021;16(10):e0258856
No comments: Submit comment
Supportive validation
- Submitted by
- Invitrogen Antibodies (provider)
- Main image

- Experimental details
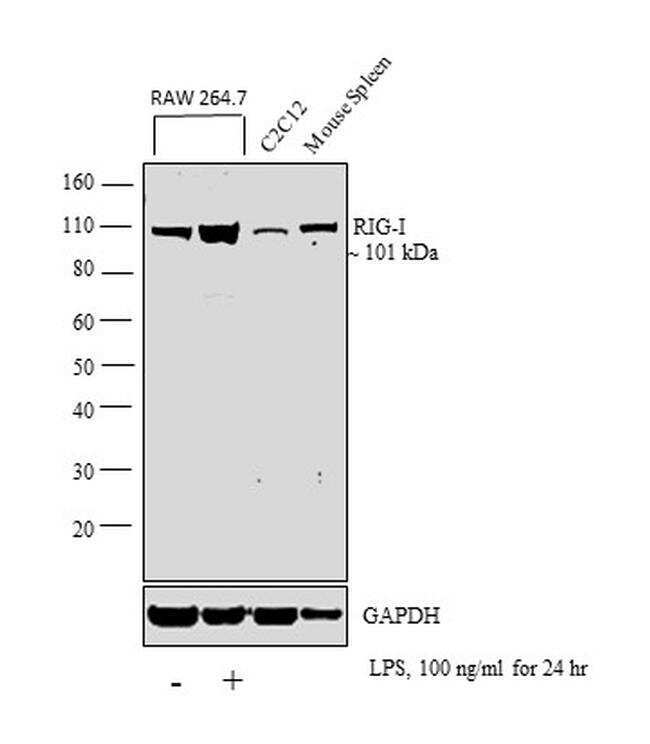
- Western blot analysis was performed on whole cell extracts (30 µg lysate) of RAW 264.7 (Lane 1), RAW 264.7 treated with LPS (100ng/ml for 24 h) (Lane 2), C2C12 (Lane 3) and tissue extract of Mouse Spleen (Lane 4). The blot was probed with Anti- RIG-I Antibody (35H2L48) (Product # 700366, 1 µg/mL) and detected by chemiluminescence using Goat anti-Rabbit IgG (H+L) Superclonal™ Secondary Antibody, HRP conjugate (Product # A27036, 0.25 µg/mL, 1:4000 dilution). A 101 kDa band corresponding to RIG-I was observed in the cell lines and tissue tested and was enhanced upon LPS treatment in RAW 264.7 cell line.
- Submitted by
- Invitrogen Antibodies (provider)
- Main image

- Experimental details
- Western blot analysis of RIG-I in FLAG-tagged RIG-I in transfected 293 lysates (lane 2) and anti-FLAG used as a control (lane 1) using a RIG-I recombinant rabbit monoclonal antibody (Product # 700366) at a dilution of 4 µg/mL.

Supportive validation
- Submitted by
- Invitrogen Antibodies (provider)
- Main image
- Experimental details
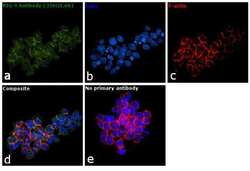
- Immunofluorescence analysis of RIG-I was performed using 70% confluent log phase Jurkat cells. The cells were fixed with 4% paraformaldehyde for 10 minutes, permeabilized with 0.1% Triton™ X-100 for 15 minutes, and blocked with 1% BSA for 1 hour at room temperature. The cells were labeled with RIG-I Antibody (35H2L48), Recombinant Rabbit Monoclonal (Product # 700366) at 5 µg/mL concentration in 0.1% BSA, incubated at 4 degree celsius overnight and then labeled with Goat anti-Rabbit IgG (H+L) Superclonal™ Secondary Antibody, Alexa Fluor® 488 conjugate (Product # A27034) at a dilution of 1:2000 for 45 minutes at room temperature (Panel a: green). Nuclei (Panel b: blue) were stained with SlowFade® Gold Antifade Mountant with DAPI (Product # S36938). F-actin (Panel c: red) was stained with Rhodamine Phalloidin (Product # R415, 1:300). Panel d represents the merged image showing cytoplasm localization. Panel e represents control cells with no primary antibody to assess background. The images were captured at 60X magnification.

Supportive validation
- Submitted by
- Invitrogen Antibodies (provider)
- Main image

- Experimental details
- Immunohistochemistry analysis of RIG-1 showing staining in the cytoplasm of paraffin-embedded human spleen tissue (right) compared to a negative control without primary antibody (left). To expose target proteins, antigen retrieval was performed using 10mM sodium citrate (pH 6.0), microwaved for 8-15 min. Following antigen retrieval, tissues were blocked in 3% H2O2-methanol for 15 min at room temperature, washed with ddH2O and PBS, and then probed with a RIG-1 Recombinant Rabbit Monoclonal Antibody (Product # 700366) diluted in 3% BSA-PBS at a dilution of 1:20 for 1 hour at 37ºC in a humidified chamber. Tissues were washed extensively in PBST and detection was performed using an HRP-conjugated secondary antibody followed by colorimetric detection using a DAB kit. Tissues were counterstained with hematoxylin and dehydrated with ethanol and xylene to prep for mounting.

Supportive validation
- Submitted by
- Invitrogen Antibodies (provider)
- Main image

- Experimental details
- 10.1371/journal.pone.0258856.g001 Fig 1 Hypoxia enhances expression of RIG-I and IFN-alpha/beta in a rat cell line of epithelial cells of renal tubules. NRK-52E cells were incubated under hypoxic conditions (1.0% O 2 ) for 30, 60, 90, and 120 min. Cell lysates were subjected to western blot analysis using antibodies against RIG-I and IFN-alpha/beta. Typical western blot analysis demonstrated the expression levels of RIG-I (A) and IFN-alpha/beta (B and C). Graphs show the expression levels quantified by densitometry and normalized to alpha-tubulin (n = 5 in each group). Values are expressed as the mean +- SD. Statistical analysis was performed using ANOVA followed by Tukey's post hoc test. * P < 0.05, ** P < 0.01.

- Submitted by
- Invitrogen Antibodies (provider)
- Main image

- Experimental details
- 10.1371/journal.pone.0258856.g002 Fig 2 RIG-I siRNA transfection attenuates expression of IFN-alpha/beta in NRK-52E cells cultured under hypoxic conditions. NRK-52E cells were transfected with RIG-I siRNA or negative control siRNA. Cell lysates were subjected to western blot analysis using antibodies against RIG-I and IFN-alpha/beta. Typical western blot analysis demonstrated the expression levels of RIG-I (A) and IFN-alpha/beta (B and C). Graphs show the expression levels quantified by densitometry and normalized to alpha-tubulin (n = 5 in each group). Values are expressed as the mean +- SD. Statistical analysis was performed using ANOVA followed by Tukey's post hoc test. * P < 0.05, ** P < 0.01.

- Submitted by
- Invitrogen Antibodies (provider)
- Main image

- Experimental details
- 10.1371/journal.pone.0258856.g005 Fig 5 RIG-I expression is intensified under hypoxic conditions in Kl -/- mice. (A) Western blot analysis demonstrating RIG-I expression in WT and Kl -/- mice. Protein levels were normalized to beta-actin levels (n = 5 in each group). (B) Representative immunohistochemical staining images showing expression and localization of RIG-I in WT and Kl -/- mice. Values are mean +- SD. * P < 0.05, ** P < 0.01. Bar = 100 mum.
