Explore
 Validate
 Learn
Learn Flow cytometry
Antibody data
- Antibody Data
- Antigen structure
- References [13]
- Comments [0]
- Validations
- Flow cytometry [1]
- Other assay [12]
Submit
Validation data
Reference
Comment
Report error
- Product number
- 50-7108-42 - Provider product page

- Provider
- Invitrogen Antibodies
- Product name
- IL-10 Monoclonal Antibody (JES3-9D7), eFluor™ 660, eBioscience™
- Antibody type
- Monoclonal
- Antigen
- Other
- Description
- Description: The JES3-9D7 monoclonal antibody reacts with human interleukin-10 (IL-10). Applications Reported: This JES3-9D7 antibody has been reported for use in flow cytometric analysis, and intracellular staining followed by flow cytometric analysis. Applications Tested: This JES3-9D7 antibody has been pre-titrated and tested by intracellular staining anf flow cytometryci analysis of Th2 polarized and stimulated human peripheral blood cells. This can be used at 5 µL (0.125 µg) per test. A test is defined as the amount (µg) of antibody that will stain a cell sample in a final volume of 100 µL. Cell number should be determined empirically but can range from 10^5 to 10^8 cells/test. eFluor® 660 is a replacement for Alexa Fluor® 647. eFluor® 660 emits at 659 nm and is excited with the red laser (633 nm). Please make sure that your instrument is capable of detecting this fluorochome. Excitation: 633-647 nm; Emission: 668 nm; Laser: Red Laser. Filtration: 0.2 µm post-manufacturing filtered.
- Reactivity
- Human
- Host
- Rat
- Isotype
- IgG
- Antibody clone number
- JES3-9D7
- Vial size
- 100 Tests
- Concentration
- 5 µL/Test
- Storage
- 4° C, store in dark, DO NOT FREEZE!
Submitted references Early loss of T lymphocyte 4-1BB receptor expression is associated with higher short-term mortality in alcoholic hepatitis.
Cysticercus cellulosae Regulates T-Cell Responses and Interacts With the Host Immune System by Excreting and Secreting Antigens.
Induction of cytotoxic effector cells towards cholangiocellular, pancreatic, and colorectal tumor cells by activation of the immune checkpoint CD40/CD40L on dendritic cells.
CAIX Regulates GBM Motility and TAM Adhesion and Polarization through EGFR/STAT3 under Hypoxic Conditions.
Multiple Sclerosis-Associated Changes in the Composition and Immune Functions of Spore-Forming Bacteria.
Heterologous Immunity between Adenoviruses and Hepatitis C Virus: A New Paradigm in HCV Immunity and Vaccines.
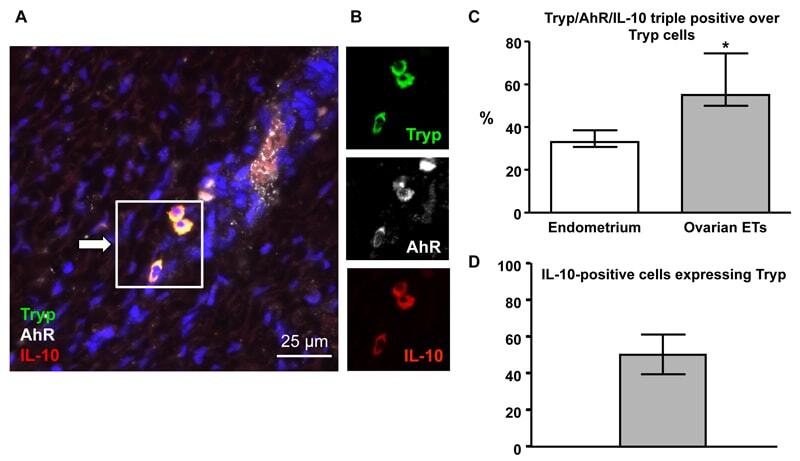
Functional expression of aryl hydrocarbon receptor on mast cells populating human endometriotic tissues.
The regulation of cancer cell migration by lung cancer cell-derived exosomes through TGF-β and IL-10.
Follicular regulatory T cells impair follicular T helper cells in HIV and SIV infection.
Granzyme B production distinguishes recently activated CD8(+) memory cells from resting memory cells.
Mycobacterium bovis BCG attenuates surface expression of mature class II molecules through IL-10-dependent inhibition of cathepsin S.
Mycobacterium bovis BCG attenuates surface expression of mature class II molecules through IL-10-dependent inhibition of cathepsin S.
Role of the phosphatidylinositol 3 kinase-Akt pathway in the regulation of IL-10 and IL-12 by Porphyromonas gingivalis lipopolysaccharide.
Eriksen LL, Nielsen MA, Laursen TL, Deleuran B, Vilstrup H, Støy S
PloS one 2021;16(8):e0255574
PloS one 2021;16(8):e0255574
Cysticercus cellulosae Regulates T-Cell Responses and Interacts With the Host Immune System by Excreting and Secreting Antigens.
Fan X, Zhang Y, Ouyang R, Luo B, Li L, He W, Liu M, Jiang N, Yang F, Wang L, Zhou B
Frontiers in cellular and infection microbiology 2021;11:728222
Frontiers in cellular and infection microbiology 2021;11:728222
Induction of cytotoxic effector cells towards cholangiocellular, pancreatic, and colorectal tumor cells by activation of the immune checkpoint CD40/CD40L on dendritic cells.
Sadeghlar F, Vogt A, Mohr RU, Mahn R, van Beekum K, Kornek M, Weismüller TJ, Branchi V, Matthaei H, Toma M, Schmidt-Wolf IGH, Kalff JC, Strassburg CP, González-Carmona MA
Cancer immunology, immunotherapy : CII 2021 May;70(5):1451-1464
Cancer immunology, immunotherapy : CII 2021 May;70(5):1451-1464
CAIX Regulates GBM Motility and TAM Adhesion and Polarization through EGFR/STAT3 under Hypoxic Conditions.
Huang BR, Liu YS, Lai SW, Lin HJ, Shen CK, Yang LY, Lu DY
International journal of molecular sciences 2020 Aug 14;21(16)
International journal of molecular sciences 2020 Aug 14;21(16)
Multiple Sclerosis-Associated Changes in the Composition and Immune Functions of Spore-Forming Bacteria.
Cekanaviciute E, Pröbstel AK, Thomann A, Runia TF, Casaccia P, Katz Sand I, Crabtree E, Singh S, Morrissey J, Barba P, Gomez R, Knight R, Mazmanian S, Graves J, Cree BAC, Zamvil SS, Baranzini SE
mSystems 2018 Nov-Dec;3(6)
mSystems 2018 Nov-Dec;3(6)
Heterologous Immunity between Adenoviruses and Hepatitis C Virus: A New Paradigm in HCV Immunity and Vaccines.
Singh S, Vedi S, Samrat SK, Li W, Kumar R, Agrawal B
PloS one 2016;11(1):e0146404
PloS one 2016;11(1):e0146404
Functional expression of aryl hydrocarbon receptor on mast cells populating human endometriotic tissues.
Mariuzzi L, Domenis R, Orsaria M, Marzinotto S, Londero AP, Bulfoni M, Candotti V, Zanello A, Ballico M, Mimmi MC, Calcagno A, Marchesoni D, Di Loreto C, Beltrami AP, Cesselli D, Gri G
Laboratory investigation; a journal of technical methods and pathology 2016 Sep;96(9):959-971
Laboratory investigation; a journal of technical methods and pathology 2016 Sep;96(9):959-971
The regulation of cancer cell migration by lung cancer cell-derived exosomes through TGF-β and IL-10.
Wang Y, Yi J, Chen X, Zhang Y, Xu M, Yang Z
Oncology letters 2016 Feb;11(2):1527-1530
Oncology letters 2016 Feb;11(2):1527-1530
Follicular regulatory T cells impair follicular T helper cells in HIV and SIV infection.
Miles B, Miller SM, Folkvord JM, Kimball A, Chamanian M, Meditz AL, Arends T, McCarter MD, Levy DN, Rakasz EG, Skinner PJ, Connick E
Nature communications 2015 Oct 20;6:8608
Nature communications 2015 Oct 20;6:8608
Granzyme B production distinguishes recently activated CD8(+) memory cells from resting memory cells.
Nowacki TM, Kuerten S, Zhang W, Shive CL, Kreher CR, Boehm BO, Lehmann PV, Tary-Lehmann M
Cellular immunology 2007 May;247(1):36-48
Cellular immunology 2007 May;247(1):36-48
Mycobacterium bovis BCG attenuates surface expression of mature class II molecules through IL-10-dependent inhibition of cathepsin S.
Sendide K, Deghmane AE, Pechkovsky D, Av-Gay Y, Talal A, Hmama Z
Journal of immunology (Baltimore, Md. : 1950) 2005 Oct 15;175(8):5324-32
Journal of immunology (Baltimore, Md. : 1950) 2005 Oct 15;175(8):5324-32
Role of the phosphatidylinositol 3 kinase-Akt pathway in the regulation of IL-10 and IL-12 by Porphyromonas gingivalis lipopolysaccharide.
Martin M, Schifferle RE, Cuesta N, Vogel SN, Katz J, Michalek SM
Journal of immunology (Baltimore, Md. : 1950) 2003 Jul 15;171(2):717-25
Journal of immunology (Baltimore, Md. : 1950) 2003 Jul 15;171(2):717-25
No comments: Submit comment
Supportive validation
- Submitted by
- Invitrogen Antibodies (provider)
- Main image
- Experimental details
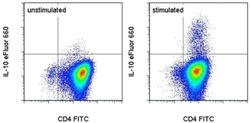
- CD4+ human peripheral blood cells were polarized under Th2 conditions then were unstimulated (left) or stimulated for 5 hours with Cell Stimulation Cocktail (plus protein transport inhibitors) (Product # 00-4975-03). Cells were intracellularly stained with Anti-Human CD4 FITC (Product # 11-0049-42) and Anti-Human IL-10 eFluor® 660 using the Fixation & Permeabilization Buffers (Product # 88-8824-00). Total viable cells were used for analysis.

Supportive validation
- Submitted by
- Invitrogen Antibodies (provider)
- Main image
- Experimental details
- NULL

- Submitted by
- Invitrogen Antibodies (provider)
- Main image
- Experimental details
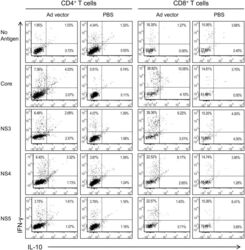
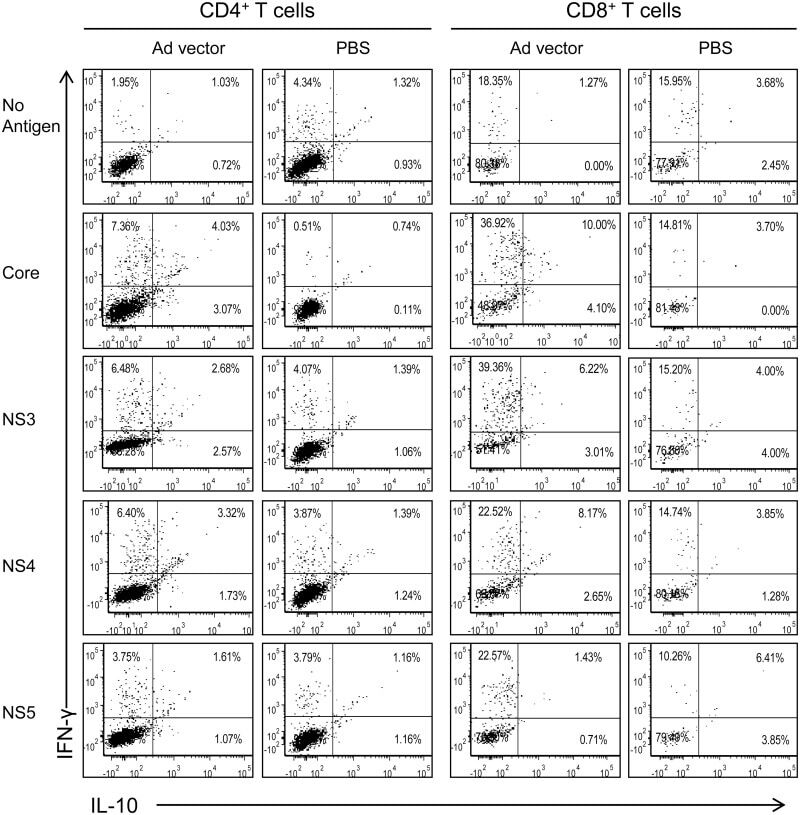
- Fig 4 Cross-reactive CD4 + and CD8 + T cells obtained from Ad vector immunized mice produce cytokines upon ex vivo stimulation with various HCV proteins. Splenocytes obtained from Ad vector immunized mice were cultured with HCV core, NS3, NS4 or NS5 antigens at 5 mug/ml, and analyzed after 5 days for intracellular IFN-gamma and IL-10 expression profile of CD4 + and CD8 + T cells by flow cytometry. Data are obtained from a pool (n = 5) of spleen cells and are representative of two independent experiments.
- Submitted by
- Invitrogen Antibodies (provider)
- Main image
- Experimental details
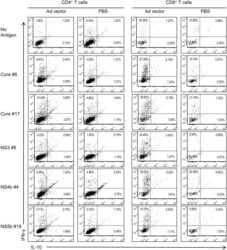
- Fig 5 Cross-reactive CD4 + and CD8 + T cells obtained from Ad vector immunized mice produce cytokines upon ex vivo stimulation with HCV peptides. Splenocytes obtained from Ad vector immunized mice were cultured with representative peptides derived from HCV core, NS3, NS4 or NS5 at 5 mug/ml each, and analyzed after 5 days for intracellular IFN-gamma and IL-10 expression profile of CD4 + and CD8 + T cells by flow cytometry. Data are obtained from a pool (n = 5) of spleen cells and are representative of two independent experiments.
- Submitted by
- Invitrogen Antibodies (provider)
- Main image

- Experimental details
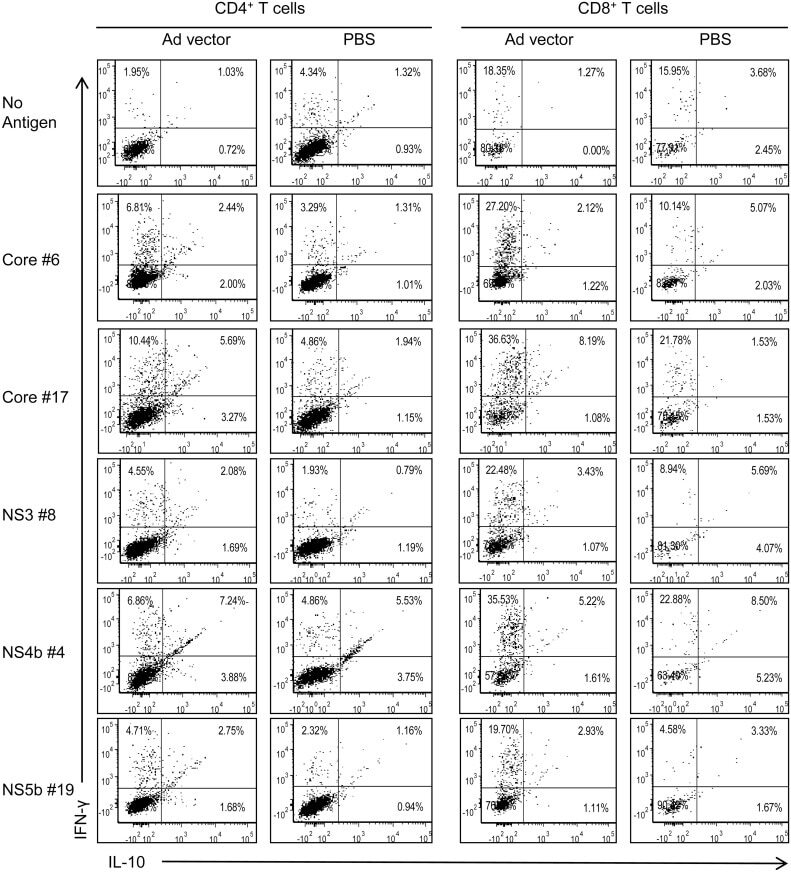
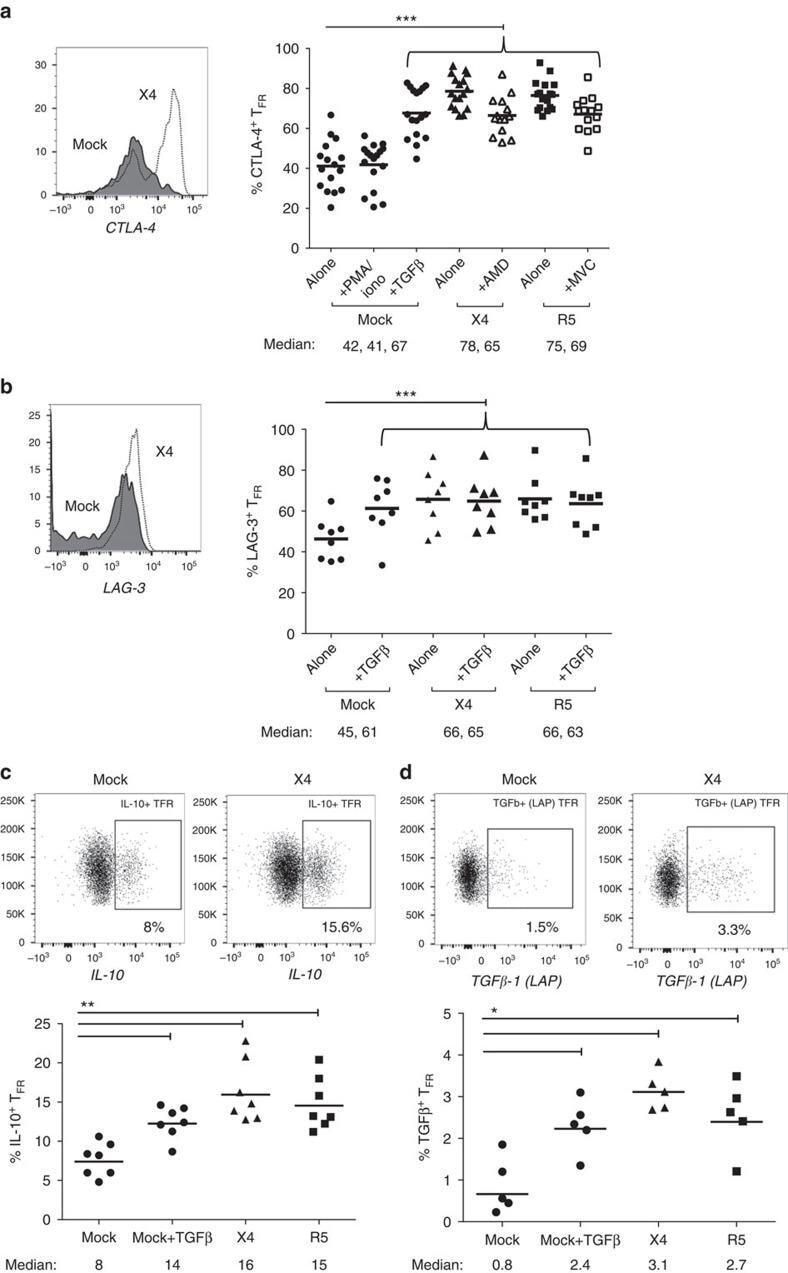
- Figure 6 T FR exhibit an enhanced regulatory phenotype in ex vivo HIV infection. Tonsil cells were mock-, X4-, or R5-spinoculated and cultured under experimental conditions as indicated. T FR were then analysed for expression of regulatory receptors and cytokine production by intracellular cytokine staining. ( a ) Percentage of total (surface and intracellular) T FR CTLA-4 expression ( n =15). ( b ) Percentage of surface T FR LAG-3 expression ( n =8). ( c ) Production of IL-10 by T FR ( n =7). ( d ) Production of TGF-beta-1 (measured as LAP) by T FR ( n =5). The horizontal bars of each graph indicate the median value and are listed where appropriate for clarity. Statistical analyses were performed by Friedman ( a , b ) or Mann-Whitney tests ( c , d ) and significance is denoted by asterisks where * P
- Submitted by
- Invitrogen Antibodies (provider)
- Main image

- Experimental details
- Figure 5 AhR-positive MCs express the tolerogenic IL-10 cytokine in ETs. ( A ) Immunofluorescence triple staining showing that several tryptase-expressing MCs (Tryp, green) co-express both AhR (white) and IL-10 (red) (arrows). Scale bar, 25 um. ( B ) A higher magnification view of the boxed area in (A) comparing uncoupled fluorescence micrographs of three MCs. ( C ) The percentage of triple-positive cells among tryptase-expressing MCs in 10 individual control and ET samples is shown. Cells were detected and counted from ten x400 high-power microscopic fields in each sample. Endometrium median 33% (IQR 31-37%); ovarian median 55% (IQR 53-73%). * p
- Submitted by
- Invitrogen Antibodies (provider)
- Main image

- Experimental details
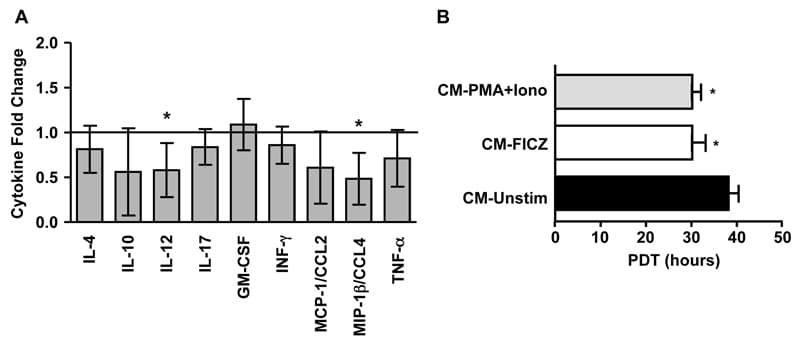
- Figure 6 (A) Ovarian ET cytokine expression upon treatment with an AhR antagonist. IL-4, IL-10, IL-12, IL-17, GM-CSF, IFN- , MCP-1/CCL2, MIP-1 /CCL4 and TNF-alpha protein expression in supernatants of untreated (control) or ANF-treated ovarian ET cultures measured by ELISA 48 hr after exposure to the AhR-antagonist ANF (15 uM). Control protein concentration was assigned a value of 1 and is illustrated as a horizontal line for presentation purposes. Sample size was 4 patients/group. The values are the mean and 95% confidence intervals. * p
- Submitted by
- Invitrogen Antibodies (provider)
- Main image
- Experimental details
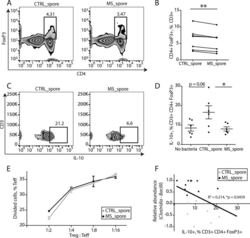
- FIG 2 Spore-forming bacteria from MS patients inhibit IL-10 + Treg differentiation in vitro . (A and B) Representative flow cytometry plots (A) and quantification (B) of CD4 + FoxP3 + Tregs within CD3 + lymphocytes differentiated in response to spore-forming bacteria isolated from controls or untreated MS patients. n = 7 PBMC donors; each dot represents an average response from PBMC donor to isolates from 6 control or MS bacterial donors. * * , P < 0.01, two-tailed repeated measures t test. (C and D) Representative flow cytometry plots (C) and quantification (D) of IL-10 + lymphocyte population within CD3 + CD4 + FoxP3 + Tregs differentiated in response to spore-forming bacteria isolated from controls or untreated MS patients. n = 6 bacterial donors per group. * , P < 0.05, two-tailed t test. Error bars, mean +- SEM. The experiment was repeated with nonoverlapping PBMC and bacterial donors and gave the same results. (E) Quantification of T effector cell proliferation in response to Tregs differentiated in the presence of spore-forming bacteria from MS patients or controls. n = 3 bacterial donors per group, each representing an average of 3 technical replicates. (F) Linear correlation between IL-10 + population within CD3 + CD4 + FoxP3 + Tregs and Clostridia-Bacilli relative abundances. R 2 = 0.214, P = 0.0459. Black dots, MS patients. Light gray dots, controls.

- Submitted by
- Invitrogen Antibodies (provider)
- Main image
- Experimental details
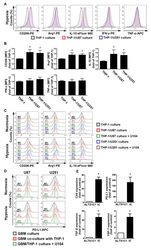
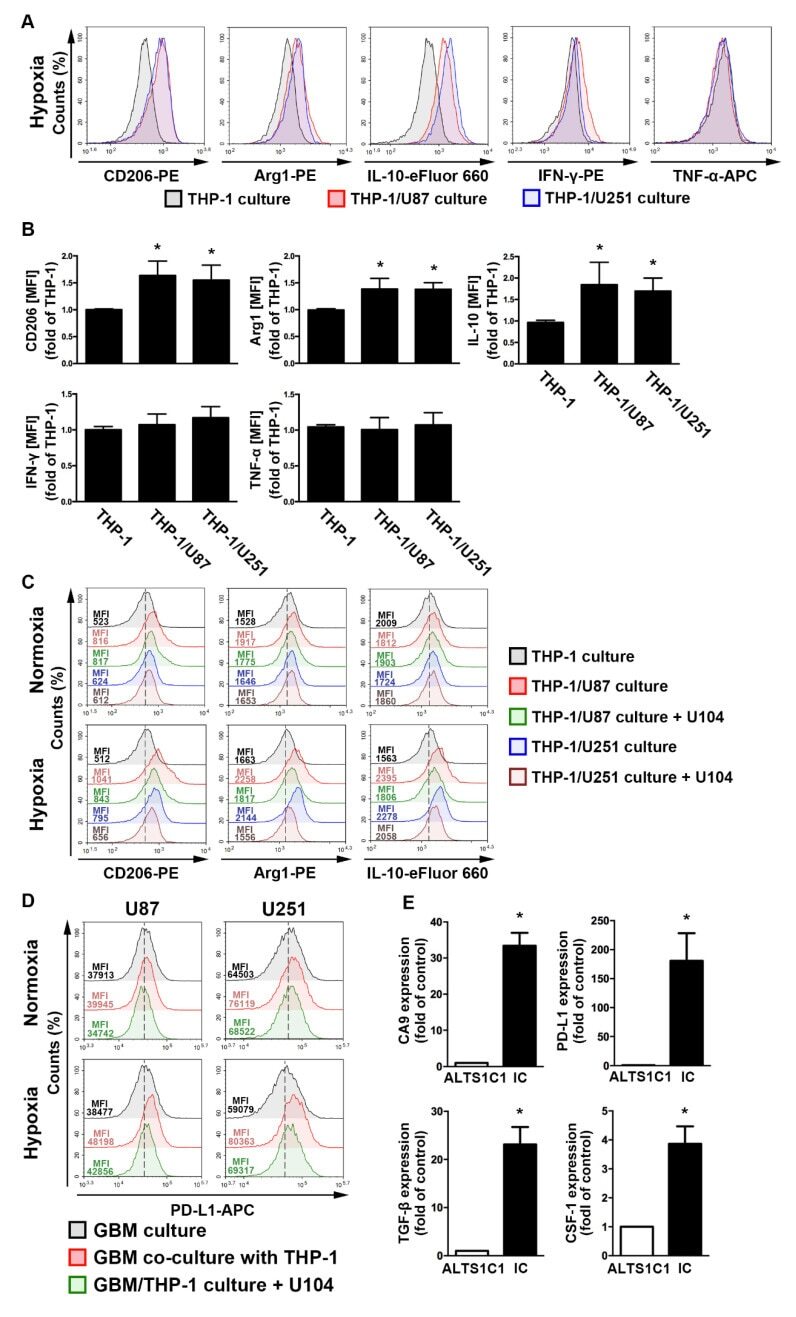
- Figure 4 The polarizations of monocyte and GBM progression in a co-cultured model under hypoxic conditions. ( A ) THP-1 monocytes were co-cultured with U87-green fluorescent protein (GFP) or U251-GFP under hypoxic conditions for 48 h. The co-cultured cells were plotted on a side scatter versus FITC. The THP-1 monocytes (GFP-negative cells) were analyzed to assess the levels of cluster of differentiation (CD) 206, arginase 1 (Arg1), interleukin (IL)-10, interferon (IFN)-gamma, and tumor necrosis factor (TNF)-alpha by flow cytometry. ( B ) The median fluorescence intensity (MFI) of CD206, Arg1, IL-10, IFN-gamma, and TNF-alpha in THP-1 monocytes in the co-cultured model under hypoxic conditions for 48 h. * p < 0.05 compared with the THP-1 monocyte group. Quantitative data are presented as the mean +- standard error (representative of n = 3). ( C ) U87-GFP and U251-GFP were treated with U104 (CAIX inhibitor) and subsequently co-cultured with THP-1 monocytes under hypoxic conditions for 48 h. THP-1 monocytes (GFP-negative cells) were analyzed to assess the levels of CD206, Arg1, and IL-10 by flow cytometry. ( D ) U87-GFP or U251-GFP was treated with U104 and subsequently co-cultured with THP-1 monocytes under hypoxic conditions for 48 h. The co-cultured cells were plotted on a side scatter versus FITC. The GFP-positive gated GBM was analyzed to assess the levels of programmed death ligand 1 (PD-L1) by flow cytometry. ( E ) The levels of CAIX, PD-L1, tumor growth factor-beta, and c
- Submitted by
- Invitrogen Antibodies (provider)
- Main image
- Experimental details
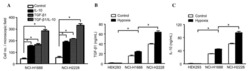
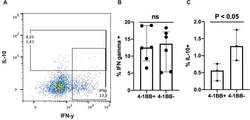
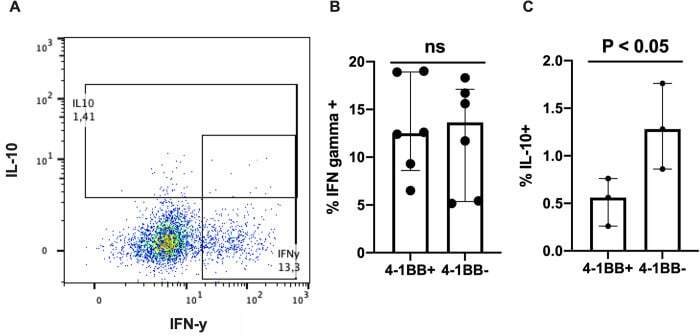
- 10.1371/journal.pone.0255574.g002 Fig 2 Cytokine production in 4-1BB + and 4-1BB - CD4 + T lymphocytes. Flow cytometry of peripheral blood mononuclear cells stimulated for 48 hours with anti-CD3 and anti-CD28 given PMA and brefaldin-A for the last 4 hours. (A) Typical flow cytometry plot of 4-1BB + CD4 + T lymphocytes from a patient with alcoholic hepatitis showing interferon-gamma (IFNy) on x-axis and interleukin-10 (IL-10) on y-axis. Frequencies of interferon-gamma + (B, n = 6) and IL-10 + (C, n = 3)) 4-1BB + and 4-1BB - CD4 + T lymphocytes in patients with alcoholic hepatitis. Differences between groups compared using paried T test. Graphs shown as median with interquartile range.
- Submitted by
- Invitrogen Antibodies (provider)
- Main image
- Experimental details
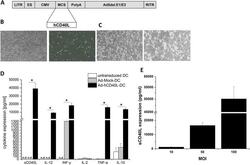
- Fig. 1 Characterization and immunstimulation of Ad-hCD40L-transduced DC. a Map of Ad-hCD40L. LITR left-inverted terminal repeat, ES encapsidation signal, CMV cytomegalovirus immediate early promoter, MCS multiple cloning site, PolyA polyadenylation signal, Ad5del.E1/E3 human adenovirus type 5 sequence with deletion of E1/E3 genes, RITR right-inverted terminal repeat. b Light (left) and fluorescence (right) microscopy of DC 48 h after transduction with Ad-GFP (magnification x 10). c Light microscopy of DC 48 h after transduction with Ad-Mock (left) or Ad-hCD40L (right). Ad-hCD40L-transduced DC form cell aggregates (magnification x 10). d Cytokine amounts in the supernatant of DC 48 h after adenoviral transduction with Ad-hCD40L, Ad-Mock or non-transduced measured by ELISA. (* p < 0.05), n.d. = non-detectable. Data represent means +- SEM of six different experiments. e Expression of sCD40L 48 h after transduction of DC with Ad-hCD40L with different MOIs, ( n = 4-5). Data represent means +- SEM of three different experiments

- Submitted by
- Invitrogen Antibodies (provider)
- Main image

- Experimental details
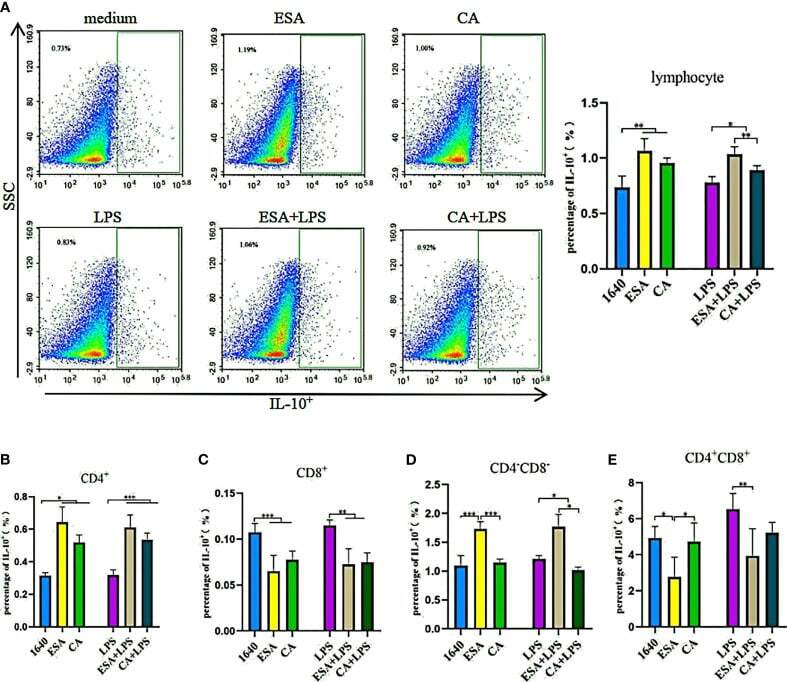
- Figure 5 IL-10 + lymphocyte assay. The production of IL-10 + lymphocyte subsets by flow cytometry. (A) Both Cysticercus cellulosae ESA and CA induced the production of IL-10 + lymphocyte. (B) CD4 + T lymphocyte was the main source Cysticercus cellulosae ESA and CA-induced IL-10 expression. (C) In the presence or absence of LPS, Cysticercus cellulosae ESA and CA significantly inhibited the expression frequency of CD8 + IL-10 + lymphocyte. (D) Cysticercus cellulosae ESA could be induced the expression of CD4 - CD8 - IL-10 + cell under the presence or absence of LPS. While, CA only decreased the expression in the presence of LPS. (E) Similar to (C) , the production of IL-10 in CD4 + CD8 + lymphocyte was inhibited by Cysticercus cellulosae ESA. All dates were shown as the means +- SD, * P < 0.05, ** P < 0.01, *** P < 0.001.
- Submitted by
- Invitrogen Antibodies (provider)
- Main image
- Experimental details
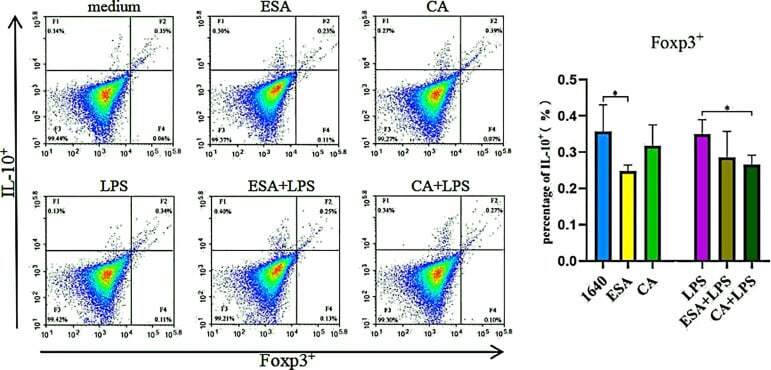
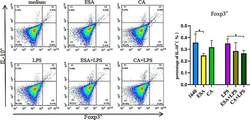
- Figure 6 The production of Foxp3 + IL-10 + lymphocyte. The co-expressing Foxp3 and IL-10 cell were detected via tricolor flow cytometry, which shown that the production of Foxp3 + IL-10 + lymphocyte was inhibited by Cysticercus cellulosae ESA. Besides, CA had significantly decreased the production only under the presence of LPS. Results were expressed as the mean+- SD, * P < 0.05.