Explore
 Validate
 Learn
LearnMA5-16216
antibody from Invitrogen Antibodies
Targeting: TLR4
ARMD10, CD284, hToll, TLR-4
 Western blot
 ELISA
ELISA Immunohistochemistry Flow cytometry Blocking/Neutralizing Chromatin Immunoprecipitation Other assay
Antibody data
- Antibody Data
- Antigen structure
- References [6]
- Comments [0]
- Validations
- Immunohistochemistry [5]
- Flow cytometry [13]
- Other assay [9]
Submit
Validation data
Reference
Comment
Report error
- Product number
- MA5-16216 - Provider product page

- Provider
- Invitrogen Antibodies
- Product name
- TLR4 Monoclonal Antibody (76B357.1)
- Antibody type
- Monoclonal
- Antigen
- Other
- Description
- Suggested positive control: intestine lysate (WB), ThP1, Ramos (flow).
- Reactivity
- Human, Mouse, Rat, Bovine, Porcine
- Host
- Mouse
- Isotype
- IgG
- Antibody clone number
- 76B357.1
- Vial size
- 100 μg
- Concentration
- 1.0 mg/mL
- Storage
- Store at 4°C short term. For long term storage, store at -20°C, avoiding freeze/thaw cycles.
Submitted references Qinghao-Biejia Herb Pair Alleviates Pristane-Induced Lupus-Like Disease and Associated Renal and Aortic Lesions in ApoE(-/-) Mice.
Mechanical Compression by Simulating Orthodontic Tooth Movement in an In Vitro Model Modulates Phosphorylation of AKT and MAPKs via TLR4 in Human Periodontal Ligament Cells.
High-fat diet impairs duodenal barrier function and elicits glia-dependent changes along the gut-brain axis that are required for anxiogenic and depressive-like behaviors.
Immunomodulatory effects of Radix isatidis polysaccharides in vitro and in vivo.
Age-Specific Adjuvant Synergy: Dual TLR7/8 and Mincle Activation of Human Newborn Dendritic Cells Enables Th1 Polarization.
MicroRNA-27a Inhibits Cell Migration and Invasion of Fibroblast-Like Synoviocytes by Targeting Follistatin-Like Protein 1 in Rheumatoid Arthritis.
Hong J, Zhang M, He Y, Jin Y, He Q, Zhang Y, Shi X, Tian W, Wen C, Chen J
Frontiers in pharmacology 2022;13:897669
Frontiers in pharmacology 2022;13:897669
Mechanical Compression by Simulating Orthodontic Tooth Movement in an In Vitro Model Modulates Phosphorylation of AKT and MAPKs via TLR4 in Human Periodontal Ligament Cells.
Roth CE, Craveiro RB, Niederau C, Malyaran H, Neuss S, Jankowski J, Wolf M
International journal of molecular sciences 2022 Jul 22;23(15)
International journal of molecular sciences 2022 Jul 22;23(15)
High-fat diet impairs duodenal barrier function and elicits glia-dependent changes along the gut-brain axis that are required for anxiogenic and depressive-like behaviors.
Seguella L, Pesce M, Capuano R, Casano F, Pesce M, Corpetti C, Vincenzi M, Maftei D, Lattanzi R, Del Re A, Sarnelli G, Gulbransen BD, Esposito G
Journal of neuroinflammation 2021 May 16;18(1):115
Journal of neuroinflammation 2021 May 16;18(1):115
Immunomodulatory effects of Radix isatidis polysaccharides in vitro and in vivo.
Tao W, Fu T, He ZJ, Zhou HP, Hong Y
Experimental and therapeutic medicine 2021 Dec;22(6):1405
Experimental and therapeutic medicine 2021 Dec;22(6):1405
Age-Specific Adjuvant Synergy: Dual TLR7/8 and Mincle Activation of Human Newborn Dendritic Cells Enables Th1 Polarization.
van Haren SD, Dowling DJ, Foppen W, Christensen D, Andersen P, Reed SG, Hershberg RM, Baden LR, Levy O
Journal of immunology (Baltimore, Md. : 1950) 2016 Dec 1;197(11):4413-4424
Journal of immunology (Baltimore, Md. : 1950) 2016 Dec 1;197(11):4413-4424
MicroRNA-27a Inhibits Cell Migration and Invasion of Fibroblast-Like Synoviocytes by Targeting Follistatin-Like Protein 1 in Rheumatoid Arthritis.
Shi DL, Shi GR, Xie J, Du XZ, Yang H
Molecules and cells 2016 Aug 31;39(8):611-8
Molecules and cells 2016 Aug 31;39(8):611-8
No comments: Submit comment
Supportive validation
- Submitted by
- Invitrogen Antibodies (provider)
- Main image
- Experimental details
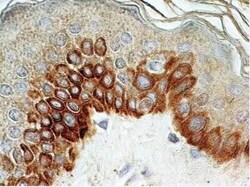
- Immunohistochemical analysis of TLR4 in Human skin. Samples were incubated in TLR4 monoclonal antibody (Product # MA5-16216) using a dilution of 5 µg/mL followed by peroxidase-conjugate and DAB chromogen. Staining of formalin-fixed tissues is enhanced by boiling tissue sections in 10 mM sodium citrate buffer, pH 6.0 for 10-20 min followed by cooling at RT for 20 min.

- Submitted by
- Invitrogen Antibodies (provider)
- Main image
- Experimental details
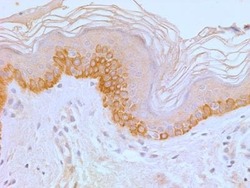
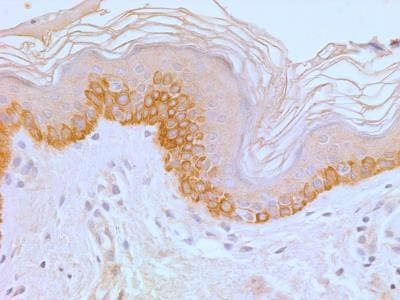
- Immunohistochemical analysis of TLR4 in Tissue section of normal human skin. Samples were incubated with TLR4 monoclonal antibody (Product # MA5-16216) using a dilution of 5 µg/mL. Membrane-cytoplasmic immunopositivity of TLR4 was primarily observed in the pigmented basel cells and the adjacent keratinocytes in the epidermal layer.
- Submitted by
- Invitrogen Antibodies (provider)
- Main image
- Experimental details
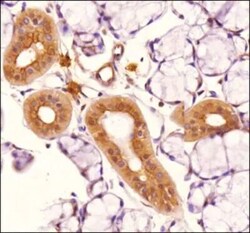
- Immunohistochemical analysis of TLR4 in rat salivary gland tissue. Samples were incubated in TLR4 monoclonal antibody (Product # MA5-16216) using a dilution of 1:100. The antibody generated a membrane-cytoplasmic staining in the tissue with stronger signal in ductal epithelial cells.

- Submitted by
- Invitrogen Antibodies (provider)
- Main image

- Experimental details
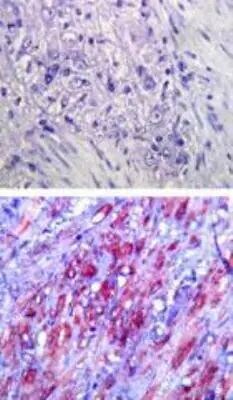
- Immunohistochemical analysis of TLR4 in formalin-fixed paraffin-embedded human colon tissue. Samples were incubated in TLR4 monoclonal antibody (Product # MA5-16216) using a dilution of 5 µg/mL. Isotype control (top) and this antibody (bottom).
- Submitted by
- Invitrogen Antibodies (provider)
- Main image
- Experimental details
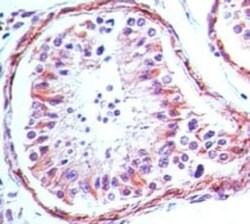
- Immunohistochemical analysis of TLR4 in Human testis tissue. Samples were incubated in TLR4 monoclonal antibody (Product # MA5-16216) using a dilution of 5 µg/mL.

Supportive validation
- Submitted by
- Invitrogen Antibodies (provider)
- Main image
- Experimental details
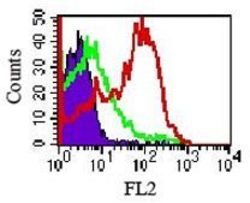
- Surface staining of mouse splenocytes using a TLR4/CD284 monoclonal antibody (Product # MA5-16216) (0.5 µg/10^6 cells) and a PE-conjugated secondary. Shaded histogram represents cells without TLR4/CD284 monoclonal antibody (Product # MA5-16216); green represents isotype control red represents TLR4 antibody.

- Submitted by
- Invitrogen Antibodies (provider)
- Main image

- Experimental details
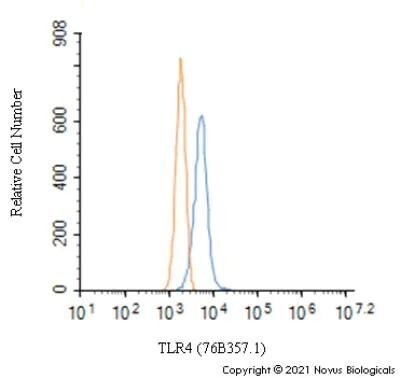
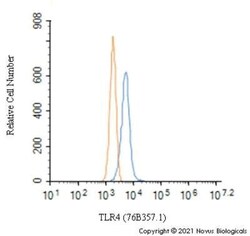
- Flow cytometry of TLR4 in Raw264.7 cells. Samples were incubated with TLR4 monoclonal antibody (Product # MA5-16216) using a dilution of 2.5 µg/mL for 30 minutes at room temperature followed by Mouse IgG (H+L) Cross-Adsorbed Secondary Antibody, Dylight 550 (Product # 35503). Antibody (blue) and a matched mouse IgG2b Kappa isotype control (orange). Cells were fixed with 4% PFA and then permeabilized with 0.1% saponin.
- Submitted by
- Invitrogen Antibodies (provider)
- Main image
- Experimental details
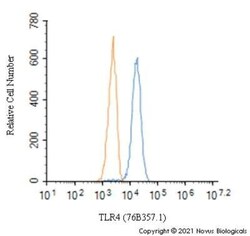
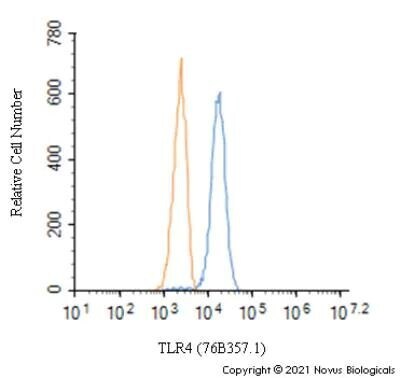
- Flow cytometry of TLR4 in Jurkat cells. Samples were incubated with TLR4 monoclonal antibody (Product # MA5-16216) using a dilution of 2.5 µg/mL for 30 minutes at room temperature followed by Mouse IgG (H+L) Cross-Adsorbed Secondary Antibody, Dylight 550 (Product # 35503). Antibody (blue) and a matched mouse IgG2b Kappa isotype control (orange). Cells were fixed with 4% PFA and then permeabilized with 0.1% saponin.

- Submitted by
- Invitrogen Antibodies (provider)
- Main image

- Experimental details
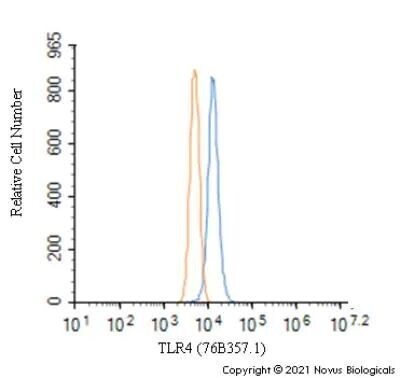
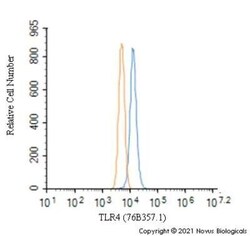
- Flow cytometry of TLR4 in RH30 cells. Samples were incubated with TLR4 monoclonal antibody (Product # MA5-16216) using a dilution of 2.5 µg/mL for 30 minutes at room temperature followed by Mouse IgG (H+L) Cross-Adsorbed Secondary Antibody, Dylight 550 (Product # 35503). Antibody (blue) and a matched mouse IgG2b Kappa isotype control (orange). Cells were fixed with 4% PFA and then permeabilized with 0.1% saponin.
- Submitted by
- Invitrogen Antibodies (provider)
- Main image
- Experimental details
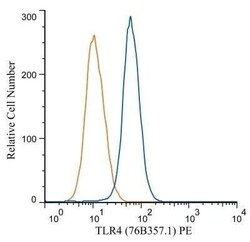
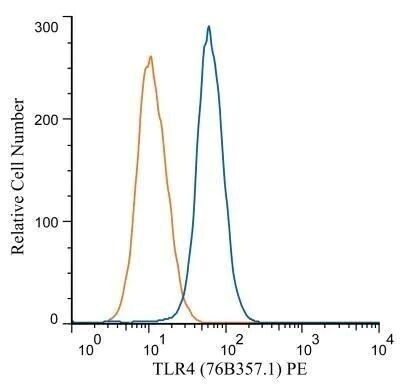
- Flow cytometry of TLR4 in Jurkat cells (blue) and an isotype control (orange). Samples were incubated in TLR4 monoclonal antibody (Product # MA5-16216) using a dilution of 2.5 µg/mL for 30 minutes at room temperature. Cells were fixed with 4% PFA and then permeablized with 0.1% saponin. Both antibodies were conjugated to Phycoerythrin.

- Submitted by
- Invitrogen Antibodies (provider)
- Main image
- Experimental details
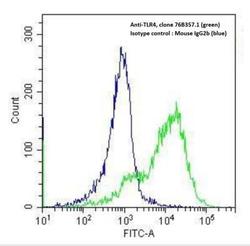
- Flow cytometry of TLR4 in THP-1 cells (human monocytic leukemia cells). Samples were incubated in TLR4 monoclonal antibody (Product # MA5-16216) using a dilution of 2 µg/10^6 cells followed by donkey anti-mouse IgG (H+L) cross adsorbed secondary antibody (DyLight 488 conjugated). Isotype control samples incubated with mouse IgG2b isotype control antibody were processed in parallal under the same assay conditions.

- Submitted by
- Invitrogen Antibodies (provider)
- Main image

- Experimental details
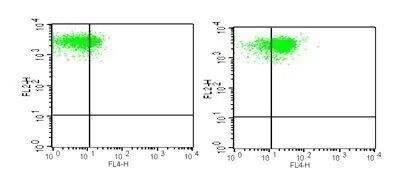
- Flow cytometry of TLR4 in monocytes from human peripheral blood. Samples were incubated in TLR4 monoclonal antibody (Product # MA5-16216). Antibody conjugated to Alexa Fluor (R) 647. PBMC were stained in a 2 color flow test, with CD14 PE version of this antibody and 1 µg of either isotype control (left) or TLR4-Alexa Fluor 647 (right). PPI negative, CD14+ cells were gated for analysis.

- Submitted by
- Invitrogen Antibodies (provider)
- Main image
- Experimental details
- Flow cytometry of TLR4 in Raw264.7 cells. Samples were incubated with TLR4 monoclonal antibody (Product # MA5-16216) using a dilution of 2.5 µg/mL for 30 minutes at room temperature followed by Mouse IgG (H+L) Cross-Adsorbed Secondary Antibody, Dylight 550 (Product # 35503). Antibody (blue) and a matched mouse IgG2b Kappa isotype control (orange). Cells were fixed with 4% PFA and then permeabilized with 0.1% saponin.

- Submitted by
- Invitrogen Antibodies (provider)
- Main image

- Experimental details
- Flow cytometry of TLR4 in Jurkat cells. Samples were incubated with TLR4 monoclonal antibody (Product # MA5-16216) using a dilution of 2.5 µg/mL for 30 minutes at room temperature followed by Mouse IgG (H+L) Cross-Adsorbed Secondary Antibody, Dylight 550 (Product # 35503). Antibody (blue) and a matched mouse IgG2b Kappa isotype control (orange). Cells were fixed with 4% PFA and then permeabilized with 0.1% saponin.
- Submitted by
- Invitrogen Antibodies (provider)
- Main image
- Experimental details
- Flow cytometry of TLR4 in RH30 cells. Samples were incubated with TLR4 monoclonal antibody (Product # MA5-16216) using a dilution of 2.5 µg/mL for 30 minutes at room temperature followed by Mouse IgG (H+L) Cross-Adsorbed Secondary Antibody, Dylight 550 (Product # 35503). Antibody (blue) and a matched mouse IgG2b Kappa isotype control (orange). Cells were fixed with 4% PFA and then permeabilized with 0.1% saponin.

- Submitted by
- Invitrogen Antibodies (provider)
- Main image

- Experimental details
- Flow cytometry of TLR4 in Jurkat cells (blue) and an isotype control (orange). Samples were incubated in TLR4 monoclonal antibody (Product # MA5-16216) using a dilution of 2.5 µg/mL for 30 minutes at room temperature. Cells were fixed with 4% PFA and then permeablized with 0.1% saponin. Both antibodies were conjugated to Phycoerythrin.
- Submitted by
- Invitrogen Antibodies (provider)
- Main image

- Experimental details
- Flow cytometry of TLR4 in THP-1 cells (human monocytic leukemia cells). Samples were incubated in TLR4 monoclonal antibody (Product # MA5-16216) using a dilution of 2 µg/10^6 cells followed by donkey anti-mouse IgG (H+L) cross adsorbed secondary antibody (DyLight 488 conjugated). Isotype control samples incubated with mouse IgG2b isotype control antibody were processed in parallal under the same assay conditions.

- Submitted by
- Invitrogen Antibodies (provider)
- Main image

- Experimental details
- Flow cytometry of TLR4 in monocytes from human peripheral blood. Samples were incubated in TLR4 monoclonal antibody (Product # MA5-16216). Antibody conjugated to Alexa Fluor (R) 647. PBMC were stained in a 2 color flow test, with CD14 PE version of this antibody and 1 µg of either isotype control (left) or TLR4-Alexa Fluor 647 (right). PPI negative, CD14+ cells were gated for analysis.
Supportive validation
- Submitted by
- Invitrogen Antibodies (provider)
- Main image
- Experimental details
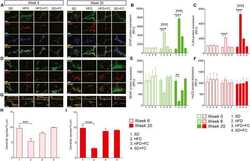
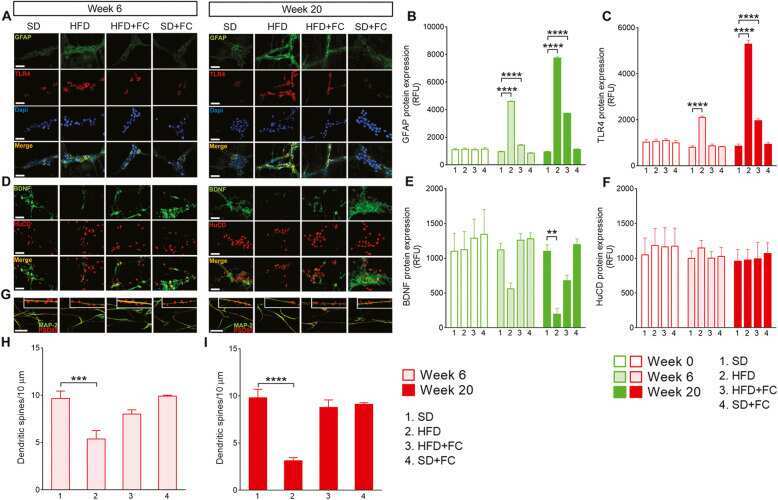
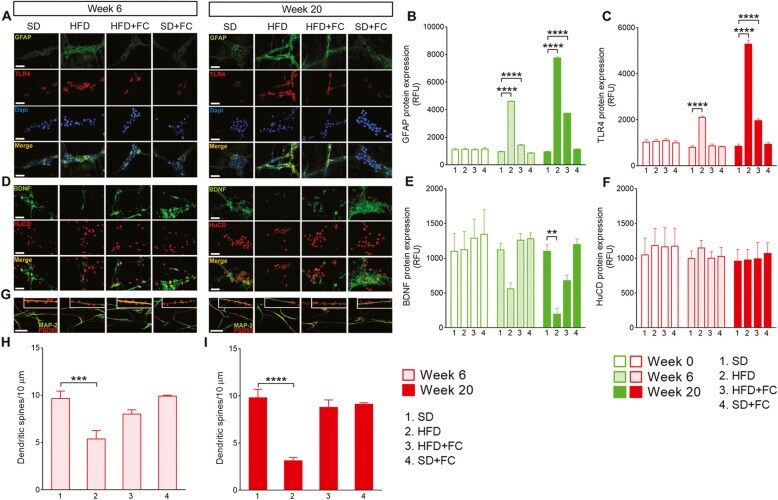
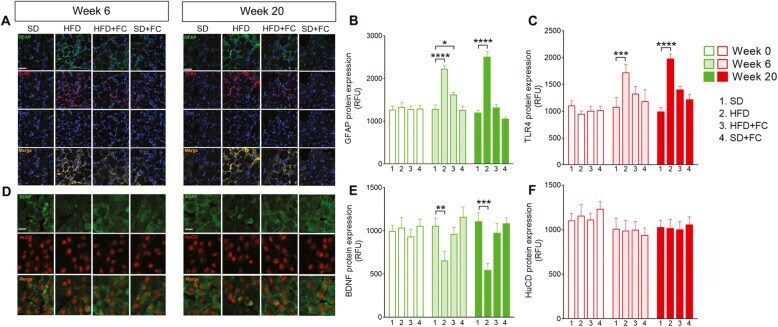
- Fig. 2 HFD induces glial-dependent changes in the duodenal myenteric plexus and dendritic spines decrease in neurons. Representative images of duodenal myenteric plexus from mice fed with a standard diet (SD) or high-fat diet (HFD) for 20 weeks, in the absence or presence of daily IP of 10 mumol/kg fluorocitrate (FC). GFAP (green), TLR4 (red), and Dapi (blue) immunoreactivity and relative immunolabeling quantification at weeks 6 and 20 ( a - c ) of diet protocol, respectively. BDNF (green) and HuCD (red) protein expression were also assessed at 6 and 20 weeks ( d - f ), respectively. The number of spines (PSD 95 immunoreactivity, red) was measured along neuronal dendrites (MAP-2 immunoreactivity, green) of cultured enteric neurons isolated from the duodenal myenteric plexuses of the above-mentioned experimental groups at weeks 6 and 20 ( g - i ) of diet protocol. Data were analyzed by 2-way ANOVA or 1-way ANOVA and Dunnett post hoc. Results are expressed as average relative fluorescence units (RFU) +- SEM per area unit or average number of dendritic spines/10 mum of n assessments. * *P
- Submitted by
- Invitrogen Antibodies (provider)
- Main image
- Experimental details
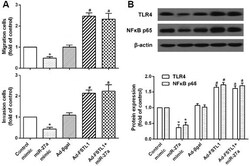
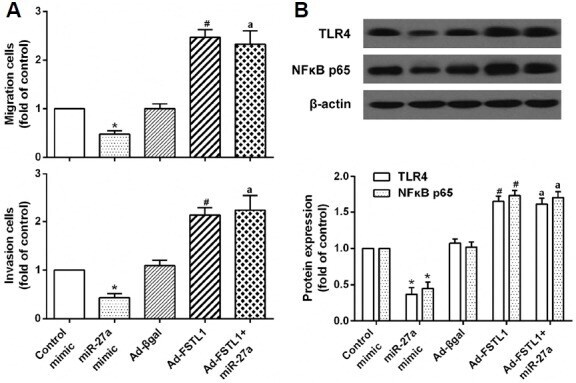
- Fig. 5. FSTL1 overexpression rescues the miR-27a-mediated suppressive effect on RA-FLS migration and invasion by activating the TLR4/NFkappaB pathway. RA-FLS were transfected with miR-27a, exogenous FSTL1, or miR-27a and exogenous FSTL1. (A) The cell migration and invasion of RA-FLS as measured using the Transwell system. (B) Protein expression levels of TLR4 and NFkappaB in RA-FLS were detected by western blot analysis. * p < 0.05, versus control mimic group. # p < 0.05, versus Ad-beta-gal group. a p < 0.05, versus miR-27a mimic group.
- Submitted by
- Invitrogen Antibodies (provider)
- Main image

- Experimental details
- Fig. 2 HFD induces glial-dependent changes in the duodenal myenteric plexus and dendritic spines decrease in neurons. Representative images of duodenal myenteric plexus from mice fed with a standard diet (SD) or high-fat diet (HFD) for 20 weeks, in the absence or presence of daily IP of 10 mumol/kg fluorocitrate (FC). GFAP (green), TLR4 (red), and Dapi (blue) immunoreactivity and relative immunolabeling quantification at weeks 6 and 20 ( a - c ) of diet protocol, respectively. BDNF (green) and HuCD (red) protein expression were also assessed at 6 and 20 weeks ( d - f ), respectively. The number of spines (PSD 95 immunoreactivity, red) was measured along neuronal dendrites (MAP-2 immunoreactivity, green) of cultured enteric neurons isolated from the duodenal myenteric plexuses of the above-mentioned experimental groups at weeks 6 and 20 ( g - i ) of diet protocol. Data were analyzed by 2-way ANOVA or 1-way ANOVA and Dunnett post hoc. Results are expressed as average relative fluorescence units (RFU) +- SEM per area unit or average number of dendritic spines/10 mum of n assessments. * *P
- Submitted by
- Invitrogen Antibodies (provider)
- Main image
- Experimental details
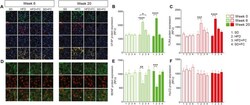
- Fig. 3 HFD evokes glial activation in the nodose ganglia after 20 weeks on diet. Immunofluorescence images show the expression of GFAP (green), TLR4 (red), and Dapi (blue) in the nodose ganglia and relative immunolabeling quantification at weeks 6 and 20 ( a - c ) of the diet protocol. BDNF (green) and HuCD (red) expression in nodose ganglia and relative quantification is shown at the same time points ( d - f ). Data were analyzed by 2-way ANOVA and Dunnett post hoc. Results are expressed as average relative fluorescence units (RFU) +- SEM per area unit of n assessments. * P
- Submitted by
- Invitrogen Antibodies (provider)
- Main image

- Experimental details
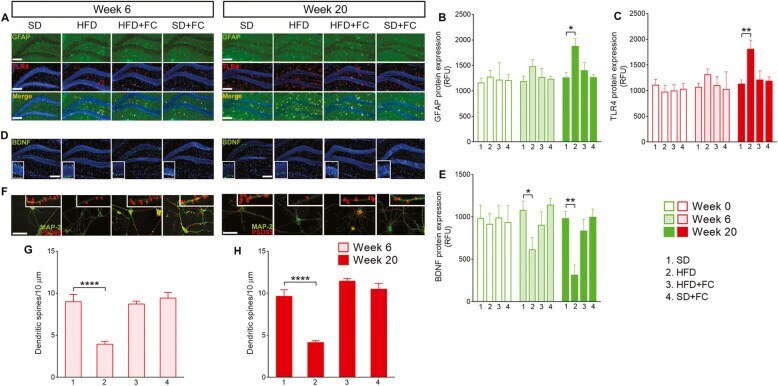
- Fig. 4 HFD drives glial-dependent changes in the hippocampus and neuronal dendritic spines decrease. Representative images of hippocampal slices from mice fed with a standard diet (SD) or high-fat diet (HFD) for 20 weeks, in the absence or presence of daily IP of 10 mumol/kg fluorocitrate (FC). Triple-label immunofluorescence for GFAP (green), TLR4 (red), and Dapi (blue) and related fluorescence intensity quantification at weeks 6 and 20 ( a - c ) of diet protocol are shown, respectively. In parallel, BDNF protein expression (green) in the dentate gyrus was assessed at 6 and 20 weeks ( d and e ), respectively. The number of dendritic spines (PSD 95 immunoreactivity, red) was measured in hippocampal neurons' dendrites (MAP-2 immunoreactivity, green) isolated from the abovementioned experimental groups at weeks 6 ( f and g ) and 20 ( f and h ) of diet protocol. Data were analyzed by 2-way ANOVA and 1-way ANOVA and Dunnett post hoc. Results are expressed as average relative fluorescence units (RFU) +- SEM per area unit or the average number of dendritic spines/10 mum of n assessments. * P
- Submitted by
- Invitrogen Antibodies (provider)
- Main image
- Experimental details
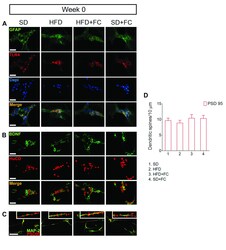
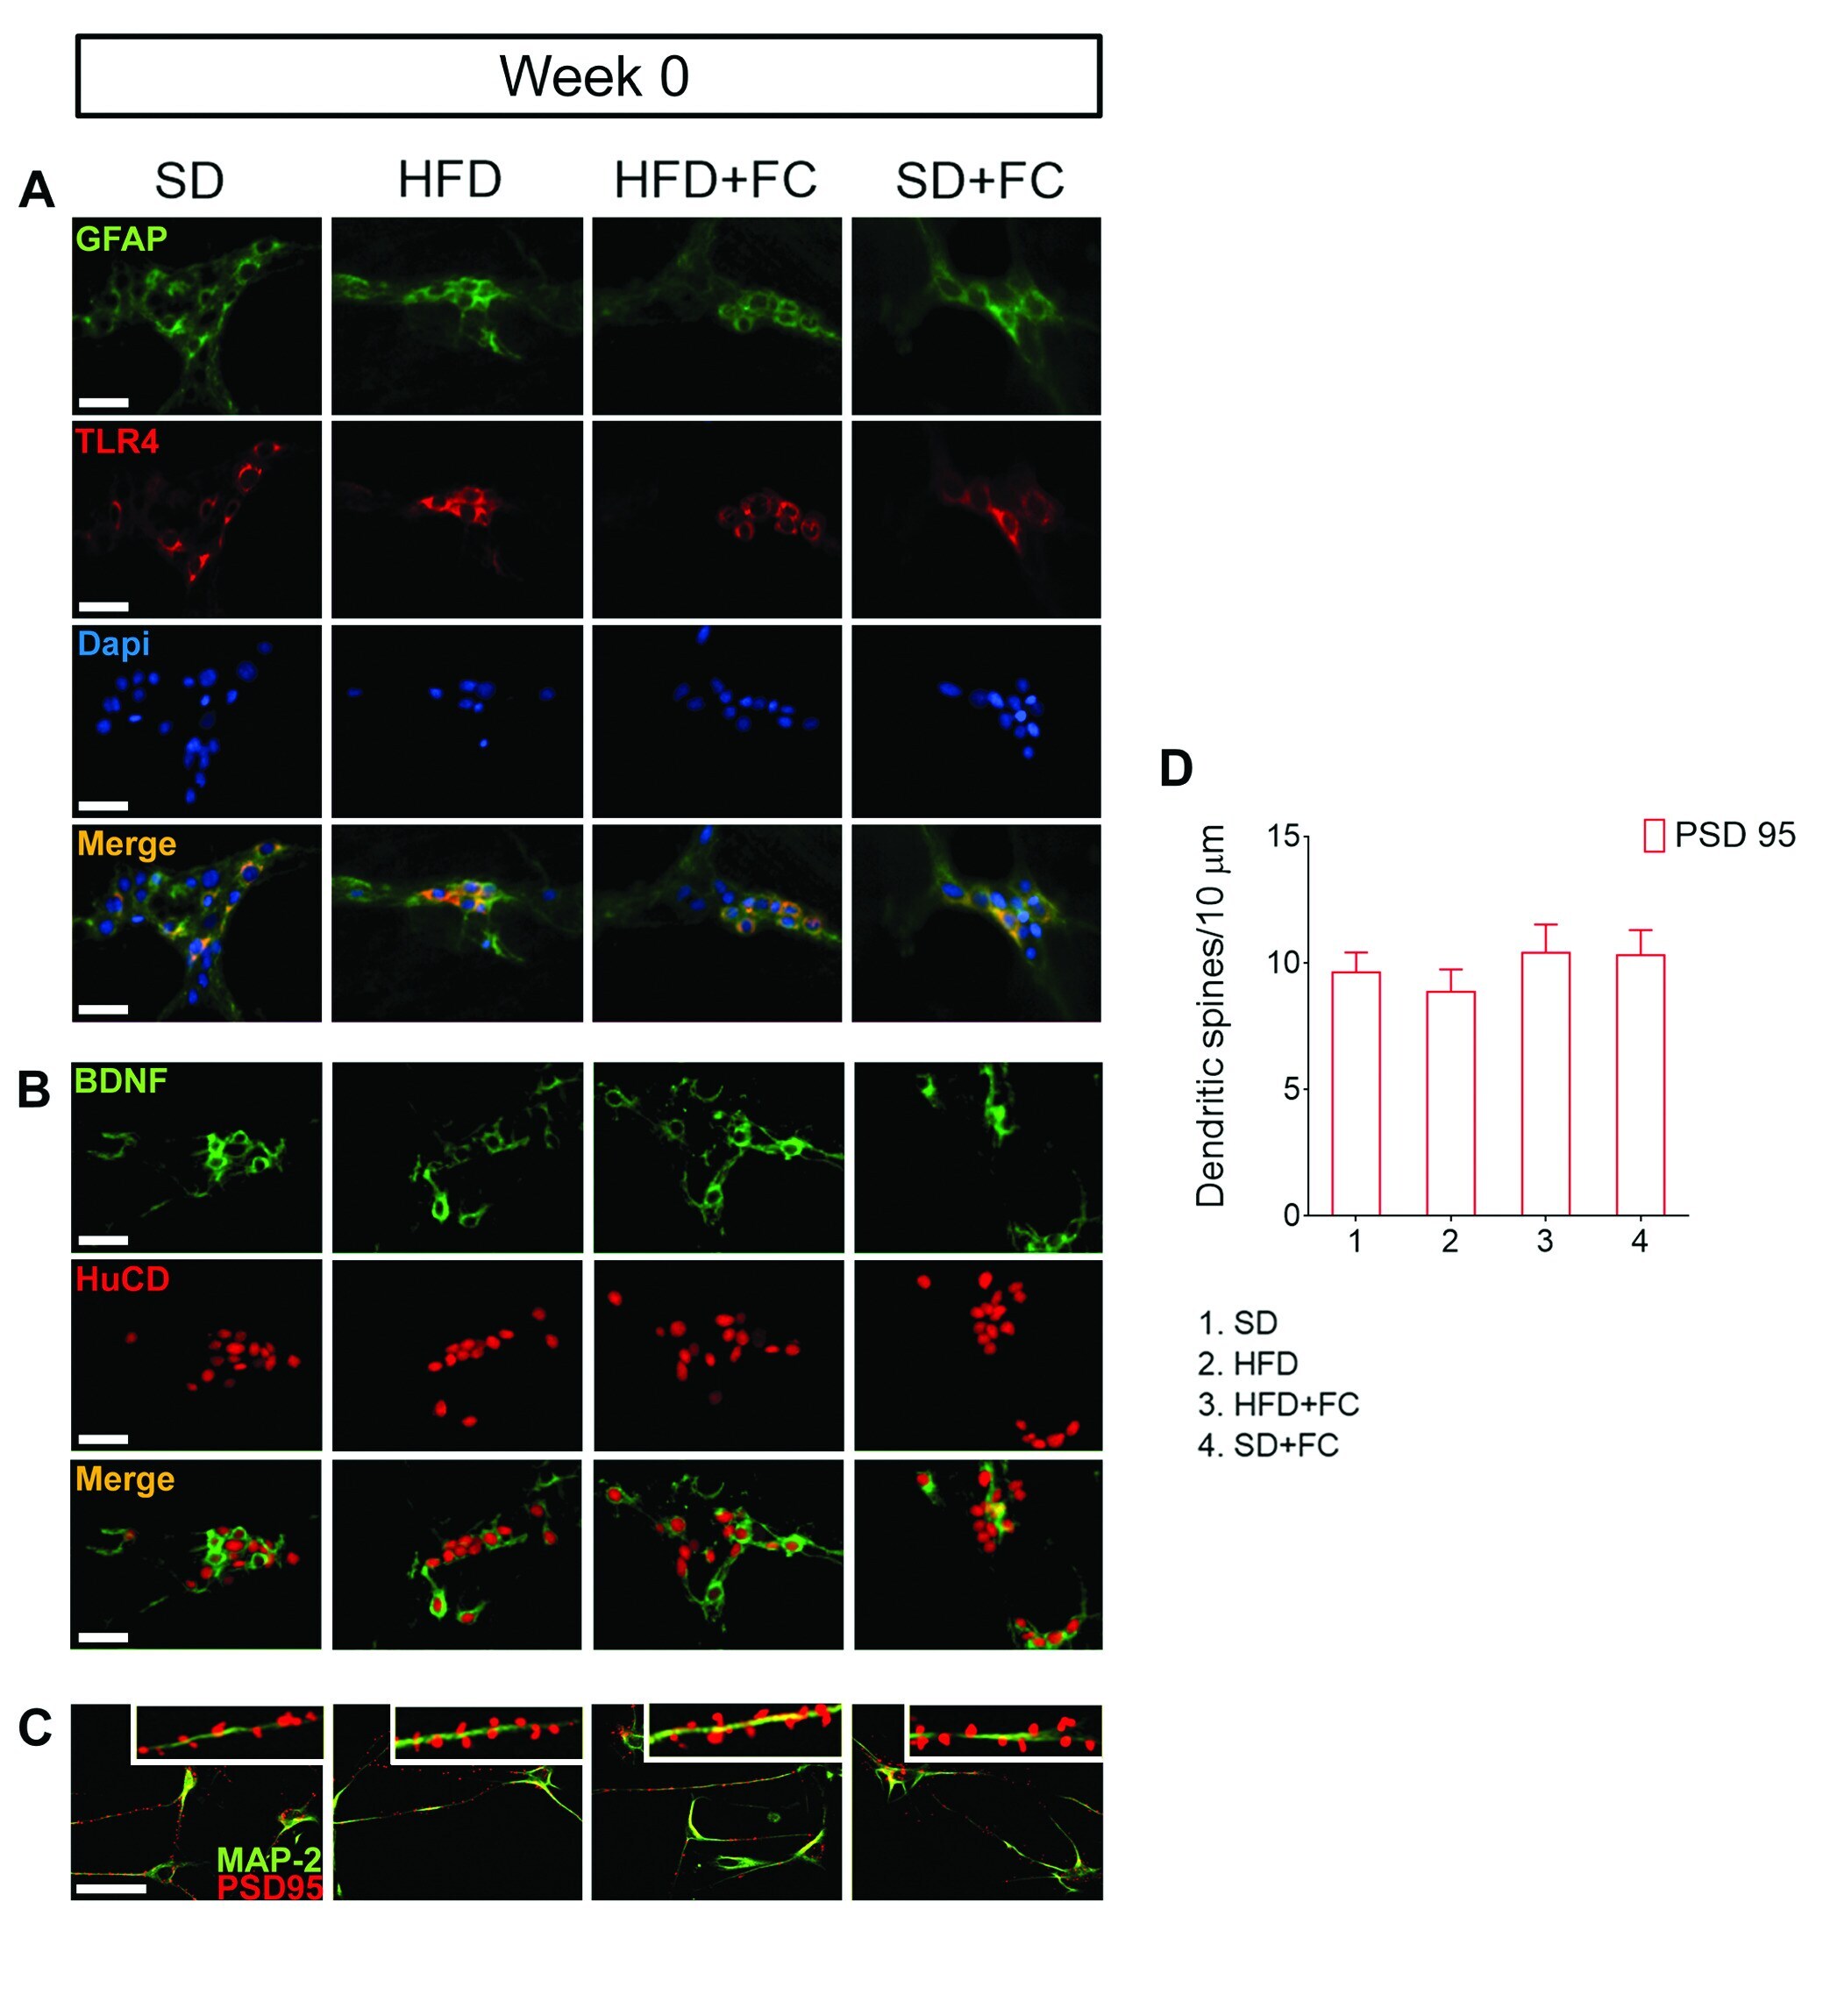
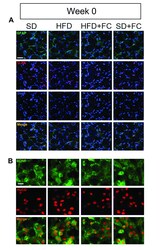
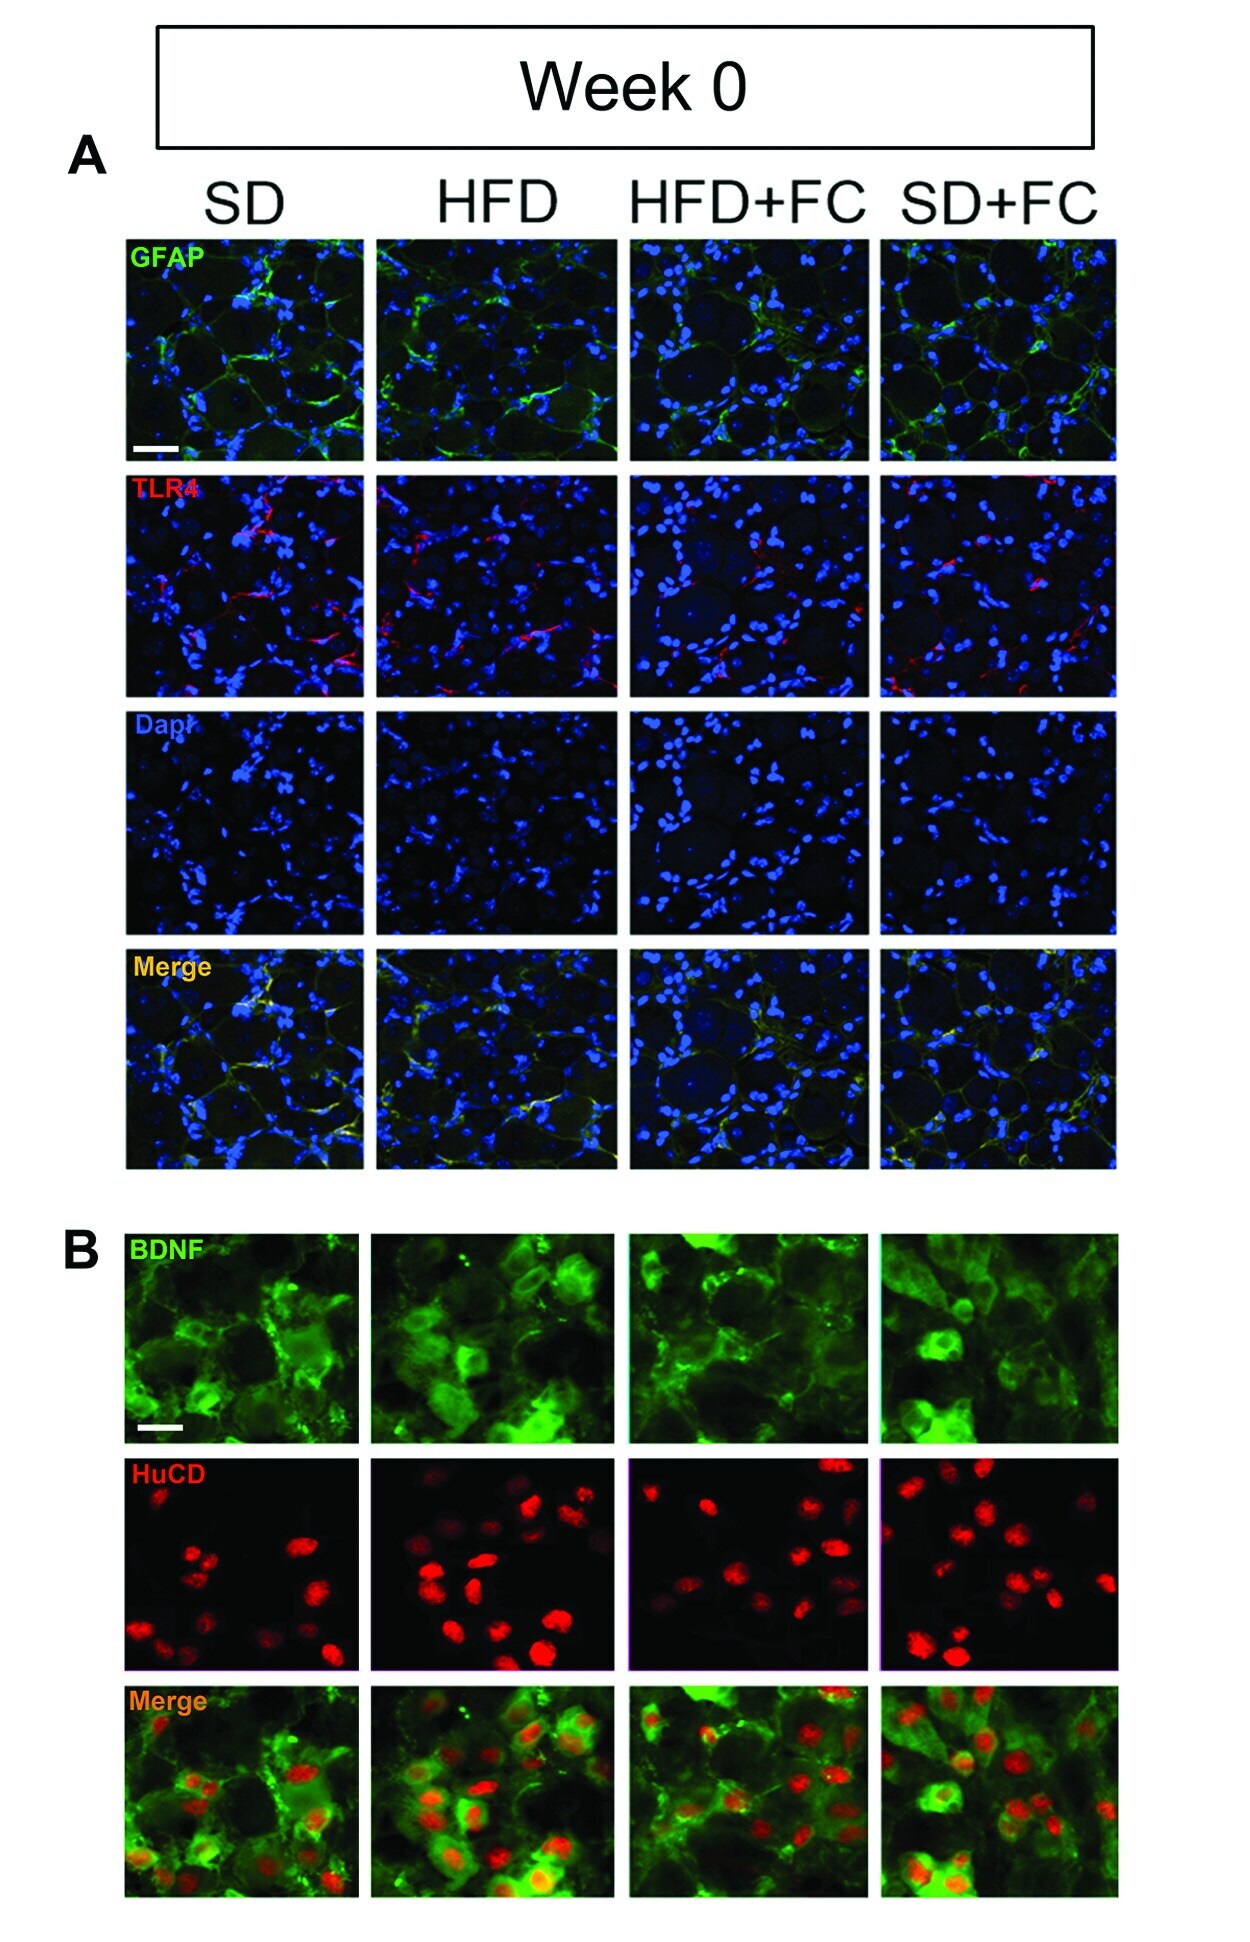
- Additional file 3 Representative images of duodenal myenteric plexus and cultured enteric neurons before starting the diet protocol. In the duodenal myenteric plexus, (A) GFAP (green), TLR4 (red), and Dapi (blue) immunoreactivity were quantified together with (B) BDNF (green) and HuCD (red) expression at week 0 (relative immunolabeling quantification shown in Fig. 2 ). The number of spines (PSD 95 immunoreactivity, red) was measured along neuronal dendrites (MAP-2 immunoreactivity, green) of cultured enteric neurons isolated from the duodenal myenteric plexuses before starting the diet protocol (C and D). Data were analyzed by 2-way ANOVA or 1-way ANOVA and Dunnettpost-hoc . Results are expressed as average relative fluorescence units (RFU) +- SEM per area unit or average number of dendritic spines/10 mum of n assessments. Scale bars = 10 and 20 mum.
- Submitted by
- Invitrogen Antibodies (provider)
- Main image
- Experimental details
- Additional file 4 Immunofluorescence images of nodose ganglia isolated from each group before starting the diet protocol. (A) GFAP (green), TLR4 (red), and Dapi (blue) in the nodose ganglia and relative immunolabeling quantification shown in Fig. 3 . (B) BDNF (green) and HuCD (red) expression in nodose ganglia with relative quantification is also shown. Data were analyzed by 2-way ANOVA and Dunnettpost-hoc . Results are expressed as average relative fluorescence units (RFU) +- SEM per area unit of n assessments. Scale bar = 20 mum.
- Submitted by
- Invitrogen Antibodies (provider)
- Main image
- Experimental details
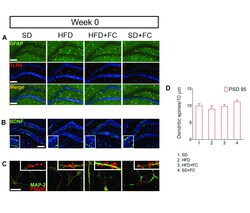
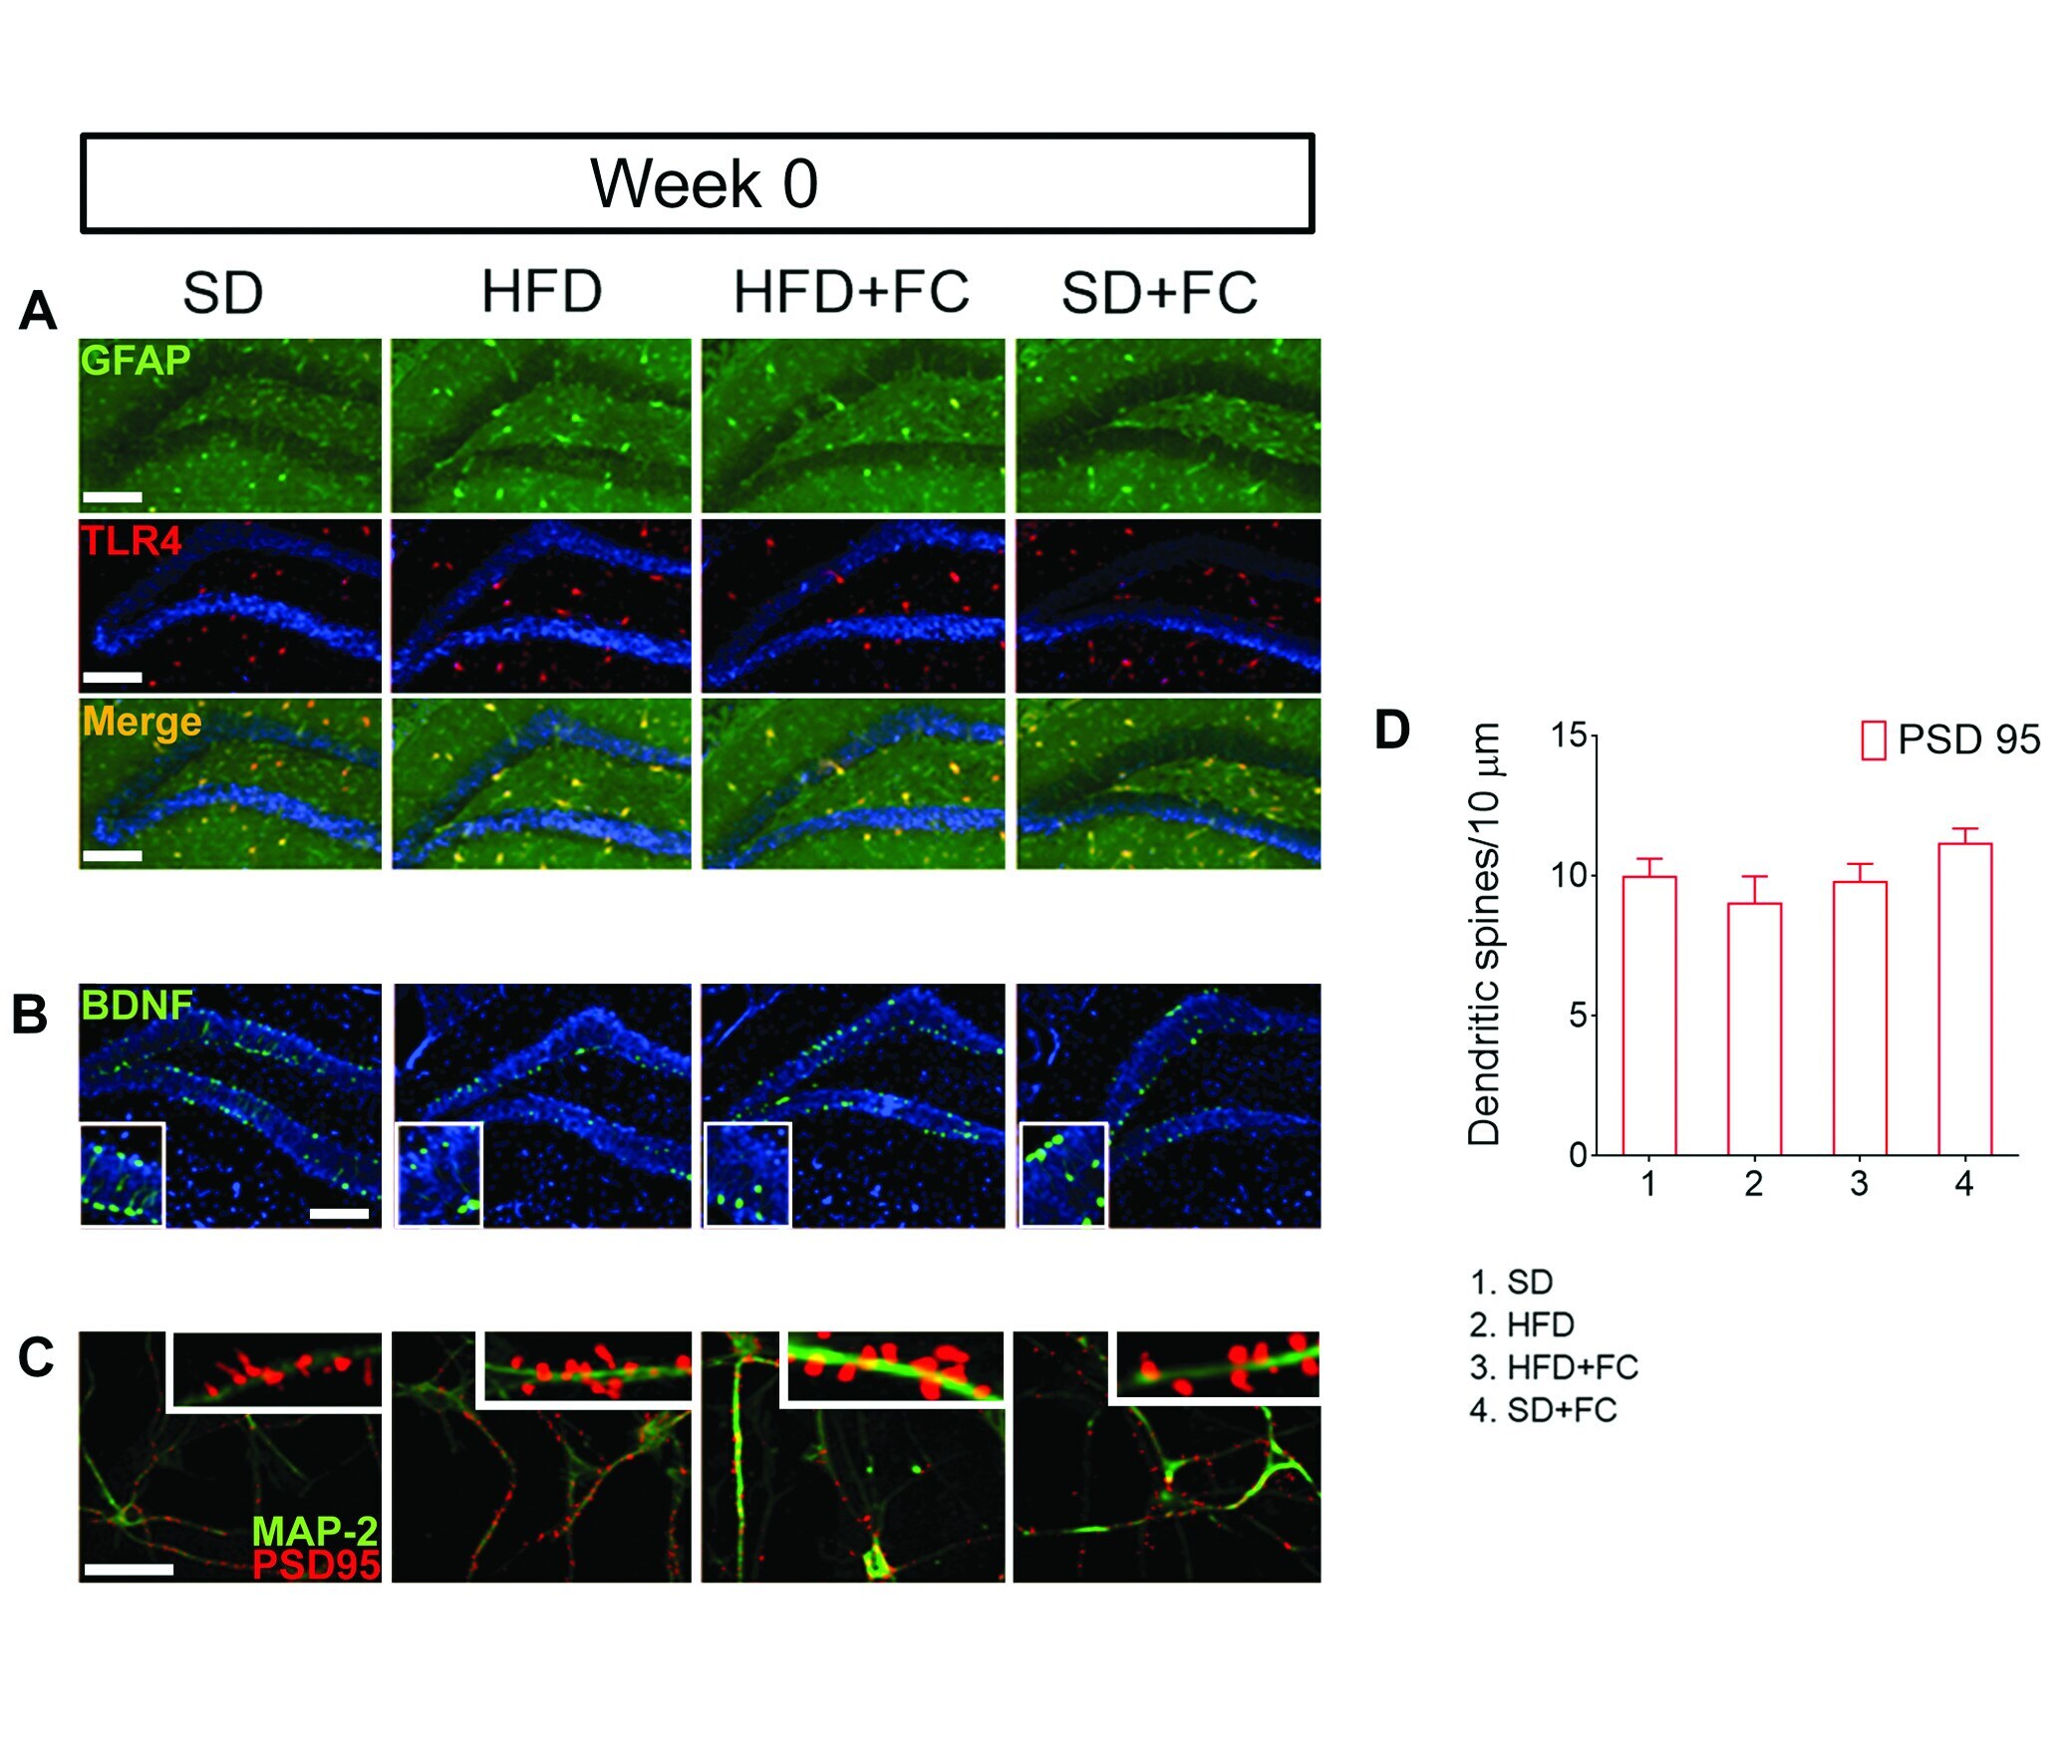
- Additional file 5 Representative images of hippocampal dentate gyrus and cultured neurons before starting the diet protocol. (A) Triple-label immunofluorescence for GFAP (green), TLR4 (red), and Dapi (blue) with relative fluorescence intensity quantification shown in Fig. 4 . (B) BDNF protein expression (green) and immunoquantification in the dentate gyrus of the hippocampus. (C and D) Representative pictures show the neuronal spines (PSD 95 immunoreactivity, red) measured along hippocampal neurons' dendrites (MAP-2 immunoreactivity, green) isolated before starting the diet protocol. Data were analyzed by 2-way ANOVA or 1-way ANOVA and Dunnettpost-hoc . Results are expressed as average relative fluorescence units (RFU) +- SEM per area unit or the average number of dendritic spines/10 mum of n assessments. Scale bars = 10 and 20 mum.
- Submitted by
- Invitrogen Antibodies (provider)
- Main image
- Experimental details
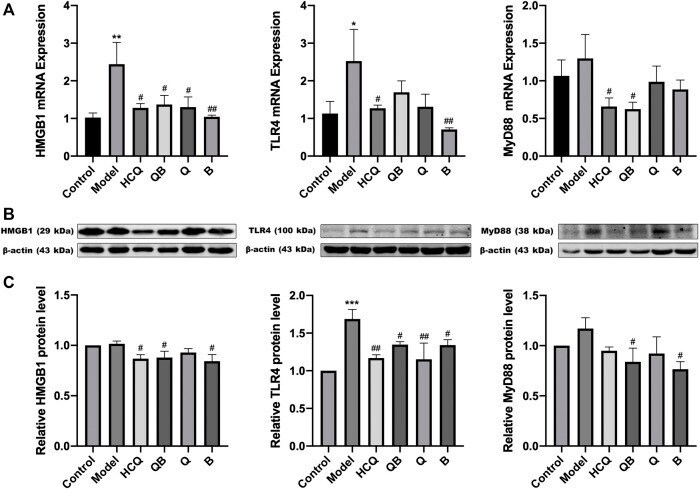
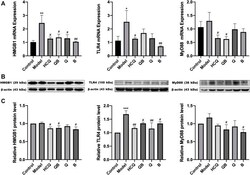
- FIGURE 6 Qinghao-Biejia can partly inhibit HMGB1/TLR4 pathway in kidneys. (A) The mRNA expression level of high mobility group box 1 protein (HMGB1), toll like receptor 4 (TLR4), and myeloid differentiation primary response 88 (MyD88) determined by RT-qPCR. (B) Band diagrams of HMGB1, TLR4, and MyD88 in kidney tissue of mice determined by western blot. (C) The expression level of HMGB1, TLR4, and MyD88 in kidney tissue of mice determined by western blot. Model group compared with the control group, * p < 0.05, ** p < 0.01, *** p < 0.001; the remaining groups compared with the model group, # p < 0.05, ## p < 0.01.