Explore
 Validate
 Learn
Learn Western blot
 Immunocytochemistry
 Immunoprecipitation
Antibody data
- Antibody Data
- Antigen structure
- References [8]
- Comments [0]
- Validations
- Immunocytochemistry [6]
- Immunohistochemistry [1]
- Other assay [4]
Submit
Validation data
Reference
Comment
Report error
- Product number
- MA5-15143 - Provider product page

- Provider
- Invitrogen Antibodies
- Product name
- PDGFRB Monoclonal Antibody (G.290.3)
- Antibody type
- Monoclonal
- Antigen
- Other
- Description
- It is not recommended to aliquot this antibody.
- Reactivity
- Human, Mouse, Rat
- Host
- Rabbit
- Isotype
- IgG
- Antibody clone number
- G.290.3
- Vial size
- 100 μL
- Concentration
- 4 μg/mL
- Storage
- -20°C
Submitted references Improving hindlimb locomotor function by Non-invasive AAV-mediated manipulations of propriospinal neurons in mice with complete spinal cord injury.
Epigenetic Reprogramming of Cancer-Associated Fibroblasts Deregulates Glucose Metabolism and Facilitates Progression of Breast Cancer.
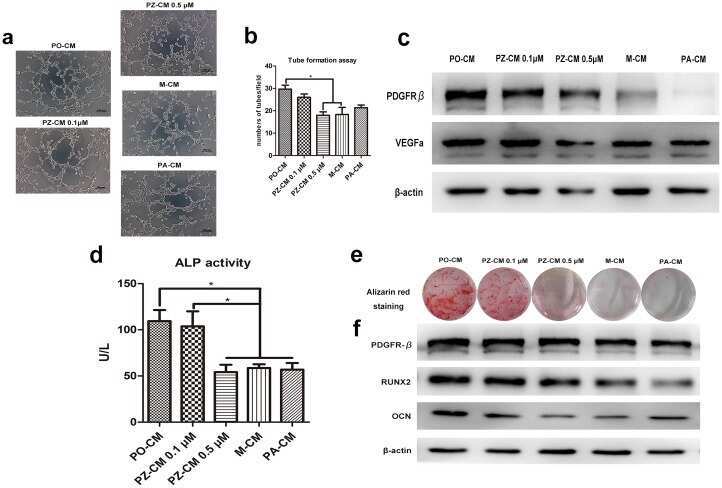
PDGF Modulates BMP2-Induced Osteogenesis in Periosteal Progenitor Cells.
Zoledronate suppressed angiogenesis and osteogenesis by inhibiting osteoclasts formation and secretion of PDGF-BB.
Osteogenic potential of alpha smooth muscle actin expressing muscle resident progenitor cells.
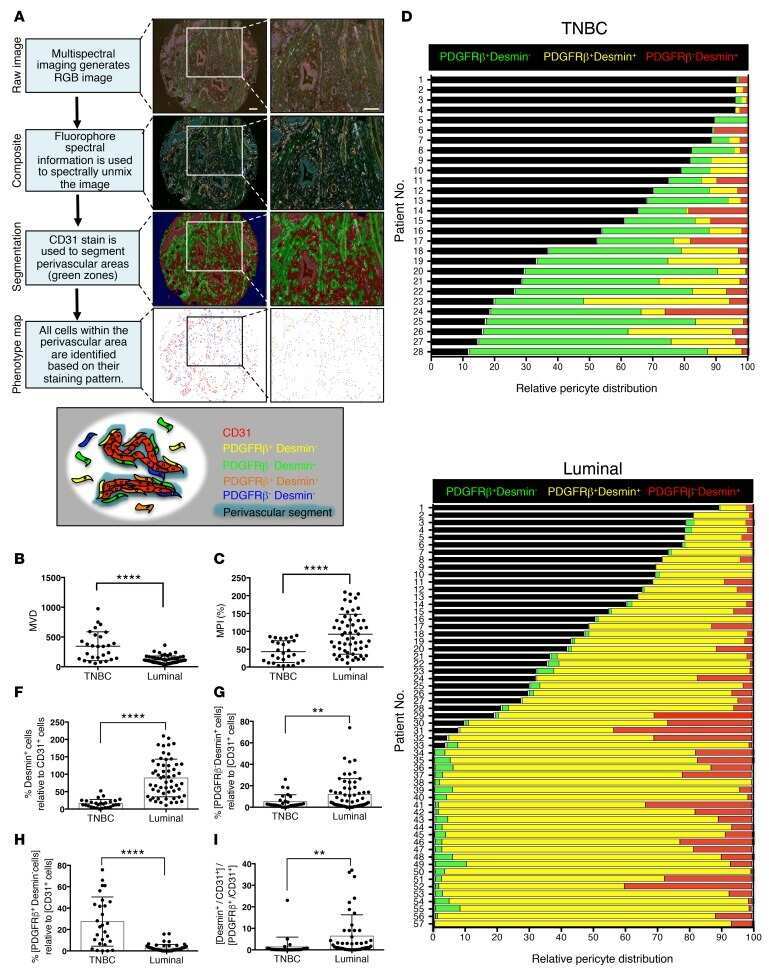
Heterogeneous perivascular cell coverage affects breast cancer metastasis and response to chemotherapy.
Bile acids induce hepatic differentiation of mesenchymal stem cells.
Hepatic stellate cells support hematopoiesis and are liver-resident mesenchymal stem cells.
Brommer B, He M, Zhang Z, Yang Z, Page JC, Su J, Zhang Y, Zhu J, Gouy E, Tang J, Williams P, Dai W, Wang Q, Solinsky R, Chen B, He Z
Nature communications 2021 Feb 3;12(1):781
Nature communications 2021 Feb 3;12(1):781
Epigenetic Reprogramming of Cancer-Associated Fibroblasts Deregulates Glucose Metabolism and Facilitates Progression of Breast Cancer.
Becker LM, O'Connell JT, Vo AP, Cain MP, Tampe D, Bizarro L, Sugimoto H, McGow AK, Asara JM, Lovisa S, McAndrews KM, Zielinski R, Lorenzi PL, Zeisberg M, Raza S, LeBleu VS, Kalluri R
Cell reports 2020 Jun 2;31(9):107701
Cell reports 2020 Jun 2;31(9):107701
PDGF Modulates BMP2-Induced Osteogenesis in Periosteal Progenitor Cells.
Wang X, Matthews BG, Yu J, Novak S, Grcevic D, Sanjay A, Kalajzic I
JBMR plus 2019 May;3(5):e10127
JBMR plus 2019 May;3(5):e10127
Zoledronate suppressed angiogenesis and osteogenesis by inhibiting osteoclasts formation and secretion of PDGF-BB.
Gao SY, Zheng GS, Wang L, Liang YJ, Zhang SE, Lao XM, Li K, Liao GQ
PloS one 2017;12(6):e0179248
PloS one 2017;12(6):e0179248
Osteogenic potential of alpha smooth muscle actin expressing muscle resident progenitor cells.
Matthews BG, Torreggiani E, Roeder E, Matic I, Grcevic D, Kalajzic I
Bone 2016 Mar;84:69-77
Bone 2016 Mar;84:69-77
Heterogeneous perivascular cell coverage affects breast cancer metastasis and response to chemotherapy.
Kim J, de Sampaio PC, Lundy DM, Peng Q, Evans KW, Sugimoto H, Gagea M, Kienast Y, Amaral NSD, Rocha RM, Eikesdal HP, Lønning PE, Meric-Bernstam F, LeBleu VS
JCI insight 2016 Dec 22;1(21):e90733
JCI insight 2016 Dec 22;1(21):e90733
Bile acids induce hepatic differentiation of mesenchymal stem cells.
Sawitza I, Kordes C, Götze S, Herebian D, Häussinger D
Scientific reports 2015 Aug 25;5:13320
Scientific reports 2015 Aug 25;5:13320
Hepatic stellate cells support hematopoiesis and are liver-resident mesenchymal stem cells.
Kordes C, Sawitza I, Götze S, Häussinger D
Cellular physiology and biochemistry : international journal of experimental cellular physiology, biochemistry, and pharmacology 2013;31(2-3):290-304
Cellular physiology and biochemistry : international journal of experimental cellular physiology, biochemistry, and pharmacology 2013;31(2-3):290-304
No comments: Submit comment
Supportive validation
- Submitted by
- Invitrogen Antibodies (provider)
- Main image

- Experimental details
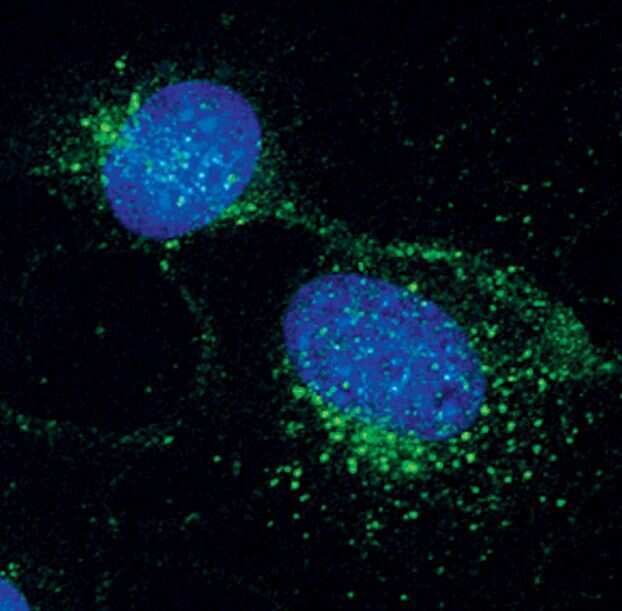
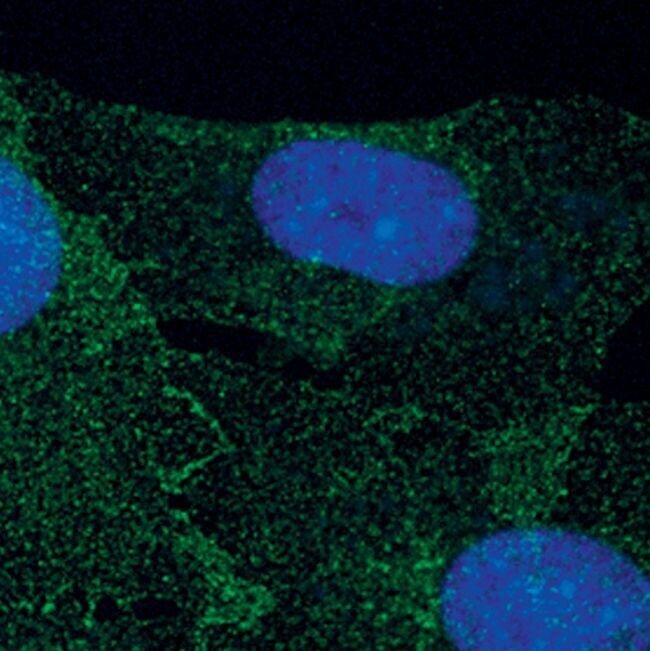
- Immunofluorescent analysis of PDGF Receptor beta in NIH/3T3 cells, PDGF-treated, using a PDGF Receptor beta monoclonal antibody (Product # MA5-15143) (green). DNA is labeled using a fluorescent blue dye.
- Submitted by
- Invitrogen Antibodies (provider)
- Main image

- Experimental details
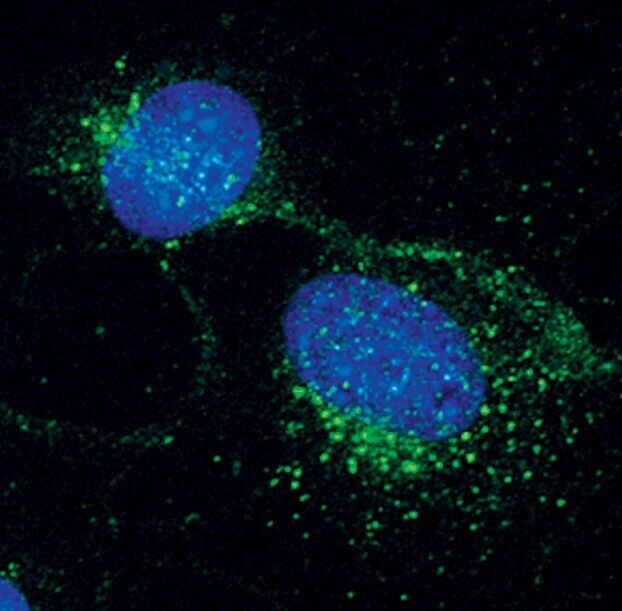
- Immunofluorescent analysis of PDGF Receptor beta in NIH/3T3 cells, PDGF-treated, using a PDGF Receptor beta monoclonal antibody (Product # MA5-15143) (green). DNA is labeled using a fluorescent blue dye.
- Submitted by
- Invitrogen Antibodies (provider)
- Main image
- Experimental details
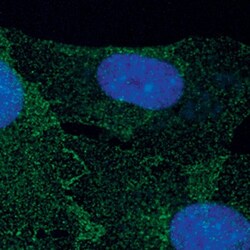
- Immunofluorescent analysis of PDGFRB using a monoclonal antibody (Product # MA5-15143).

- Submitted by
- Invitrogen Antibodies (provider)
- Main image

- Experimental details
- Immunofluorescent analysis of PDGF Receptor beta in NIH/3T3 cells, PDGF-treated, using a PDGF Receptor beta monoclonal antibody (Product # MA5-15143) (green). DNA is labeled using a fluorescent blue dye.

- Submitted by
- Invitrogen Antibodies (provider)
- Main image

- Experimental details
- Immunofluorescent analysis of PDGFRB using a monoclonal antibody (Product # MA5-15143).
- Submitted by
- Invitrogen Antibodies (provider)
- Main image
- Experimental details
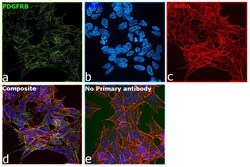
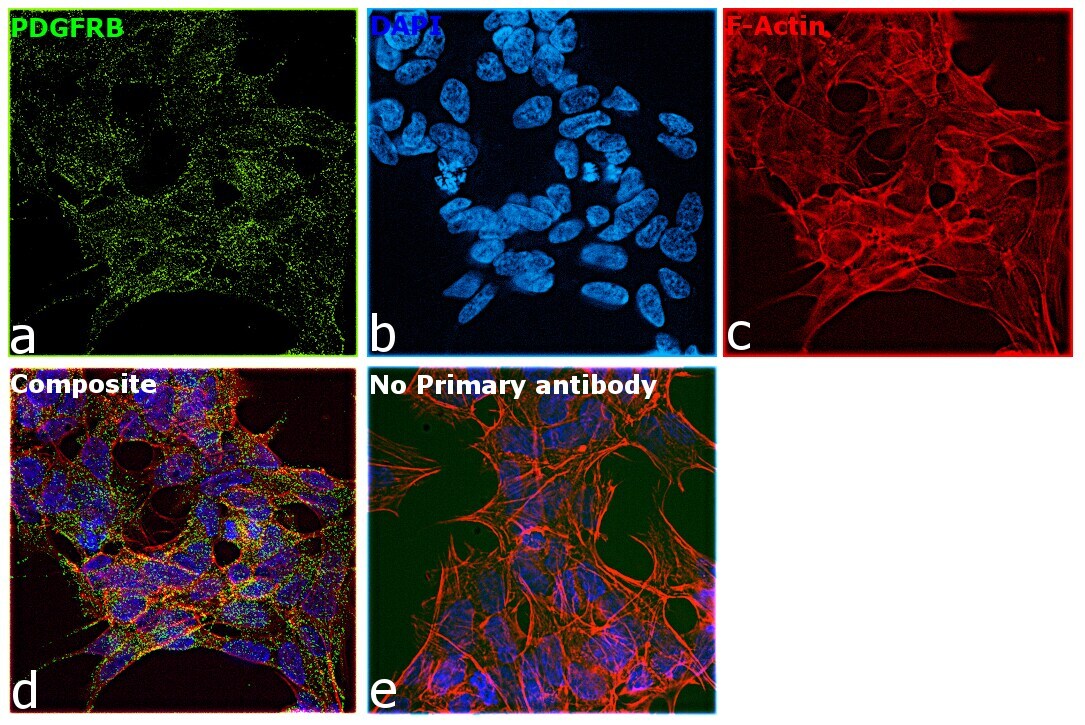
- Immunofluorescence analysis of PDGFRB was performed using 70% confluent log phase SH-SY5Y cells. The cells were fixed with 4% paraformaldehyde for 10 minutes, permeabilized with 0.1% Triton™ X-100 for 10 minutes, and blocked with 2% BSA for 45 minutes at room temperature. The cells were labeled with PDGFRB Monoclonal Antibody (G.290.3) (Product # MA5-15143, 1:100) in 0.1% BSA, incubated at 4 degree celsius overnight and then labeled with Donkey anti-Rabbit IgG (H+L) Highly Cross-Adsorbed Secondary Antibody, Alexa Fluor™ Plus 488 (Product # A32790, 1:2.000), for 45 minutes at room temperature (Panel a: Green). Nuclei (Panel b:Blue) were stained with ProLong™ Diamond Antifade Mountant with DAPI (Product # P36962). F-actin (Panel c: Red) was stained with Rhodamine Phalloidin (Product # R415, 1:300). Panel d represents the merged image showing membrane localization. Panel e represents control cells with no primary antibody to assess background. The images were captured at 40X magnification.
Supportive validation
- Submitted by
- Invitrogen Antibodies (provider)
- Main image
- Experimental details
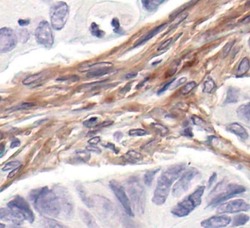
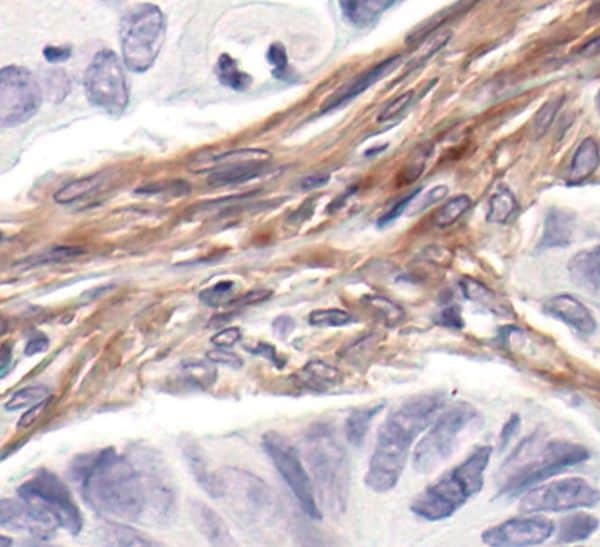
- Immunohistochemical analysis of PDGF Receptor beta in paraffin-embedded human colon carcinoma using a PDGF Receptor beta monoclonal antibody (Product # MA5-15143).
Supportive validation
- Submitted by
- Invitrogen Antibodies (provider)
- Main image
- Experimental details
- NULL
- Submitted by
- Invitrogen Antibodies (provider)
- Main image

- Experimental details
- NULL
- Submitted by
- Invitrogen Antibodies (provider)
- Main image
- Experimental details
- NULL
- Submitted by
- Invitrogen Antibodies (provider)
- Main image

- Experimental details
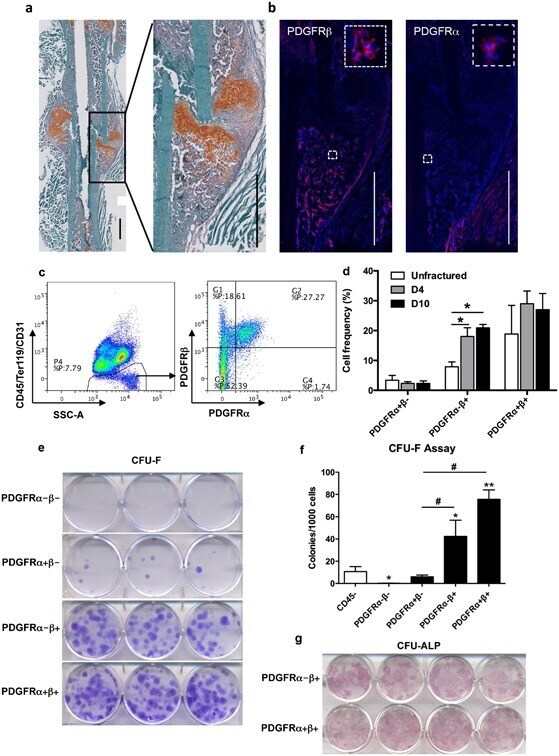
- Figure 1 Periosteal progenitor cells express PDGFRbeta during fracture repair. ( A,B ) Representative images of PDGFR expression in femurs 10 days post fracture. ( A ) Frozen section of fractured femur was stained with Safranin O/fast green. Callus area was magnified in the box. ( B ) Immunostaining of PDGFRbeta and PDGFRalpha on the same area. Boxed areas show higher magnification. (Red: Alexa Fluor 647; Blue: DAPI). Scale bars = 1000 mum. ( C ) Analysis of the frequency of PDGFR + cells in day 10 periosteal callus by flow cytometry. PDGFR expression was analyzed within (CD45, Ter119, CD31) - population. Representative dot plots of flow cytometry are shown. ( D ) Quantification of cell frequency at different time points following fracture. Both tibias from two mice were pooled for each sample, n = 3 samples for each group. ( E ) Representative images of CFU-F assay. Cells were sorted based on PDGFR expression from (CD45/Ter119/CD31) - population of intact periosteum. Colonies were stained with crystal violet. ( F ) Quantification of the number of CFU-F colonies from two independent sorting experiments. ( G ) Representative images of CFU-ALP assay. Sorted cells were induced to osteogenic differentiation for 14 days. Osteoblastic colonies were shown by ALP staining. Values are mean +- SD. * p < 0.05 versus control,** p < 0.01 versus control, # p < 0.01. Copyright (c) 2017 Wiley Periodicals, Inc.