Explore
 Validate
 Learn
LearnMA5-13854
antibody from Invitrogen Antibodies
Targeting: ABCB1
ABC20, CD243, CLCS, GP170, MDR1, P-gp, PGY1
 Western blot
 Immunocytochemistry
Antibody data
- Antibody Data
- Antigen structure
- References [24]
- Comments [0]
- Validations
- Immunocytochemistry [2]
- Flow cytometry [6]
- Other assay [9]
Submit
Validation data
Reference
Comment
Report error
- Product number
- MA5-13854 - Provider product page

- Provider
- Invitrogen Antibodies
- Product name
- P-Glycoprotein Monoclonal Antibody (F4)
- Antibody type
- Monoclonal
- Antigen
- Other
- Description
- MA5-13854 targets p170 in FACS, WB and ICC/IF applications and shows reactivity with Hamster and Human samples. This antibody does not react with mouse tissue in Western blot applications. The MA5-13854 immunogen is human and hamster drug-resistant viable cells followed by crude plasma membranes.
- Reactivity
- Human, Hamster
- Host
- Mouse
- Isotype
- IgG
- Antibody clone number
- F4
- Vial size
- 500 μL
- Concentration
- 0.2 mg/mL
- Storage
- 4°C
Submitted references The Ubiquitin E3 Ligase Nedd4 Regulates the Expression and Amyloid-β Peptide Export Activity of P-Glycoprotein.
Subcellular distribution of ezrin/radixin/moesin and their roles in the cell surface localization and transport function of P-glycoprotein in human colon adenocarcinoma LS180 cells.
LightSpot(®)-FL-1 Fluorescent Probe: An Innovative Tool for Cancer Drug Resistance Analysis by Direct Detection and Quantification of the P-glycoprotein (P-gp) on Monolayer Culture and Spheroid Triple Negative Breast Cancer Models.
Long noncoding RNA lncARSR confers resistance to Adriamycin and promotes osteosarcoma progression.
Duodenum Intestine-Chip for preclinical drug assessment in a human relevant model.
Detection and analysis of multiple biomarkers in ovarian cancer: clinical significance in diagnosis, treatment, and prognosis evaluation.
In situ molecular characterization of endoneurial microvessels that form the blood-nerve barrier in normal human adult peripheral nerves.
Combined effects of octreotide and cisplatin on the proliferation of side population cells from anaplastic thyroid cancer cell lines.
The Human Blood-Nerve Barrier Transcriptome.
Analysis of Cancer-Targeting Alkylphosphocholine Analogue Permeability Characteristics Using a Human Induced Pluripotent Stem Cell Blood-Brain Barrier Model.
Differentiation and characterization of human pluripotent stem cell-derived brain microvascular endothelial cells.
Influence of P-glycoprotein on brucine transport at the in vitro blood-brain barrier.
ABCB1 is predominantly expressed in human fetal neural stem/progenitor cells at an early development stage.
[The effect of resistance-related proteins on the prognosis and survival of patients with osteosarcoma: an immunohistochemical analysis].
Effect of the novel antipsychotic drug perospirone on P-glycoprotein function and expression in Caco-2 cells.
Efficacy of Hsp90 inhibition for induction of apoptosis and inhibition of growth in cervical carcinoma cells in vitro and in vivo.
Reversal of P-glycoprotein-mediated multidrug resistance with small interference RNA (siRNA) in leukemia cells.
ABCG2 overexpression in colon cancer cells resistant to SN38 and in irinotecan-treated metastases.
Involvement of extracellular signal-regulated kinase/mitogen-activated protein kinase pathway in multidrug resistance induced by HBx in hepatoma cell line.
Involvement of extracellular signal-regulated kinase/mitogen-activated protein kinase pathway in multidrug resistance induced by HBx in hepatoma cell line.
P-glycoprotein expression and distribution in the rat placenta during pregnancy.
Examination of the functional activity of P-glycoprotein in the rat placental barrier using rhodamine 123.
Differences in multidrug resistance phenotype and matrix metalloproteinases activity between endothelial cells from normal brain and glioma.
Dexamethasone modulation of multidrug transporters in normal tissues.
Chai AB, Callaghan R, Gelissen IC
International journal of molecular sciences 2022 Jan 18;23(3)
International journal of molecular sciences 2022 Jan 18;23(3)
Subcellular distribution of ezrin/radixin/moesin and their roles in the cell surface localization and transport function of P-glycoprotein in human colon adenocarcinoma LS180 cells.
Kobori T, Tameishi M, Tanaka C, Urashima Y, Obata T
PloS one 2021;16(5):e0250889
PloS one 2021;16(5):e0250889
LightSpot(®)-FL-1 Fluorescent Probe: An Innovative Tool for Cancer Drug Resistance Analysis by Direct Detection and Quantification of the P-glycoprotein (P-gp) on Monolayer Culture and Spheroid Triple Negative Breast Cancer Models.
Goisnard A, Daumar P, Dubois C, Aubel C, Roux M, Depresle M, Gauthier J, Vidalinc B, Penault-Llorca F, Mounetou E, Bamdad M
Cancers 2021 Aug 11;13(16)
Cancers 2021 Aug 11;13(16)
Long noncoding RNA lncARSR confers resistance to Adriamycin and promotes osteosarcoma progression.
Shen P, Cheng Y
Cell death & disease 2020 May 13;11(5):362
Cell death & disease 2020 May 13;11(5):362
Duodenum Intestine-Chip for preclinical drug assessment in a human relevant model.
Kasendra M, Luc R, Yin J, Manatakis DV, Kulkarni G, Lucchesi C, Sliz J, Apostolou A, Sunuwar L, Obrigewitch J, Jang KJ, Hamilton GA, Donowitz M, Karalis K
eLife 2020 Jan 14;9
eLife 2020 Jan 14;9
Detection and analysis of multiple biomarkers in ovarian cancer: clinical significance in diagnosis, treatment, and prognosis evaluation.
Ji R, Li Y, He C, Zhu X, He A, Lu Y
Gland surgery 2020 Dec;9(6):2175-2186
Gland surgery 2020 Dec;9(6):2175-2186
In situ molecular characterization of endoneurial microvessels that form the blood-nerve barrier in normal human adult peripheral nerves.
Ouyang X, Dong C, Ubogu EE
Journal of the peripheral nervous system : JPNS 2019 Jun;24(2):195-206
Journal of the peripheral nervous system : JPNS 2019 Jun;24(2):195-206
Combined effects of octreotide and cisplatin on the proliferation of side population cells from anaplastic thyroid cancer cell lines.
Li Z, Jiang X, Chen P, Wu X, Duan A, Qin Y
Oncology letters 2018 Sep;16(3):4033-4042
Oncology letters 2018 Sep;16(3):4033-4042
The Human Blood-Nerve Barrier Transcriptome.
Palladino SP, Helton ES, Jain P, Dong C, Crowley MR, Crossman DK, Ubogu EE
Scientific reports 2017 Dec 12;7(1):17477
Scientific reports 2017 Dec 12;7(1):17477
Analysis of Cancer-Targeting Alkylphosphocholine Analogue Permeability Characteristics Using a Human Induced Pluripotent Stem Cell Blood-Brain Barrier Model.
Clark PA, Al-Ahmad AJ, Qian T, Zhang RR, Wilson HK, Weichert JP, Palecek SP, Kuo JS, Shusta EV
Molecular pharmaceutics 2016 Sep 6;13(9):3341-9
Molecular pharmaceutics 2016 Sep 6;13(9):3341-9
Differentiation and characterization of human pluripotent stem cell-derived brain microvascular endothelial cells.
Stebbins MJ, Wilson HK, Canfield SG, Qian T, Palecek SP, Shusta EV
Methods (San Diego, Calif.) 2016 May 15;101:93-102
Methods (San Diego, Calif.) 2016 May 15;101:93-102
Influence of P-glycoprotein on brucine transport at the in vitro blood-brain barrier.
Xu DH, Yan M, Li HD, Fang PF, Liu YW
European journal of pharmacology 2012 Sep 5;690(1-3):68-76
European journal of pharmacology 2012 Sep 5;690(1-3):68-76
ABCB1 is predominantly expressed in human fetal neural stem/progenitor cells at an early development stage.
Yamamoto A, Shofuda T, Islam MO, Nakamura Y, Yamasaki M, Okano H, Kanemura Y
Journal of neuroscience research 2009 Sep;87(12):2615-23
Journal of neuroscience research 2009 Sep;87(12):2615-23
[The effect of resistance-related proteins on the prognosis and survival of patients with osteosarcoma: an immunohistochemical analysis].
Ozger H, Eralp L, Atalar AC, Toker B, Esberk Ateş L, Sungur M, Bilgiç B, Ayan I
Acta orthopaedica et traumatologica turcica 2009 Jan-Feb;43(1):28-34
Acta orthopaedica et traumatologica turcica 2009 Jan-Feb;43(1):28-34
Effect of the novel antipsychotic drug perospirone on P-glycoprotein function and expression in Caco-2 cells.
Zhou YG, Li KY, Li HD
European journal of clinical pharmacology 2008 Jul;64(7):697-703
European journal of clinical pharmacology 2008 Jul;64(7):697-703
Efficacy of Hsp90 inhibition for induction of apoptosis and inhibition of growth in cervical carcinoma cells in vitro and in vivo.
Schwock J, Pham NA, Cao MP, Hedley DW
Cancer chemotherapy and pharmacology 2008 Apr;61(4):669-81
Cancer chemotherapy and pharmacology 2008 Apr;61(4):669-81
Reversal of P-glycoprotein-mediated multidrug resistance with small interference RNA (siRNA) in leukemia cells.
Peng Z, Xiao Z, Wang Y, Liu P, Cai Y, Lu S, Feng W, Han ZC
Cancer gene therapy 2004 Nov;11(11):707-12
Cancer gene therapy 2004 Nov;11(11):707-12
ABCG2 overexpression in colon cancer cells resistant to SN38 and in irinotecan-treated metastases.
Candeil L, Gourdier I, Peyron D, Vezzio N, Copois V, Bibeau F, Orsetti B, Scheffer GL, Ychou M, Khan QA, Pommier Y, Pau B, Martineau P, Del Rio M
International journal of cancer 2004 May 10;109(6):848-54
International journal of cancer 2004 May 10;109(6):848-54
Involvement of extracellular signal-regulated kinase/mitogen-activated protein kinase pathway in multidrug resistance induced by HBx in hepatoma cell line.
Guan J, Chen XP, Zhu H, Luo SF, Cao B, Ding L
World journal of gastroenterology 2004 Dec 1;10(23):3522-7
World journal of gastroenterology 2004 Dec 1;10(23):3522-7
P-glycoprotein expression and distribution in the rat placenta during pregnancy.
Novotna M, Libra A, Kopecky M, Pavek P, Fendrich Z, Semecky V, Staud F
Reproductive toxicology (Elmsford, N.Y.) 2004 Aug-Sep;18(6):785-92
Reproductive toxicology (Elmsford, N.Y.) 2004 Aug-Sep;18(6):785-92
Examination of the functional activity of P-glycoprotein in the rat placental barrier using rhodamine 123.
Pavek P, Staud F, Fendrich Z, Sklenarova H, Libra A, Novotna M, Kopecky M, Nobilis M, Semecky V
The Journal of pharmacology and experimental therapeutics 2003 Jun;305(3):1239-50
The Journal of pharmacology and experimental therapeutics 2003 Jun;305(3):1239-50
Differences in multidrug resistance phenotype and matrix metalloproteinases activity between endothelial cells from normal brain and glioma.
Régina A, Demeule M, Bérubé A, Moumdjian R, Berthelet F, Béliveau R
Journal of neurochemistry 2003 Jan;84(2):316-24
Journal of neurochemistry 2003 Jan;84(2):316-24
Dexamethasone modulation of multidrug transporters in normal tissues.
Demeule M, Jodoin J, Beaulieu E, Brossard M, Béliveau R
FEBS letters 1999 Jan 15;442(2-3):208-14
FEBS letters 1999 Jan 15;442(2-3):208-14
No comments: Submit comment
Supportive validation
- Submitted by
- Invitrogen Antibodies (provider)
- Main image
- Experimental details
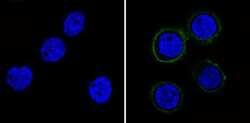
- Immunofluorescent analysis of p170 (green) showing staining in the membrane of A431 cells (right) compared to a negative control without primary antibody (left). Formalin-fixed cells were permeabilized with 0.1% Triton X-100 in TBS for 5-10 minutes and blocked with 3% BSA-PBS for 30 minutes at room temperature. Cells were probed with a p170 monoclonal antibody (Product # MA5-13854) in 3% BSA-PBS at a dilution of 1:20 and incubated overnight at 4 ºC in a humidified chamber. Cells were washed with PBST and incubated with a DyLight-conjugated secondary antibody in PBS at room temperature in the dark. F-actin (red) was stained with a fluorescent red phalloidin and nuclei (blue) were stained with Hoechst or DAPI. Images were taken at a magnification of 60x.
- Submitted by
- Invitrogen Antibodies (provider)
- Main image

- Experimental details
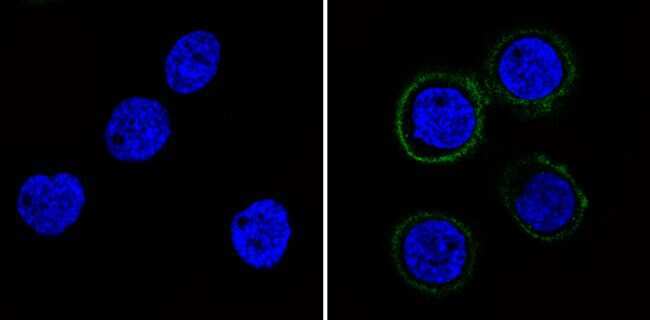
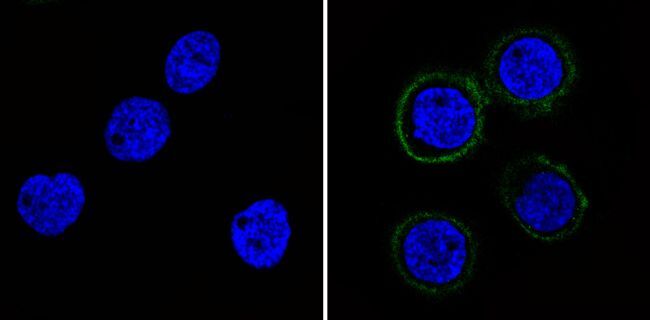
- Immunofluorescent analysis of p170 (green) showing staining in the membrane of A431 cells (right) compared to a negative control without primary antibody (left). Formalin-fixed cells were permeabilized with 0.1% Triton X-100 in TBS for 5-10 minutes and blocked with 3% BSA-PBS for 30 minutes at room temperature. Cells were probed with a p170 monoclonal antibody (Product # MA5-13854) in 3% BSA-PBS at a dilution of 1:20 and incubated overnight at 4 ºC in a humidified chamber. Cells were washed with PBST and incubated with a DyLight-conjugated secondary antibody in PBS at room temperature in the dark. F-actin (red) was stained with a fluorescent red phalloidin and nuclei (blue) were stained with Hoechst or DAPI. Images were taken at a magnification of 60x.
Supportive validation
- Submitted by
- Invitrogen Antibodies (provider)
- Main image
- Experimental details
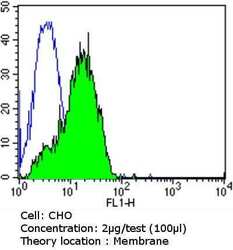
- Flow cytometry analysis of p170 in CHO cells (green) compared to an isotype control (blue). Cells were harvested, adjusted to a concentration of 1-5x10^6 cells/mL, fixed with 2% paraformaldehyde and washed with PBS. Cells were blocked with a 2% solution of BSA-PBS for 30 min at room temperature and incubated with a p170 monoclonal antibody (Product # MA5-13854) at a dilution of 2 µg/test for 60 min at room temperature. Cells were then incubated for 40 min at room temperature in the dark using a Dylight 488-conjugated goat anti-mouse IgG (H+L) secondary antibody and re-suspended in PBS for FACS analysis.

- Submitted by
- Invitrogen Antibodies (provider)
- Main image

- Experimental details
- Flow cytometry analysis of p170 in Jurkat cells (green) compared to an isotype control (blue). Cells were harvested, adjusted to a concentration of 1-5x10^6 cells/mL, fixed with 2% paraformaldehyde and washed with PBS. Cells were blocked with a 2% solution of BSA-PBS for 30 min at room temperature and incubated with a p170 monoclonal antibody (Product # MA5-13854) at a dilution of 2 µg/test for 60 min at room temperature. Cells were then incubated for 40 min at room temperature in the dark using a Dylight 488-conjugated goat anti-mouse IgG (H+L) secondary antibody and re-suspended in PBS for FACS analysis.

- Submitted by
- Invitrogen Antibodies (provider)
- Main image
- Experimental details
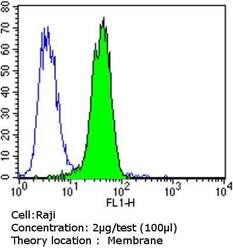
- Flow cytometry analysis of p170 in Raji cells (green) compared to an isotype control (blue). Cells were harvested, adjusted to a concentration of 1-5x10^6 cells/mL, fixed with 2% paraformaldehyde and washed with PBS. Cells were blocked with a 2% solution of BSA-PBS for 30 min at room temperature and incubated with a p170 monoclonal antibody (Product # MA5-13854) at a dilution of 2 µg/test for 60 min at room temperature. Cells were then incubated for 40 min at room temperature in the dark using a Dylight 488-conjugated goat anti-mouse IgG (H+L) secondary antibody and re-suspended in PBS for FACS analysis.

- Submitted by
- Invitrogen Antibodies (provider)
- Main image
- Experimental details
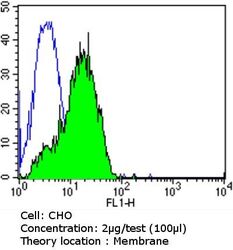
- Flow cytometry analysis of p170 in CHO cells (green) compared to an isotype control (blue). Cells were harvested, adjusted to a concentration of 1-5x10^6 cells/mL, fixed with 2% paraformaldehyde and washed with PBS. Cells were blocked with a 2% solution of BSA-PBS for 30 min at room temperature and incubated with a p170 monoclonal antibody (Product # MA5-13854) at a dilution of 2 µg/test for 60 min at room temperature. Cells were then incubated for 40 min at room temperature in the dark using a Dylight 488-conjugated goat anti-mouse IgG (H+L) secondary antibody and re-suspended in PBS for FACS analysis.

- Submitted by
- Invitrogen Antibodies (provider)
- Main image
- Experimental details
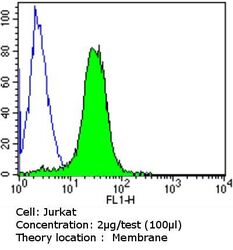
- Flow cytometry analysis of p170 in Jurkat cells (green) compared to an isotype control (blue). Cells were harvested, adjusted to a concentration of 1-5x10^6 cells/mL, fixed with 2% paraformaldehyde and washed with PBS. Cells were blocked with a 2% solution of BSA-PBS for 30 min at room temperature and incubated with a p170 monoclonal antibody (Product # MA5-13854) at a dilution of 2 µg/test for 60 min at room temperature. Cells were then incubated for 40 min at room temperature in the dark using a Dylight 488-conjugated goat anti-mouse IgG (H+L) secondary antibody and re-suspended in PBS for FACS analysis.

- Submitted by
- Invitrogen Antibodies (provider)
- Main image

- Experimental details
- Flow cytometry analysis of p170 in Raji cells (green) compared to an isotype control (blue). Cells were harvested, adjusted to a concentration of 1-5x10^6 cells/mL, fixed with 2% paraformaldehyde and washed with PBS. Cells were blocked with a 2% solution of BSA-PBS for 30 min at room temperature and incubated with a p170 monoclonal antibody (Product # MA5-13854) at a dilution of 2 µg/test for 60 min at room temperature. Cells were then incubated for 40 min at room temperature in the dark using a Dylight 488-conjugated goat anti-mouse IgG (H+L) secondary antibody and re-suspended in PBS for FACS analysis.

Supportive validation
- Submitted by
- Invitrogen Antibodies (provider)
- Main image
- Experimental details
- NULL

- Submitted by
- Invitrogen Antibodies (provider)
- Main image
- Experimental details
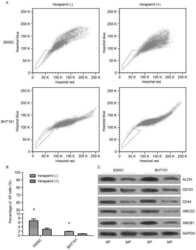
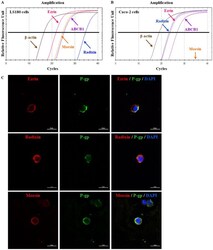
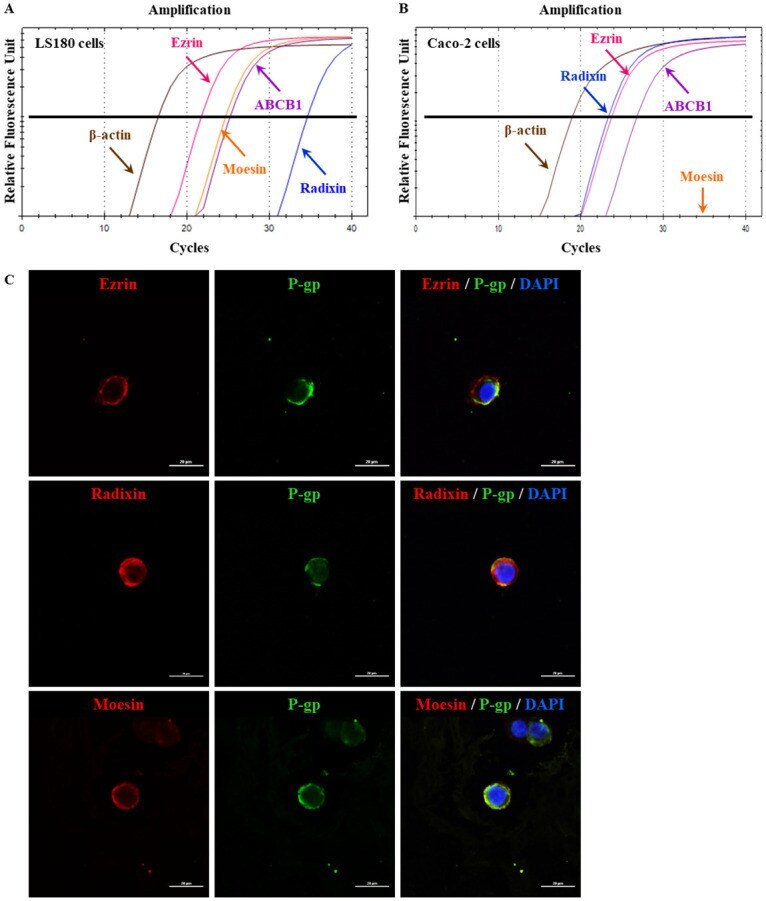
- Fig 1 Gene expression pattern and subcellular localization of ezrin, radixin, and moesin (ERM) and P-gp in LS180 cells. (A, B) Representative amplification curves of ezrin, radixin, moesin, and ABCB1 together with that of beta-actin (internal control) in LS180 and Caco-2 cells as determined by real-time quantitative reverse transcription-polymerase chain reaction. (C) Confocal laser scanning microscopy analysis of ERM and P-gp to visualize the subcellular distribution in LS180 cells. In a three-dimensional reconstruction of optically sectioned LS180 cells, ezrin, radixin, and moesin (red) were detected on the plasma membrane and preferentially colocalized with P-gp (green) on the plasma membrane. Scale bars: 20 mum. All data are representative of at least three independent experiments.
- Submitted by
- Invitrogen Antibodies (provider)
- Main image

- Experimental details
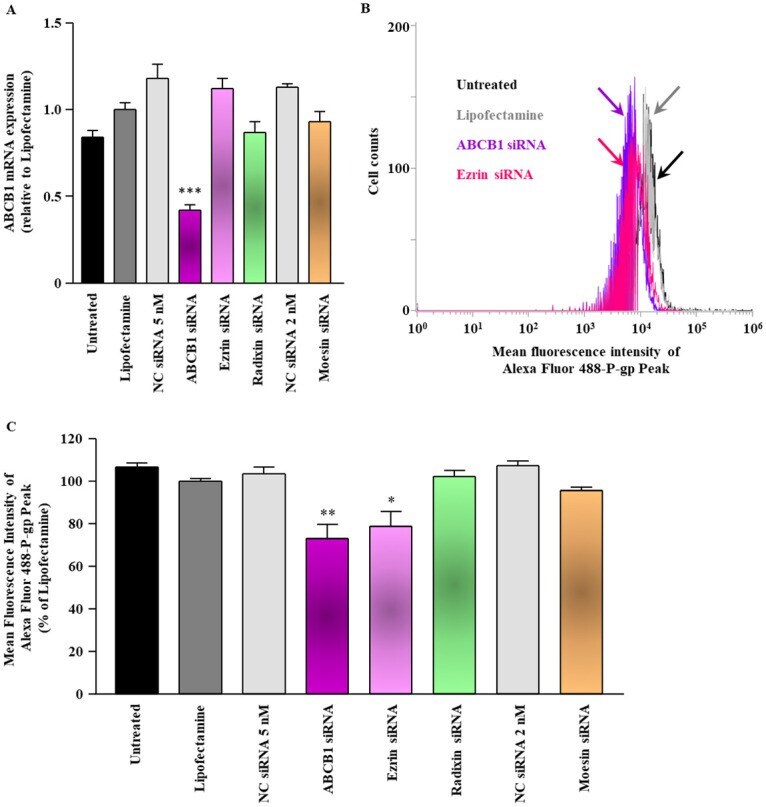
- 10.1371/journal.pone.0250889.g005 Fig 5 Effect of siRNAs targeting ezrin, radixin, or moesin on the ABCB1 mRNA and P-gp expression on the surface of LS180 cells under the acidic condition. Cells were treated with the transfection medium (Untreated), transfection reagent (Lipofectamine), nontargeting control (NC) siRNA, and specific siRNAs for ABCB1, ezrin, radixin, or moesin and then incubated for 3 days under the acidic condition with pH 6.5. (A) The expression of ABCB1 mRNA in cells treated with each siRNA relative to that in cells treated with the transfection reagent alone was determined by real-time quantitative reverse transcription-polymerase chain reaction. n = 3, *** p < 0.001 vs. Lipofectamine. (B) An overlay of the representative histograms for the expression peak of Alexa Fluor 488-labeled P-gp on the surface of the plasma membrane of LS180 cells treated with the transfection medium (Untreated; black line), transfection reagent (Lipofectamine; gray line), ABCB1 siRNA (purple line), and ezrin siRNA (pink line), as measured by flow cytometry. The calculated relative mean fluorescence intensity peaks of P-gp on the surface of the plasma membrane for all the treatments are shown in (C). n = 4, ** p < 0.01, * p < 0.05 vs. Lipofectamine. All data are expressed as the mean +- SEM and were analyzed by a one-way ANOVA followed by Tukey's test.
- Submitted by
- Invitrogen Antibodies (provider)
- Main image
- Experimental details
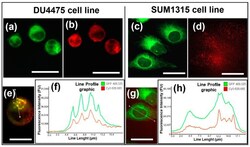
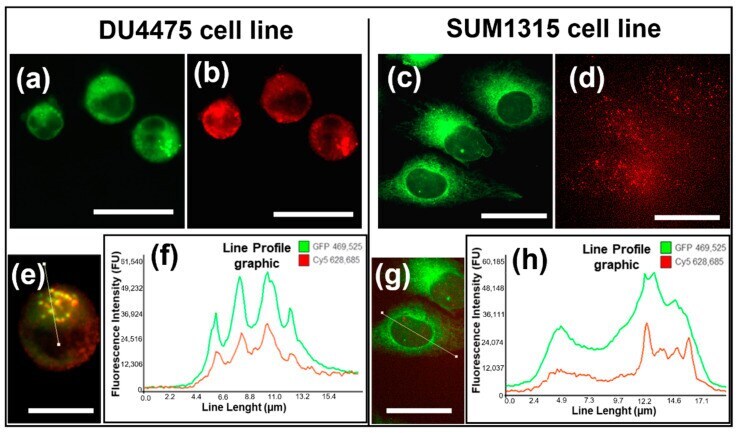
- Figure 4 P-gp targeting comparison between LightSpot (r) -FL-1 staining and anti-P-gp immunostaining on DU4475 and SUM1315 TNBC cell lines. Co-staining was carried out, combining LightSpot (r) -FL-1 with anti-P-gp immunostaining. Pictures of LightSpot (r) -FL-1 labeling (green GFP signal) are presented for DU4475 ( a ) and SUM1315 cells ( c ). Similarly, immunostaining pictures (red Cy5 signal) are presented for DU4475 ( b ) and SUM1315 cells ( d ). Merged pictures are presented for DU4475 ( e ) and SUM1315 ( g ) cells. A line profile was drawn on merged pictures, superimposing both LightSpot (r) -FL-1 and anti-Pgp immunostaining signals. The fluorescence intensity spectra across the line profile are shown with the line profile graphic on DU4475 cells ( f ) and SUM135 cells ( h ). All pictures were acquired with the Cytation(tm)3 MV (BioTek (r) , M = 4 X, scale bar = 25 um).
- Submitted by
- Invitrogen Antibodies (provider)
- Main image
- Experimental details
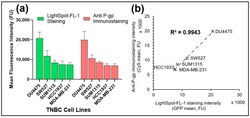
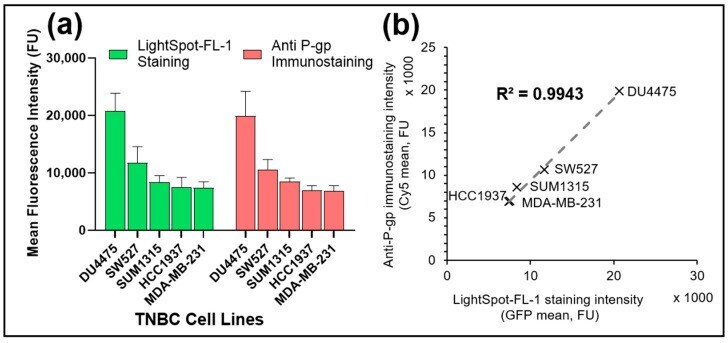
- Figure 5 P-gp level quantification comparison after co-staining with LightSpot (r) -FL-1 staining and anti-P-gp immunostaining on several triple-negative breast cancer cell lines. Co-staining was carried out by combining LightSpot (r) -FL-1 staining with anti-P-gp immunostaining on five different TNBC cell lines i.e., DU4475, SW527, HCC1937, MDA-MB-231 and SUM1315. For each cell line, ( a ) both LightSpot-FL staining (green bars) and anti-P-gp immunostaining (red bars) fluorescence intensities were measured using the Gen5 software (BioTek (r) ). Correlation between both stainings was evaluated ( b ) with the correlation line and the R 2 coefficient of determination.
- Submitted by
- Invitrogen Antibodies (provider)
- Main image
- Experimental details
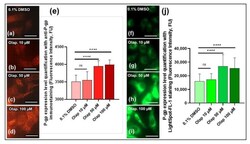
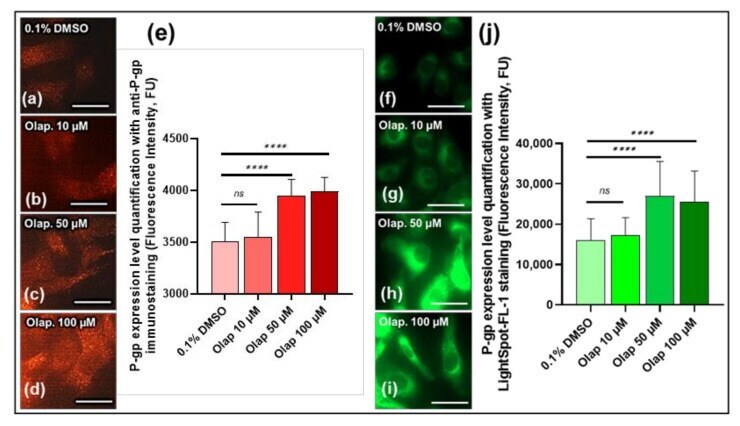
- Figure 6 Comparison between anti-P-gp immunostaining and LightSpot (r) -FL-1 fluorescent probe staining for P-gp level expression measure on the SUM1315 cell line in monolayer culture condition after increased Olaparib concentration exposure. SUM1315 cells were treated with 10, 50 or 100 uM Olaparib for 3 h. Cells were then fixed and immunostained, combining anti-P-gp mouse antibody (F4 clone) and a goat anti-mouse secondary antibody, coupled to Alexa Fluor(tm) 568 (red signal) for each dose ( a - d ), and the signal was quantified using Gen5 software (BioTek (r) ) ( e ). LightSpot (r) -FL-1 staining (green signal) was also utilized for the same experimental conditions ( f - i ), and quantified using Gen5 software ( j ). All pictures were acquired with the Cytation(tm)3 MV (BioTek (r) , M = 4 X, scale bar = 50 um). Significances between conditions were indicated as ns (not significant; p > 0.05), and **** p < 0.0001.
- Submitted by
- Invitrogen Antibodies (provider)
- Main image

- Experimental details
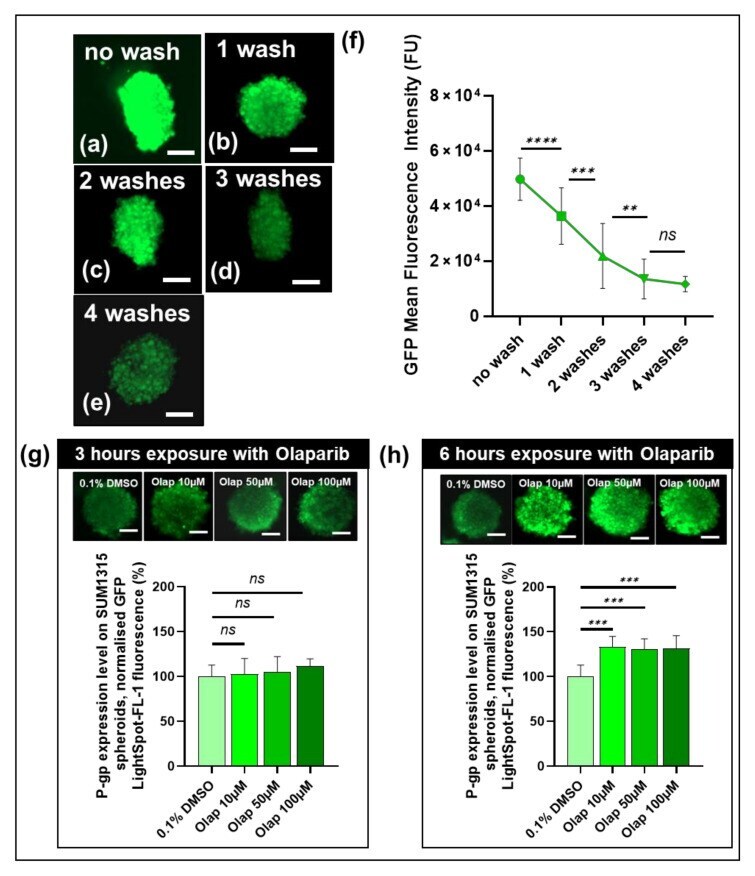
- Figure 7 Development of LightSpot (r) -FL-1 staining on SUM1315 spheroids. SUM1315 spheroids (about 200 um diameter) were incubated with LightSpot (r) -FL-1 at 1 uM and washed several times in D-PBS. Before and between each wash of 30 min, pictures of spheroids were made ( a ) for no wash, ( b ) for 1 wash, ( c ) for 2 washes, ( d ) for 3 washes, and ( e ) for 4 washes. For each wash number condition, spheroid global fluorescent intensity was quantified using Gen5 software (BioTek (r) ) ( f ). Otherwise, SUM1315 spheroids were exposed with increasing Olaparib concentrations for 3 h ( g ) or for 6 h ( h ). After the LightSpot (r) -FL-1 staining, pictures were made for each dose for 3 ( g ) and 6 h ( h ) of Olaparib exposure. For each condition, spheroid global LightSpot (r) -FL-1 fluorescent intensity was quantified for 3 h of Olaparib-exposed spheroids ( g ) and for 6 h Olaparib-exposed spheroids ( h ). All pictures were acquired with the Cytation(tm)3 MV (BioTek (r) , M = 4 X, scale bar = 50 um). Significances between conditions were indicated as ns (not significant; p > 0.05), ** p < 0.01, *** p < 0.001, and **** p < 0.0001.
- Submitted by
- Invitrogen Antibodies (provider)
- Main image

- Experimental details
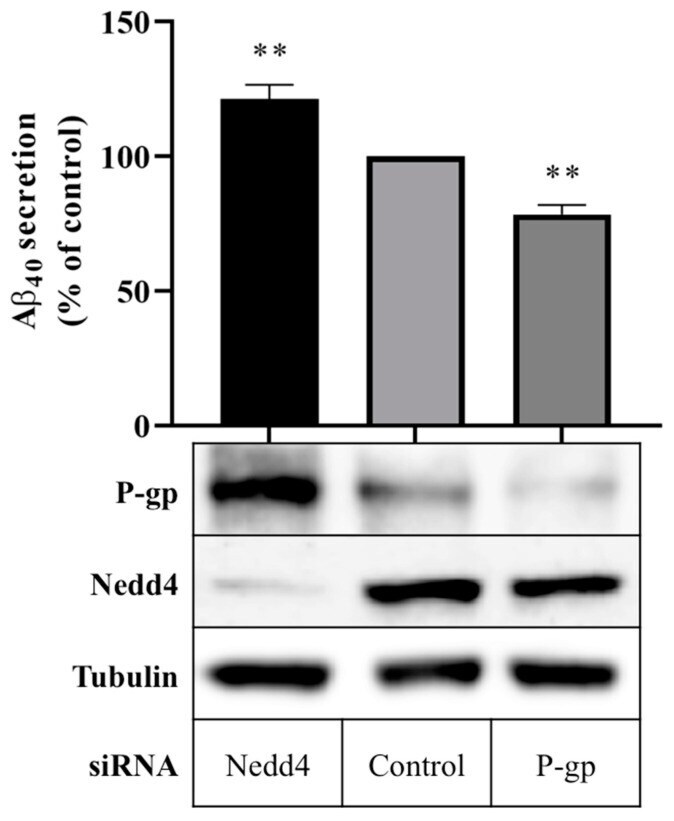
- Figure 2 Effect of Nedd4 knockdown on Abeta export from CHO-APP cells. CHO-APP cells were transfected with Nedd4 or P-gp siRNA or universal control. Following the initial 24 h transfection period, transfection media was changed to fresh full culture media. After a further 24 h incubation period, cell media were collected for quantification of Abeta 40 content by ELISA, and cells were harvested for Western blot analysis. The column graph shows the relative secretion of Abeta 40 peptides into media over 24 h compared with control. Immunoblots confirm the knockdown of Nedd4 and enhancement of P-gp protein expression in Nedd4-siRNA treated cells compared with control. Tubulin was used as a loading control. Data reflect the mean +- SEM of three independent experiments. ** p
- Submitted by
- Invitrogen Antibodies (provider)
- Main image
- Experimental details
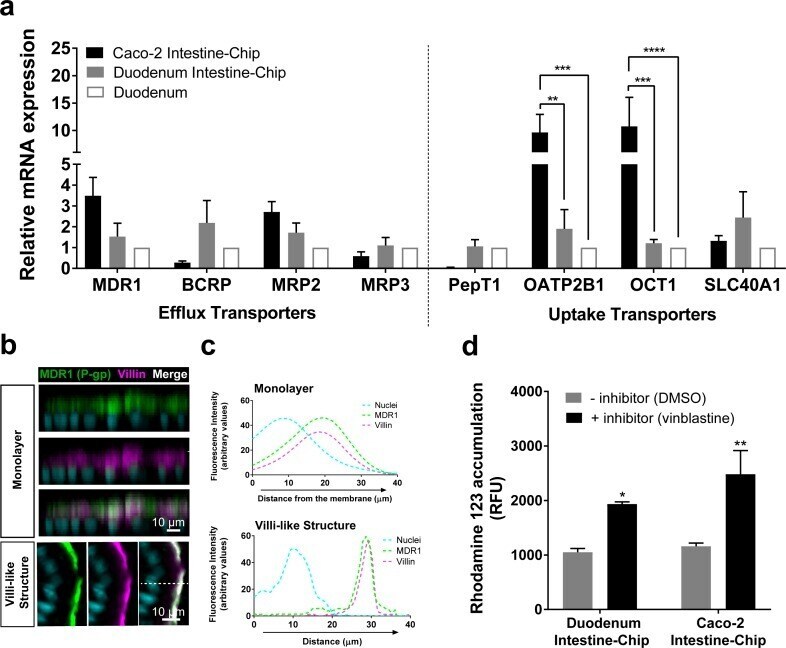
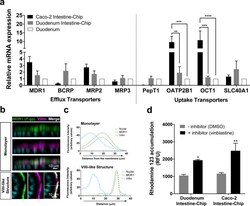
- Figure 4. Duodenum Intestine-Chip shows the presence of major intestinal drug transporters and correct localization and function of efflux pump MDR1 (P-gp). ( a ) Comparison of the relative average gene expression levels of drug efflux (MDR1, BCRP, MRP2, MRP3) and uptake (PEPT1, OATP2B1, OCT1, SLC40A1) transporters in Caco-2 Intestine-Chip, Duodenum Intestine-Chip, both assessed on day 8 of culture, and RNA isolated directly from the duodenal tissue (Duodenum). The results show that Duodenum Intestine-Chip expresses drug transport proteins at the levels close to human duodenal tissue. Note, the expression of OATP2B1 and OCT1 in Caco-2 Intestine-Chip were significantly higher than in human duodenum while the difference between Duodenum Intestine-Chip and adult duodenum is not significant. Each value represents average gene expression +- s.e.m (error bars) from three independent experiments, each involving Duodenum Intestine-Chip established from a tissue of three different donors (three chips/donor), RNA tissue from three independent biological specimens, and Caco-2 Intestine-Chip (three chips). Values are shown relative to the duodenal tissue expressed as 1, two-way ANOVA, ****p