Explore
 Validate
 Learn
LearnPA5-28801
antibody from Invitrogen Antibodies
Targeting: ABCB1
ABC20, CD243, CLCS, GP170, MDR1, P-gp, PGY1
 Western blot
 Other assay
Antibody data
- Antibody Data
- Antigen structure
- References [2]
- Comments [0]
- Validations
- Other assay [3]
Submit
Validation data
Reference
Comment
Report error
- Product number
- PA5-28801 - Provider product page

- Provider
- Invitrogen Antibodies
- Product name
- P-Glycoprotein Polyclonal Antibody
- Antibody type
- Polyclonal
- Antigen
- Synthetic peptide
- Description
- Recommended positive controls: HepG2, HepG2 membrane fraction extract, unboild HepG2, unboiled HepG2 membrane fraction extract. Store product as a concentrated solution. Centrifuge briefly prior to opening the vial.
- Reactivity
- Human
- Host
- Rabbit
- Isotype
- IgG
- Vial size
- 100 μL
- Concentration
- 1.58 mg/mL
- Storage
- Store at 4°C short term. For long term storage, store at -20°C, avoiding freeze/thaw cycles.
Submitted references Interplay Between Chemotherapy-Activated Cancer Associated Fibroblasts and Cancer Initiating Cells Expressing CD44v6 Promotes Colon Cancer Resistance.
Metformin reverses multidrug resistance in human hepatocellular carcinoma Bel‑7402/5‑fluorouracil cells.
Ghatak S, Hascall VC, Karamanos N, Markwald RR, Misra S
Frontiers in oncology 2022;12:906415
Frontiers in oncology 2022;12:906415
Metformin reverses multidrug resistance in human hepatocellular carcinoma Bel‑7402/5‑fluorouracil cells.
Ling S, Tian Y, Zhang H, Jia K, Feng T, Sun D, Gao Z, Xu F, Hou Z, Li Y, Wang L
Molecular medicine reports 2014 Dec;10(6):2891-7
Molecular medicine reports 2014 Dec;10(6):2891-7
No comments: Submit comment
Supportive validation
- Submitted by
- Invitrogen Antibodies (provider)
- Main image

- Experimental details
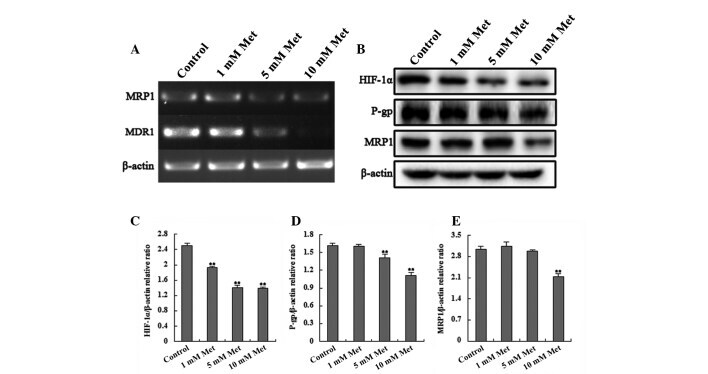
- Figure 5 Met affects the expression of HIF-1alpha, MDR1/P-gp and MRP1. (A) Reverse transcription-polymerase chain reaction analysis of MDR1 and MRP1 expression in the different treatment groups. (B) Western blot analysis of HIF-1alpha, MDR1 and MRP1 in the different treatment groups. (C-E) Relative density of the western blotting bands demonstrated that levels of HIF-1alpha, P-gp and MRP1 decreased with increasing concentrations of Met in a dose-dependent manner, with a statistically significant difference between the treatments and the controls ( ** P
- Submitted by
- Invitrogen Antibodies (provider)
- Main image
- Experimental details
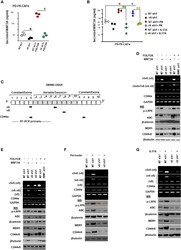
- Figure 5 FOLFOX induces CD44v6 expression, which is critically regulated by the WNT pathway stimulated by PN and/or IL17A. (A) , Confirmation of involvement of CD44v6 expression in regulating WNT3A production was assessed in PD-FR CAFs by examining the effects of blockade of CD44v6 using specific shRNAs on 10 4 SW480-FR/CAFs in the absence and presence of FOLFOX. The effects were evaluated by measuring secreted WNT3A in cultures by ELISA. (B) , Involvement of CD44v6 in regulating PN and IL17A induced WNT3A production was assessed in PD-FR CAFs by examining the effects of blockade of CD44v6 using specific shRNAs in the absence and presence of PN or IL17A. The effects were evaluated by measuring secreted WNT3A in cultures by ELISA. (C) , Schematic illustration of the CD44 gene is shown. Both constitutive (C) and variable (v) exons are represented. The PCR primers used to amplify CD44 variable (v) and standard (s) isoforms are shown as black arrows. The primers for both the v6 and standard isoforms (CD44s) predominantly generate one PCR product [C5v6 (v6) for CD44v6, and C5C7 for CD44s], whereas the primers for the v8 variants amplify two splice variants C5v6v7v8 (v6-v8) and C5v8 (v8). These PCR products are depicted in panels (D-G) experiments. The primers for both the v6 and standard isoforms predominantly generate one PCR product [c5v6 (v6)], whereas the primers for the v8 variants amplify two splice variants C5v6v7v8 (v6-v8), and C5v8 (v8). (D, E) , WNT3A shRNA, or CD44v6 sh
- Submitted by
- Invitrogen Antibodies (provider)
- Main image

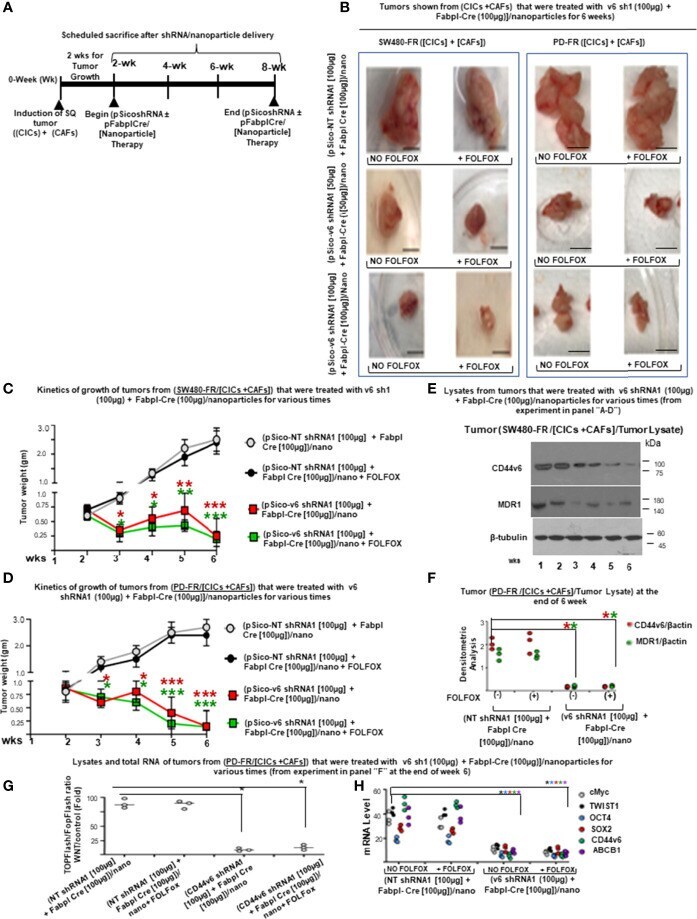
- Experimental details
- Tissue specific knockdown of CD44v6 by pFabpl-Cre inhibits subcutaneous (SQ) tumor growth of implanted CICs plus CAFs from SW480-FR/SQ tumors and from PD-FR/SQ tumors. (A) , Timeline is shown for pSico-v6-shRNA/Nano particle treatment with and without pFabpl-Cre/Nano in xenograft tumors derived from CICs plus CAFs from SW480-FR/SQ tumors and PD-FR/SQ tumors. (B) , The dependence of tumors derived from CICs and CAFs on CD44v6 was evaluated in vivo. 2 x 10⁴ FACS sorted CAM(+)CD44v6(+)CD133(+)ALDH1(+) CICs and 6 x 10⁴ CAFs (EpCAM [-]/PDGFR-alpha were injected into mice. When tumors reached to approximately 0.3 cm3 in volume, treatment was initiated. Detailed treatment procedure is in Methods. Seven immunocompromised mice per group were used. Mice were weighed every other day, and the tumor weights were measured every week for 4 weeks. Representative tumors following sacrifice from three experiments are shown from mice treated as indicated in the schedule of treatment (A) . (C, D) , Kinetics of relative tumor weights with time are shown during in vivo SQ tumor growth at the indicated weeks that were generated by CICs plus CAFs from SW480-FR/SQ tumors (C) and from PD-FR/SQ tumors (D) injected (i.p.) with pSico-NT shRNA/Nano, pSico-v6 shRNA/Nano, and (pSico-v6 sh plus pFabpl-Cre)/Nano. Treatments were performed at weeks (wks) 2, 3, 4, and 5 and tumor growth was measured at wks 3, 4, 5, and 6 after treatments. (E) , Western blot analyses using CD44v6, MDR1 and beta-catenin antibodie