 Explore
 Validate
 Learn
Learn Western blot
Antibody data
- Antibody Data
- Antigen structure
- References [1]
- Comments [0]
- Validations
- Western blot [1]
- Immunocytochemistry [1]
- Other assay [3]
Submit
Validation data
Reference
Comment
Report error
- Product number
- MA1-115 - Provider product page

- Provider
- Invitrogen Antibodies
- Product name
- Huntingtin Monoclonal Antibody (3-19)
- Antibody type
- Monoclonal
- Antigen
- Synthetic peptide
- Description
- MA1-115 has been successfully used in immunofluorescence, immunohistochemistry, Western Blot, and ELISA applications with human and mouse samples.
- Antibody clone number
- 19-Mar
- Concentration
- 1 mg/mL
Submitted references Oxyresveratrol Inhibits IL-1β-Induced Inflammation via Suppressing AKT and ERK1/2 Activation in Human Microglia, HMC3.
Hankittichai P, Lou HJ, Wikan N, Smith DR, Potikanond S, Nimlamool W
International journal of molecular sciences 2020 Aug 22;21(17)
International journal of molecular sciences 2020 Aug 22;21(17)
No comments: Submit comment
Supportive validation
- Submitted by
- Invitrogen Antibodies (provider)
- Main image

- Experimental details
- Western blot analysis of Htt neo-epitope 513 was performed by loading 20 µg of lysate either with overexpressed recombinant HTT fragment (lane 1) or without (lane 2) onto a 4-20% Tris-HCl polyacrylamide gel. Proteins were transferred to a PVDF membrane and blocked with 5% BSA/TBST for at least 1 hour. The membrane was probed with a Htt neo-epitope 513 monoclonal antibody (Product # MA1-115) at a dilution of 1:500 overnight at 4°C on a rocking platform, washed in TBS-0.1%Tween 20, and probed with a goat anti-mouse IgG-HRP secondary antibody (Product # 32430) at a dilution of 1:300 for at least one hour. Chemiluminescent detection was performed using SuperSignal West Pico (Product # 34087).

Supportive validation
- Submitted by
- Invitrogen Antibodies (provider)
- Main image

- Experimental details
- Immunofluorescence analysis of HTT Antibody (3-19) was performed using 70% confluent log phase U-87 MG cells. The cells were fixed with 4% paraformaldehyde for 10 minutes, permeabilized with 0.1% Triton™ X-100 for 10 minutes, and blocked with 1% BSA for 1 hour at room temperature. The cells were labeled with HTT (3-19) Mouse Monoclonal Antibody (Product # MA1-115) at 2 µg/mL in 0.1% BSA and incubated for 3 hours at room temperature and then labeled with Goat anti-Mouse IgG (H+L) Superclonal™ Secondary Antibody, Alexa Fluor® 488 conjugate (Product # A28175) at a dilution of 1:2000 for 45 minutes at room temperature (Panel a: green). Nuclei (Panel b: blue) were stained with SlowFade® Gold Antifade Mountant with DAPI (Product # S36938). F-actin (Panel c: red) was stained with Alexa Fluor® 555 Rhodamine Phalloidin (Product # R415, 1:300). Panel d represents the merged image showing cytoplasmic localization. Panel e shows the control without primary antibody. The images were captured at 60X magnification.

Supportive validation
- Submitted by
- Invitrogen Antibodies (provider)
- Main image
- Experimental details
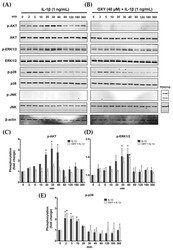
- Figure 4 ( A ) The phosphorylation status of PI3K/AKT kinase and MAPKs, including ERK1/2, p38, and JNK, of IL-1beta-induced HMC3 cells at 0 to 360 min; ( B ) the effects of OXY on suppressing the phosphorylation of AKT, ERK1/2, p38, and JNK after IL-1beta activation; total proteins were detected and used as an internal control; ( C ) quantitative analysis for phosphorylated AKT (Ser473); ( D ) quantitative analysis for phosphorylated ERK1/2; ( E ) quantitative analysis for phosphorylated p38. Data are represented as mean +- SD of three independent experiments; # p < 0.05 (compared to the IL-1beta-treated group after 0 min induction) or * p < 0.05 (compared to the OXY + IL-1beta-treated group after 0 min).

- Submitted by
- Invitrogen Antibodies (provider)
- Main image
- Experimental details
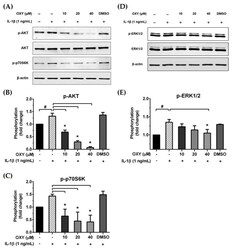
- Figure 5 ( A and D ) Western blot analysis for the inhibitory effects of OXY on the phosphorylation of AKT, p70S6K, and ERK1/2 in cells treated with various concentrations of OXY (10, 20, and 40 muM) for 4 h before stimulation with IL-1beta for 20 min; ( B ) quantitative analysis for AKT phosphorylation at Ser473; ( C ) quantitative analysis for p70S6K phosphorylation; ( E ) quantitative analysis for ERK1/2 phosphorylation. Total AKT, total ERK1/2, and beta actin (beta-actin) were detected and used as an internal control. Data are represented as mean +- SD of three independent experiments; # p < 0.05 (compared to the untreated group) or * p < 0.05 (compared to the IL-1beta-treated group).

- Submitted by
- Invitrogen Antibodies (provider)
- Main image

- Experimental details
- Figure 6 ( A ) Western blot analysis for the inhibitory effects of OXY on AKT and ERK1/2 phosphorylation in HMC3 after being treated with OXY (40 muM) for 4 h before stimulation with various concentrations of IL-1beta (1, 10, and 100 ng/mL) for 20 min; ( B ) quantitative analysis for AKT phosphorylation at Ser473; ( C ) quantitative analysis for ERK1/2 phosphorylation. Total AKT and total ERK1/2 were detected and used as an internal control. ( D ) Western blot analysis detecting the phosphorylation status of AKT and ERK1/2 in response to IL-1beta (1 ng/mL) for 20 min with or without the presence of 10 muM of LY294002 or 10 muM of U0126. The level of IL-6 ( E ) or MCP-1 ( F ) in the culture supernatants of HMC3 cells stimulated with IL-1beta, with or without the presence of LY294002 or U0126. Data are represented as mean +- SD of three independent experiments; # p < 0.05 (compared to the untreated group) or * p < 0.05 (compared to the IL-1beta-treated groups).
