Explore
 Validate
 Learn
Learn Western blot
 ELISA
ELISA Immunocytochemistry
Antibody data
- Antibody Data
- Antigen structure
- References [4]
- Comments [0]
- Validations
- Immunocytochemistry [1]
- Immunohistochemistry [2]
- Other assay [5]
Submit
Validation data
Reference
Comment
Report error
- Product number
- MA1-25005 - Provider product page

- Provider
- Invitrogen Antibodies
- Product name
- S100B Monoclonal Antibody (SH-B4)
- Antibody type
- Monoclonal
- Antigen
- Other
- Description
- Recommended positive controls: human tongue. MA1-25005 has a predicted molecular weight of 10.5 kDa. Store product as a concentrated solution. Centrifuge briefly prior to opening the vial.
- Reactivity
- Human, Mouse, Rat, Bovine, Canine, Feline, Goat, Porcine, Rabbit
- Host
- Mouse
- Isotype
- IgG
- Antibody clone number
- SH-B4
- Vial size
- 100 μL
- Concentration
- 3.8 mg/mL
- Storage
- Store at 4°C short term. For long term storage, store at -20°C, avoiding freeze/thaw cycles.
Submitted references Distinct progenitor behavior underlying neocortical gliogenesis related to tumorigenesis.
Differentiation of Human Mesenchymal Stem Cells from Wharton's Jelly Towards Neural Stem Cells Using A Feasible and Repeatable Protocol.
Ethanol abolishes vigilance-dependent astroglia network activation in mice by inhibiting norepinephrine release.
HIV-1 Tat-induced diarrhea evokes an enteric glia-dependent neuroinflammatory response in the central nervous system.
Shen Z, Lin Y, Yang J, Jörg DJ, Peng Y, Zhang X, Xu Y, Hernandez L, Ma J, Simons BD, Shi SH
Cell reports 2021 Mar 16;34(11):108853
Cell reports 2021 Mar 16;34(11):108853
Differentiation of Human Mesenchymal Stem Cells from Wharton's Jelly Towards Neural Stem Cells Using A Feasible and Repeatable Protocol.
Kruminis-Kaszkiel E, Osowski A, Bejer-Oleńska E, Dziekoński M, Wojtkiewicz J
Cells 2020 Mar 17;9(3)
Cells 2020 Mar 17;9(3)
Ethanol abolishes vigilance-dependent astroglia network activation in mice by inhibiting norepinephrine release.
Ye L, Orynbayev M, Zhu X, Lim EY, Dereddi RR, Agarwal A, Bergles DE, Bhat MA, Paukert M
Nature communications 2020 Dec 2;11(1):6157
Nature communications 2020 Dec 2;11(1):6157
HIV-1 Tat-induced diarrhea evokes an enteric glia-dependent neuroinflammatory response in the central nervous system.
Esposito G, Capoccia E, Gigli S, Pesce M, Bruzzese E, D'Alessandro A, Cirillo C, di Cerbo A, Cuomo R, Seguella L, Steardo L, Sarnelli G
Scientific reports 2017 Aug 10;7(1):7735
Scientific reports 2017 Aug 10;7(1):7735
No comments: Submit comment
Supportive validation
- Submitted by
- Invitrogen Antibodies (provider)
- Main image

- Experimental details
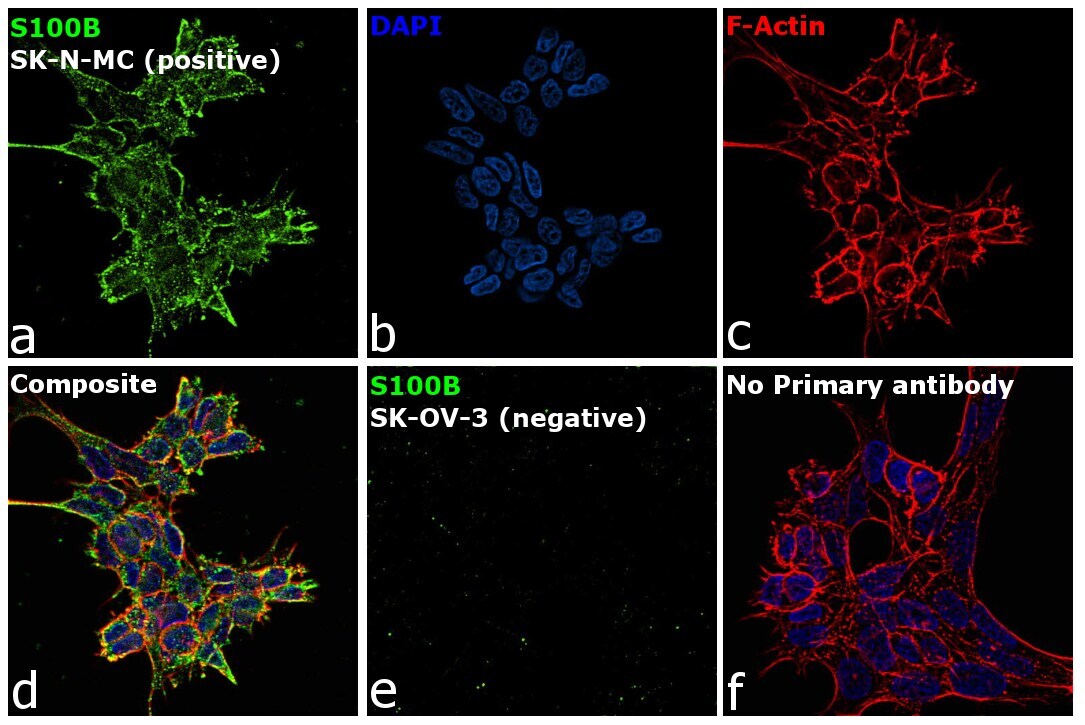
- Immunofluorescence analysis of Protein S100-B was performed using 70% confluent log phase SK-N-MC cells. The cells were fixed with 4% paraformaldehyde for 10 minutes, permeabilized with 0.1% Triton™ X-100 for 15 minutes, and blocked with 2% BSA for 45 minutes at room temperature. The cells were labeled with S100B Monoclonal Antibody (SH-B4) (Product # MA1-25005) at 1:100 dilution in 0.1% BSA, incubated at 4 degree celsius overnight and then labeled with Goat anti-Mouse IgG (H+L) Superclonal™ Recombinant Secondary Antibody, Alexa Fluor® 488 conjugate (Product # A28175), (1:2000 dilution), for 45 minutes at room temperature (Panel a: Green). Nuclei (Panel b: Blue) were stained with ProLong™ Diamond Antifade Mountant with DAPI (Product # P36962). F-actin (Panel c: Red) was stained with Rhodamine Phalloidin (Product # R415, 1:300 dilution). Panel d represents the merged image showing cytoplasm localization. Panel e represents SK-OV-3. Panel f represents control cells with no primary antibody to assess background. The images were captured at 60X magnification.
Supportive validation
- Submitted by
- Invitrogen Antibodies (provider)
- Main image
- Experimental details
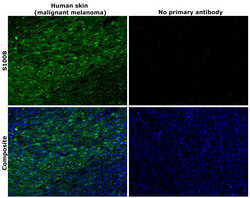
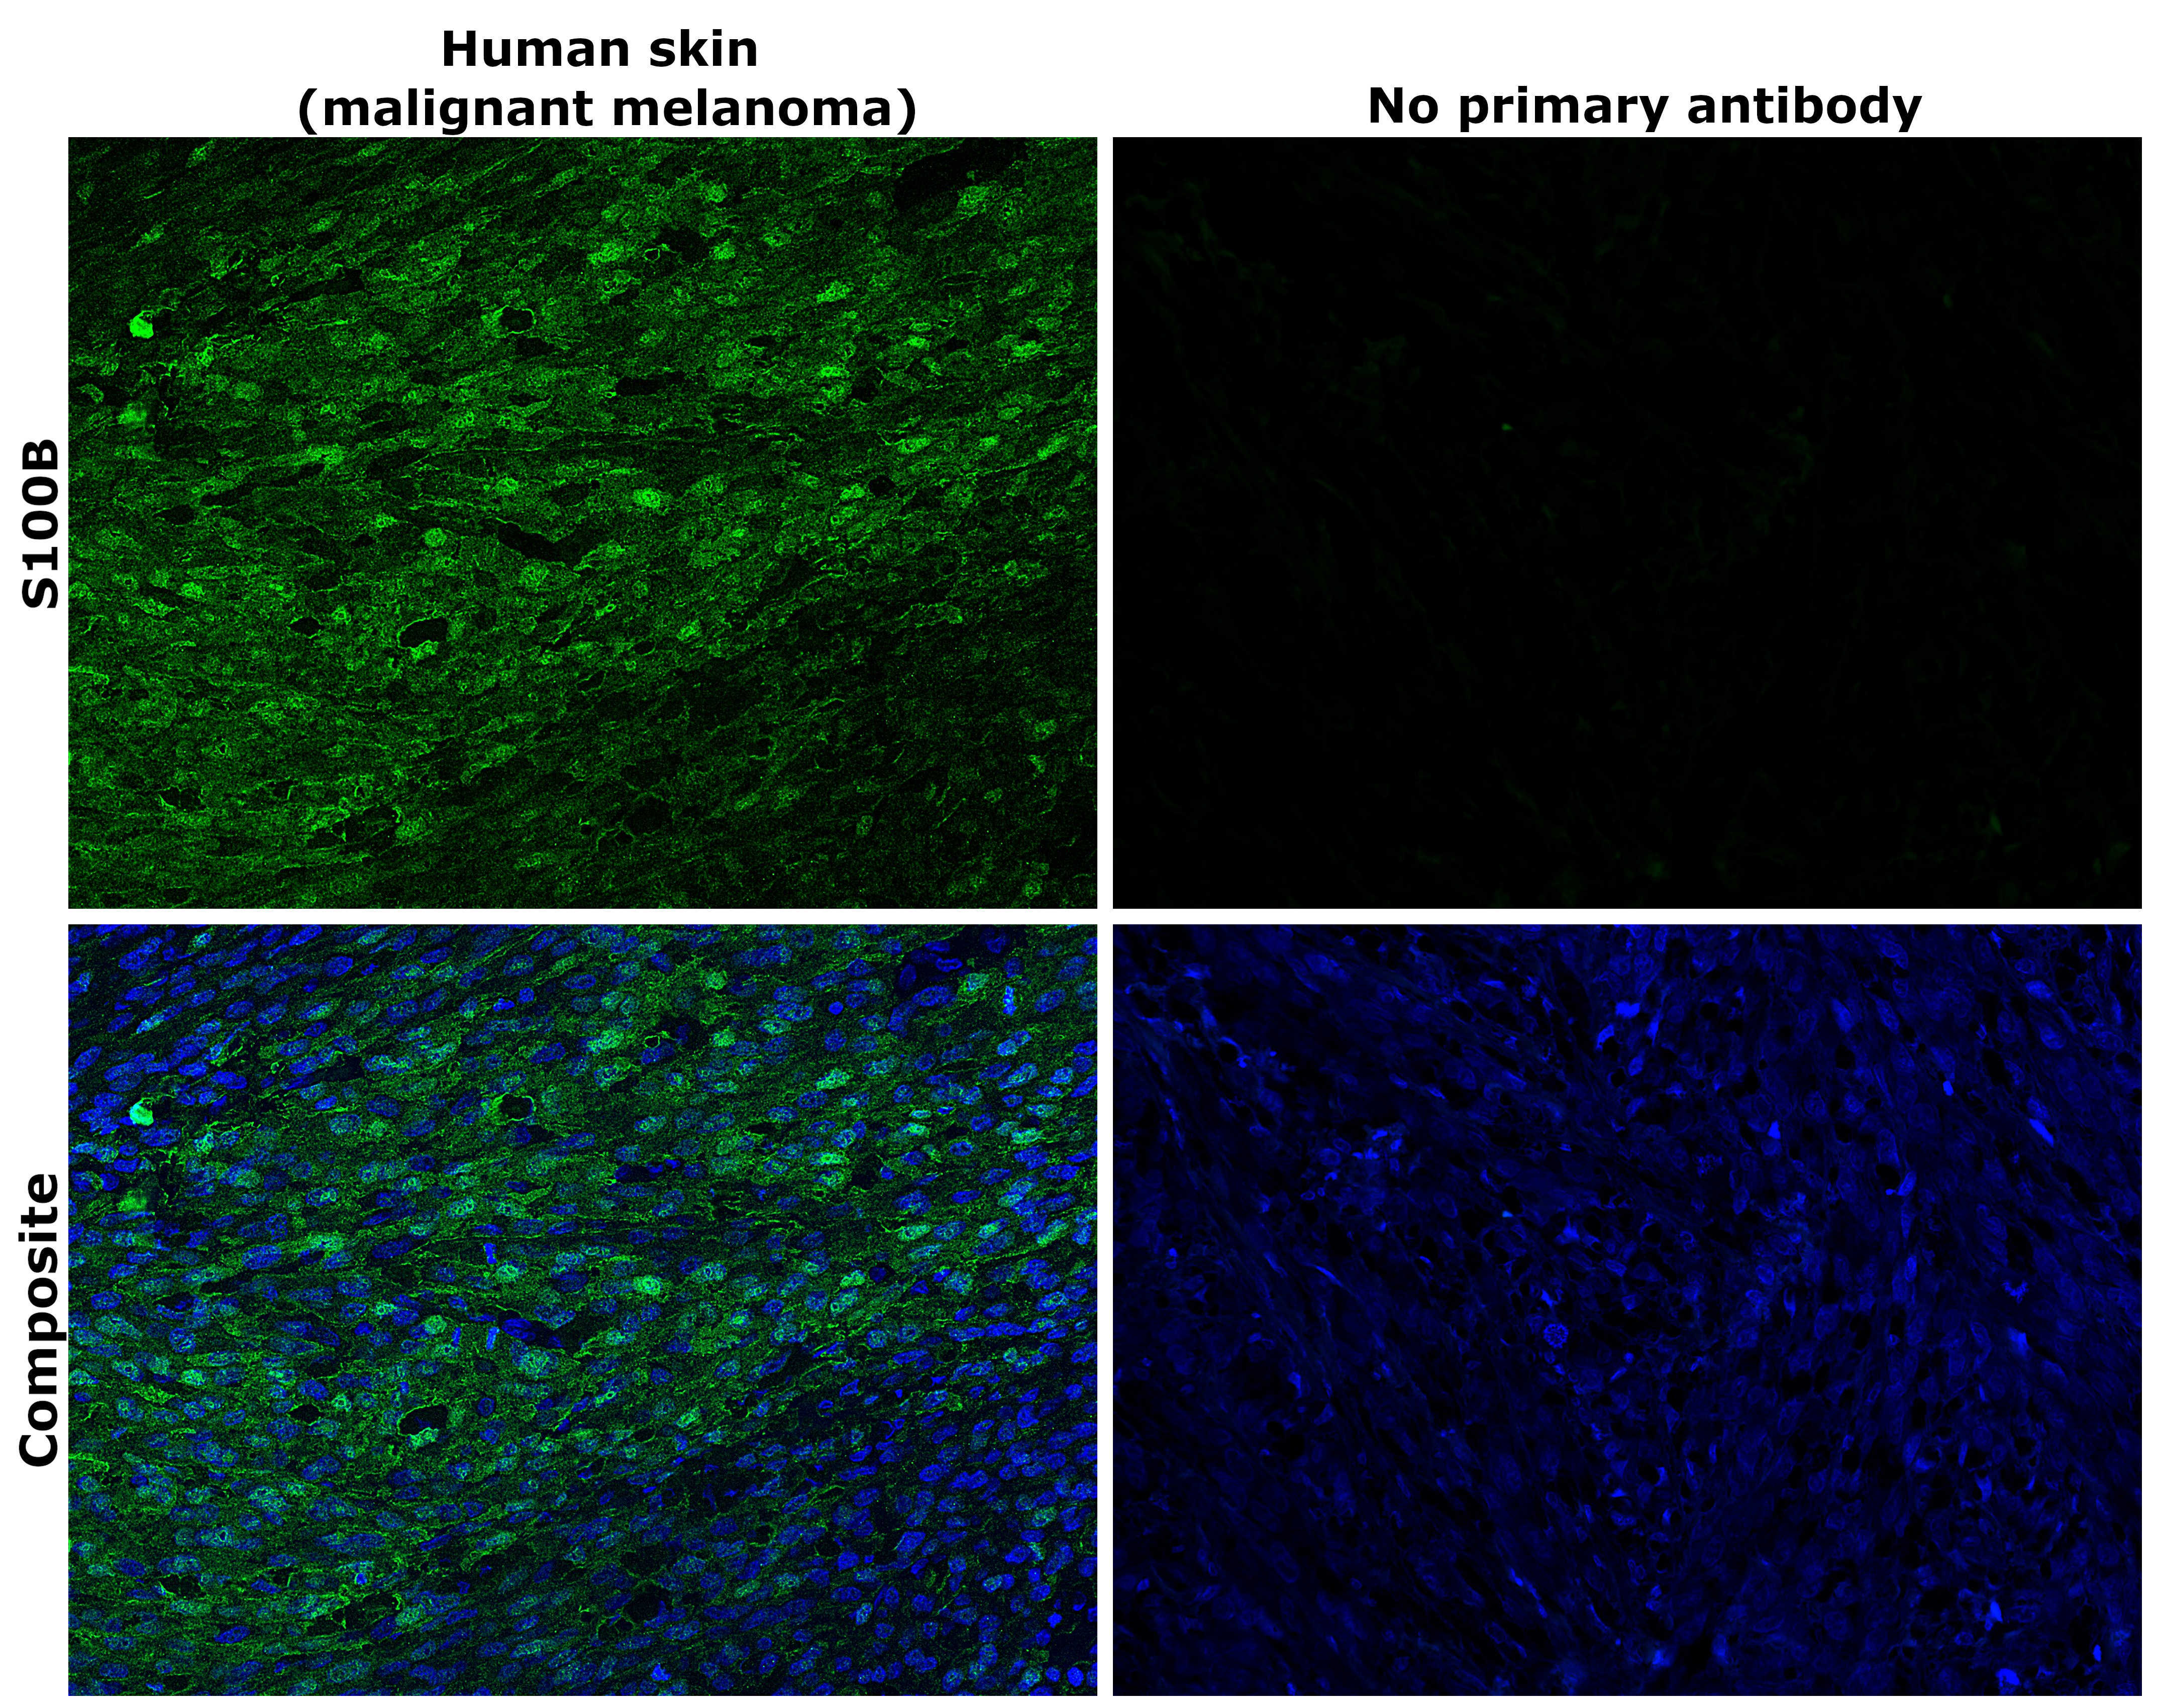
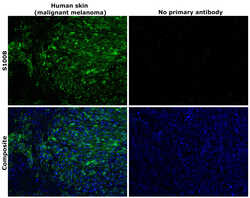
- Immunohistochemical analysis of S100B was performed using formalin-fixed paraffin-embedded human skin (malignant melanoma) tissue sections. To expose the target protein, heat-induced epitope retrieval was performed on de-paraffinized sections using eBioscience™ IHC Antigen Retrieval Solution - High pH (10X) (Product # 00-4956-58) diluted to 1X solution in water in a decloaking chamber at 110 degree Celsius for 15 minutes. Following antigen retrieval, the sections were blocked with 2% normal goat serum in 1X PBS for 45 minutes at room temperature and then probed with or without S100B Monoclonal Antibody (SH-B4) (Product # MA1-25005) at 1:100 dilution in 0.1% normal goat serum overnight at 4 degree Celsius in a humidified chamber. Detection was performed using Goat anti-Mouse IgG (H+L) Highly Cross-Adsorbed Secondary Antibody, Alexa Fluor™ Plus 488 (Product # A32723) at a dilution of 1:2,000 in 0.1% normal goat serum for 45 minutes at room temperature. ReadyProbes™ Tissue Autofluorescence Quenching Kit (Product # R37630) was used to quench autofluorescence from the tissues. Nuclei were stained with DAPI (Product # D1306) and the sections were mounted using ProLong™ Glass Antifade Mountant (Product # P36984). The images were captured on EVOS™ M7000 Imaging System (Product # AMF7000) at 20X magnification and externally deconvoluted.
- Submitted by
- Invitrogen Antibodies (provider)
- Main image
- Experimental details
- Immunohistochemical analysis of S100B was performed using formalin-fixed paraffin-embedded human skin (malignant melanoma) tissue sections. To expose the target protein, heat-induced epitope retrieval was performed on de-paraffinized sections using eBioscience™ IHC Antigen Retrieval Solution - High pH (10X) (Product # 00-4956-58) diluted to 1X solution in water in a decloaking chamber at 110 degree Celsius for 15 minutes. Following antigen retrieval, the sections were blocked with 2% normal goat serum in 1X PBS for 45 minutes at room temperature and then probed with or without S100B Monoclonal Antibody (SH-B4) (Product # MA1-25005) at 1:100 dilution in 0.1% normal goat serum overnight at 4 degree Celsius in a humidified chamber. Detection was performed using Goat anti-Mouse IgG (H+L) Highly Cross-Adsorbed Secondary Antibody, Alexa Fluor™ Plus 488 (Product # A32723) at a dilution of 1:2,000 in 0.1% normal goat serum for 45 minutes at room temperature. ReadyProbes™ Tissue Autofluorescence Quenching Kit (Product # R37630) was used to quench autofluorescence from the tissues. Nuclei were stained with DAPI (Product # D1306) and the sections were mounted using ProLong™ Glass Antifade Mountant (Product # P36984). The images were captured on EVOS™ M7000 Imaging System (Product # AMF7000) at 20X magnification and externally deconvoluted.
Supportive validation
- Submitted by
- Invitrogen Antibodies (provider)
- Main image
- Experimental details
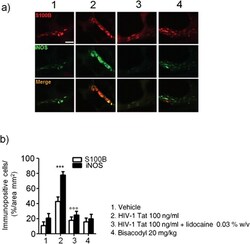
- Figure 3 Intracolonic administration of HIV-1 Tat (100 ng/ml) yields to a marked activation of submucosal plexus-EGCs, as shown by the immunofluorescence analysis showing a significant increase of S100B and iNOS protein co-expression. ( a ) The panel shows iNOS (green) and S100B (red) immunoreactivity with ( b ) the respective quantification of iNOS (filled bars) and S100B (open bars) expression in the EGCs; both lidocaine pretreatment and bisacodyl administration failed to significantly affect S100B/iNOS expression. Results are expressed as mean +- SEM; ***p < 0.001 vs all other groups; degdegdegp < 0.001 vs HIV-1 Tat group. Scale bar: 20 mum.

- Submitted by
- Invitrogen Antibodies (provider)
- Main image
- Experimental details
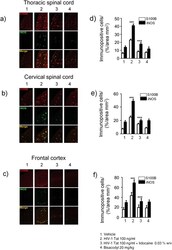
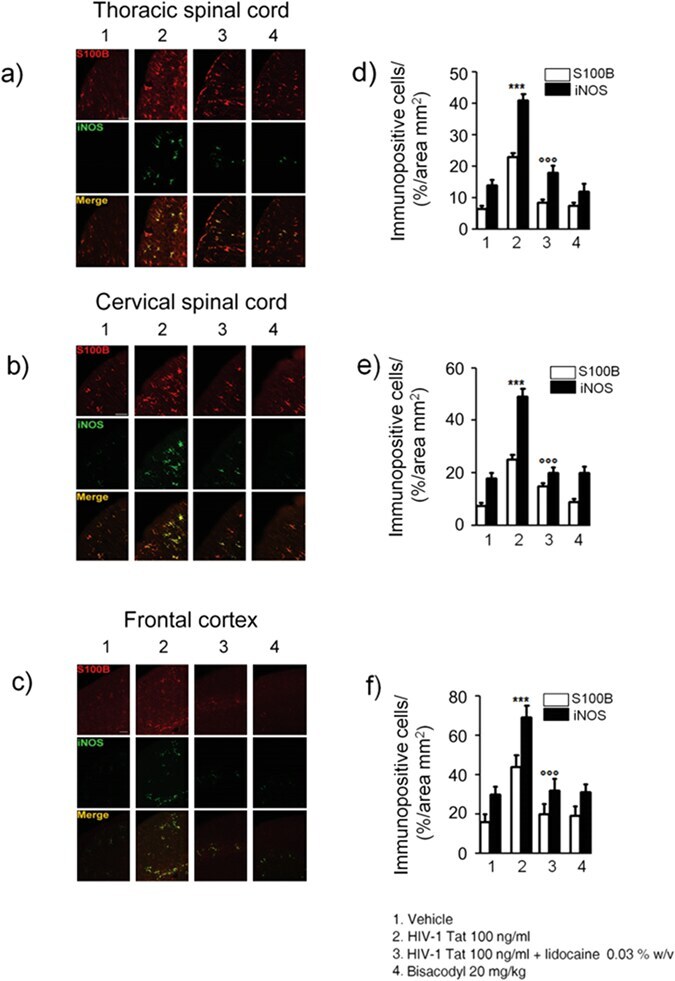
- Figure 6 Intracolonic administration of HIV-1 Tat induced glial activation in the ( a ) thoracic and ( b ) cervical spinal cord and ( c ) frontal cortex at day 12, 14 and 21 after diarrhea induction, respectively. ( a - c ) Immunofluorescence analysis showed that iNOS (green) and S100B (red) co-expression was increased in the spinal cord and frontal of HIV-1 Tat treated rats. ( d - f ) Quantitative analysis showed that HIV-1 Tat-induced upregulation of iNOS (filled bars) and S100B (open bars) was significantly inhibited by lidocaine treatment. Results are expressed as mean +- SEM; ***p < 0.001 vs all other groups; degdegdegp < 0.001 vs HIV-1 Tat group. Scale bars: 100 mum; n = 6 for each group.
- Submitted by
- Invitrogen Antibodies (provider)
- Main image
- Experimental details
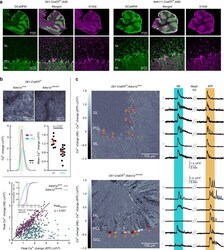
- Fig. 4 Activation of alpha 1A -adrenergic receptors on BG causes vigilance-dependent Ca 2+ activation. a Left, Cerebellar section from 6-week-old Gli1-CreER T2 ;Ai95 mouse immunostained for eGFP (GCaMP6f; green) and S100beta (magenta). White box highlights area displayed at high magnification. Right, Same for 6-week-old Aldh1l1-CreER T2 ;Ai95 mouse. GL granular layer, PCL Purkinje cell layer, ML molecular layer. Three independent experimental repetitions were obtained with similar results. b Upper, Representative BG locomotion-induced Ca 2+ response plots of Gli1-CreER T2 ;Ai95;Adra1a wt/wt and Gli1-CreER T2 ;Ai95;Adra1a cKO/cKO mice. Lower left, Overlay of averaged Ca 2+ change traces of wt mice (9 fields of view (FOVs) from 3 mice) and cKO mice (15 FOVs from 5 mice). Lower right, Population data of mean Ca 2+ changes. Red symbols indicate mean +- SEM. Unpaired, two-tailed Student's t -test ( t (22) = 4.707). c Responsiveness of BG to bath application of NE (30 muM) and ATP (100 muM), respectively, in acute cerebellar slices--2P Ca 2+ imaging of Gli1-CreER T2 ;Ai95;Adra1a wt/wt or Gli1-CreER T2 ;Ai95;Adra1a cKO/cKO mice (postnatal day (PND) 160-180). Upper left, Visualization of the difference between responses to NE and ATP of Adra1a wt/wt BG. Structures that responded stronger to NE than to ATP appear brighter. Red circumferences indicate ROIs enclosing individual BG somata in the PCL. Upper right, Ca 2+ change traces for each ROI. Double-line blanks 11 min of washout with
- Submitted by
- Invitrogen Antibodies (provider)
- Main image
- Experimental details
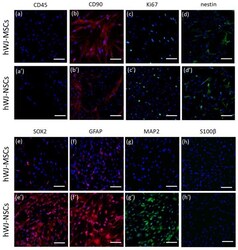
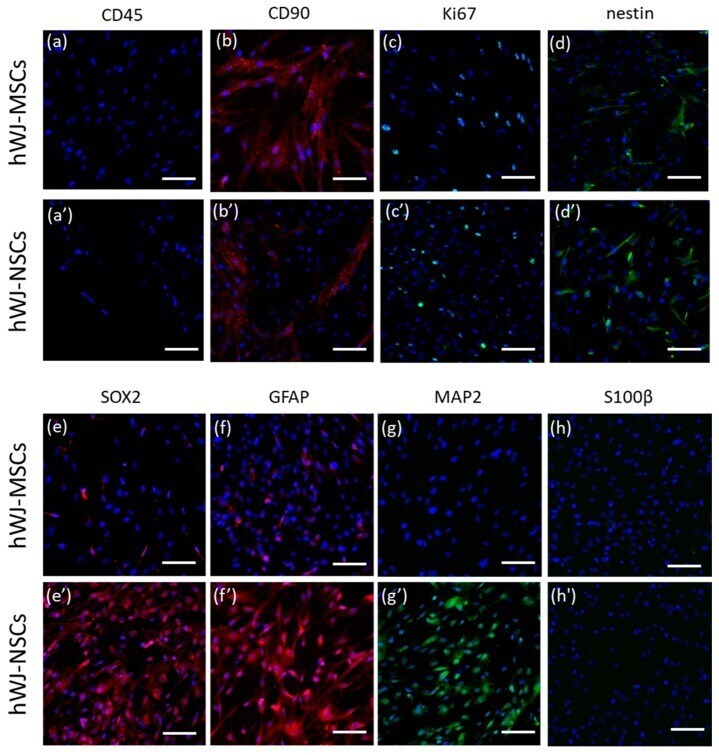
- Figure 4 Immunofluorescence analysis of hWJ-MSCs vs. hWJ-NSCs. Comparison of expression of several markers: ( a ') expression of CD45 (red) in hWJ-NSCs compared to ( a ) expression of CD45 (red) in hWJ-MSCs; ( b ') expression of CD90 (red) in hWJ-NSCs compared to ( b ) expression of CD90 (red) in hWJ-MSCs; ( c ') expression of Ki67 (green) in hWJ-NSCs compared to ( c ) expression of Ki67 (green) in hWJ-MSCs; ( d ') expression of nestin (green) in hWJ-NSCs compared to ( d ) expression of nestin (green) in hWJ-MSCs; ( e ') expression of SOX2 (red) in hWJ-NSCs compared to ( e ) expression of SOX2 (red) in hWJ-MSCs; ( f ') expression of GFAP (red) in hWJ-NSCs compared to ( f ) expression of GFAP (red) in hWJ-MSCs; ( g ') expression of MAP2 (green) in hWJ-NSCs compared to ( g ) expression of MAP2 (green) in hWJ-MSCs; ( h ') expression of S100beta (green) in hWJ-NSCs compared to ( h ) expression of S100beta (green) in hWJ-MSCs; Cell nuclei counterstained with Hoechst (blue); Scale bar = 100 µm. hWJ-MSCs--human Wharton's jelly derived mesenchymal stem cells; hWJ-NSCs--human Wharton's jelly derived neural stem cells; SOX2--sex-determining region Y (SRY) box 2; GFAP--glial fibrillary acidic protein; MAP2--microtubule-associated protein 2; S100beta--S100 calcium-binding protein beta; Ki67--proliferation marker.
- Submitted by
- Invitrogen Antibodies (provider)
- Main image
- Experimental details
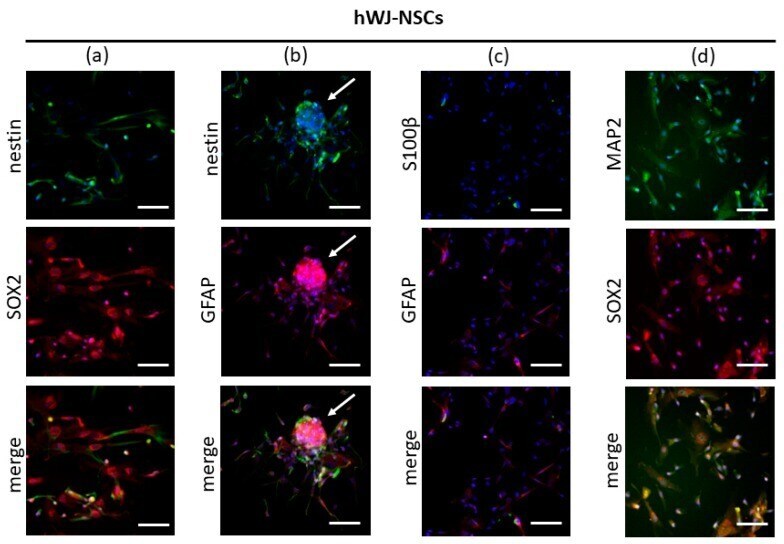
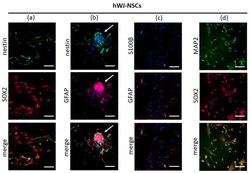
- Figure 5 Immunofluorescence analysis of differentiated cells (hWJ-NSCs). ( a ) Co-expression of SOX2 (red) and nestin (green); ( b ) co-expression of GFAP (red) and nestin (green), neurosphere-like structure (white arrow); ( c ) co-expression of GFAP (red) and S100beta (green); ( d ) co-expression of SOX2 (red) and MAP2 (green). Cell nuclei counterstained with Hoechst (blue). Scale bar = 100 µm. hWJ-MSCs--human Wharton's jelly derived mesenchymal stem cells; hWJ-NSCs--human Wharton's jelly derived neural stem cells; SOX2--sex-determining region Y (SRY) box 2; GFAP--glial fibrillary acidic protein; MAP2--microtubule-associated protein 2; S100beta--S100 calcium-binding protein beta.