 Explore
 Validate
 Learn
Learn Western blot
 Immunocytochemistry
Antibody data
- Antibody Data
- Antigen structure
- References [30]
- Comments [0]
- Validations
- Immunocytochemistry [11]
- Immunoprecipitation [1]
- Immunohistochemistry [6]
- Flow cytometry [2]
- Other assay [45]
Submit
Validation data
Reference
Comment
Report error
- Product number
- PA1-094 - Provider product page

- Provider
- Invitrogen Antibodies
- Product name
- SOX2 Polyclonal Antibody
- Antibody type
- Polyclonal
- Antigen
- Recombinant full-length protein
- Reactivity
- Human, Mouse
- Host
- Rabbit
- Isotype
- IgG
- Vial size
- 100 μg
- Concentration
- 1 mg/mL
- Storage
- -20°C
Submitted references Stemness-Associated Markers Are Expressed in Extracranial Arteriovenous Malformation.
Close relationship between TAZhigh/SOX2high co-localization and metastasis in oral squamous cell carcinoma.
Cathepsins B, D, and G Are Expressed in Metastatic Head and Neck Cutaneous Squamous Cell Carcinoma.
Latent Tri-lineage Potential of Human Menstrual Blood-Derived Mesenchymal Stromal Cells Revealed by Specific In Vitro Culture Conditions.
Cell Populations Expressing Stemness-Associated Markers in Lung Adenocarcinoma.
Cancer Stem Cell Subpopulations Are Present Within Metastatic Head and Neck Cutaneous Squamous Cell Carcinoma.
Embryonic stem cell-like subpopulations are present within Schwannoma.
Long-term PM(2.5) exposure increases the risk of non-small cell lung cancer (NSCLC) progression by enhancing interleukin-17a (IL-17a)-regulated proliferation and metastasis.
Identification of Cancer Stem Cell Subpopulations in Head and Neck Metastatic Malignant Melanoma.
SOX2 Expression and Transcriptional Activity Identifies a Subpopulation of Cancer Stem Cells in Sarcoma with Prognostic Implications.
Expression of Components of the Renin-Angiotensin System in Pyogenic Granuloma.
PI3K-Yap activity drives cortical gyrification and hydrocephalus in mice.
Persistent motor dysfunction despite homeostatic rescue of cerebellar morphogenesis in the Car8 waddles mutant mouse.
Cancer stem cell subpopulations in moderately differentiated head and neck cutaneous squamous cell carcinoma.
Embryonic Stem Cell-like Population within Venous Malformation Expresses the Renin-Angiotensin System.
Expression of Embryonic Stem Cell Markers on the Microvessels of WHO Grade I Meningioma.
3D bioprinter applied picosecond pulsed electric fields for targeted manipulation of proliferation and lineage specific gene expression in neural stem cells.
Epigenetic alterations mediate iPSC-induced normalization of DNA repair gene expression and TNR stability in Huntington's disease cells.
Characterization of Cancer Stem Cells in Colon Adenocarcinoma Metastasis to the Liver.
Cancer Stem Cells in Moderately Differentiated Lip Squamous Cell Carcinoma Express Components of the Renin-Angiotensin System.
Embryonic Stem Cell-Like Subpopulations in Venous Malformation.
The Identification of Three Cancer Stem Cell Subpopulations within Moderately Differentiated Lip Squamous Cell Carcinoma.
Six1 is essential for differentiation and patterning of the mammalian auditory sensory epithelium.
Cancer Stem Cells in Moderately Differentiated Buccal Mucosal Squamous Cell Carcinoma Express Components of the Renin-Angiotensin System.
Glioblastoma Multiforme Cancer Stem Cells Express Components of the Renin-Angiotensin System.
Cancer Stem Cells in Glioblastoma Multiforme.
Cancer stem cells in moderately differentiated oral tongue squamous cell carcinoma express components of the renin-angiotensin system.
Embryonic Stem Cell-like Population in Dupuytren's Disease.
Aldh1 Expression and Activity Increase During Tumor Evolution in Sarcoma Cancer Stem Cell Populations.
Cancer stem cells in moderately differentiated oral tongue squamous cell carcinoma.
Luke Krishnan CS, Brasch HD, Patel J, Bockett N, Paterson E, Davis PF, Tan ST
Frontiers in surgery 2021;8:621089
Frontiers in surgery 2021;8:621089
Close relationship between TAZhigh/SOX2high co-localization and metastasis in oral squamous cell carcinoma.
Stasikowska-Kanicka O, Woskowicz M, Ulewicz K, Danilewicz M, Wągrowska-Danilewicz M
Polish journal of pathology : official journal of the Polish Society of Pathologists 2021;72(3):229-236
Polish journal of pathology : official journal of the Polish Society of Pathologists 2021;72(3):229-236
Cathepsins B, D, and G Are Expressed in Metastatic Head and Neck Cutaneous Squamous Cell Carcinoma.
Humphries F, Chang-McDonald B, Patel J, Bockett N, Paterson E, Davis PF, Tan ST
Frontiers in oncology 2021;11:690460
Frontiers in oncology 2021;11:690460
Latent Tri-lineage Potential of Human Menstrual Blood-Derived Mesenchymal Stromal Cells Revealed by Specific In Vitro Culture Conditions.
Quintero-Espinosa D, Soto-Mercado V, Quintero-Quinchia C, Mendivil-Perez M, Velez-Pardo C, Jimenez-Del-Rio M
Molecular neurobiology 2021 Oct;58(10):5194-5209
Molecular neurobiology 2021 Oct;58(10):5194-5209
Cell Populations Expressing Stemness-Associated Markers in Lung Adenocarcinoma.
Paterson C, Kilmister EJ, Brasch HD, Bockett N, Patel J, Paterson E, Purdie G, Galvin S, Davis PF, Itinteang T, Tan ST
Life (Basel, Switzerland) 2021 Oct 18;11(10)
Life (Basel, Switzerland) 2021 Oct 18;11(10)
Cancer Stem Cell Subpopulations Are Present Within Metastatic Head and Neck Cutaneous Squamous Cell Carcinoma.
Kilmister EJ, Patel J, van Schaijik B, Bockett N, Brasch HD, Paterson E, Sim D, Davis PF, Roth IM, Itinteang T, Tan ST
Frontiers in oncology 2020;10:1091
Frontiers in oncology 2020;10:1091
Embryonic stem cell-like subpopulations are present within Schwannoma.
Kilmister EJ, Patel J, Bockett N, Chang-McDonald B, Sim D, Wickremesekera A, Davis PF, Tan ST
Journal of clinical neuroscience : official journal of the Neurosurgical Society of Australasia 2020 Nov;81:201-209
Journal of clinical neuroscience : official journal of the Neurosurgical Society of Australasia 2020 Nov;81:201-209
Long-term PM(2.5) exposure increases the risk of non-small cell lung cancer (NSCLC) progression by enhancing interleukin-17a (IL-17a)-regulated proliferation and metastasis.
Chao X, Yi L, Lan LL, Wei HY, Wei D
Aging 2020 Jun 18;12(12):11579-11602
Aging 2020 Jun 18;12(12):11579-11602
Identification of Cancer Stem Cell Subpopulations in Head and Neck Metastatic Malignant Melanoma.
Yoganandarajah V, Patel J, van Schaijik B, Bockett N, Brasch HD, Paterson E, Sim D, Davis PF, Roth IM, Itinteang T, Tan ST
Cells 2020 Jan 30;9(2)
Cells 2020 Jan 30;9(2)
SOX2 Expression and Transcriptional Activity Identifies a Subpopulation of Cancer Stem Cells in Sarcoma with Prognostic Implications.
Menendez ST, Rey V, Martinez-Cruzado L, Gonzalez MV, Morales-Molina A, Santos L, Blanco V, Alvarez C, Estupiñan O, Allonca E, Rodrigo JP, García-Castro J, Garcia-Pedrero JM, Rodriguez R
Cancers 2020 Apr 13;12(4)
Cancers 2020 Apr 13;12(4)
Expression of Components of the Renin-Angiotensin System in Pyogenic Granuloma.
Papali'i-Curtin JC, Brasch HD, van Schaijik B, de Jongh J, Marsh RW, Tan ST, Itinteang T
Frontiers in surgery 2019;6:13
Frontiers in surgery 2019;6:13
PI3K-Yap activity drives cortical gyrification and hydrocephalus in mice.
Roy A, Murphy RM, Deng M, MacDonald JW, Bammler TK, Aldinger KA, Glass IA, Millen KJ
eLife 2019 May 16;8
eLife 2019 May 16;8
Persistent motor dysfunction despite homeostatic rescue of cerebellar morphogenesis in the Car8 waddles mutant mouse.
Miterko LN, White JJ, Lin T, Brown AM, O'Donovan KJ, Sillitoe RV
Neural development 2019 Mar 12;14(1):6
Neural development 2019 Mar 12;14(1):6
Cancer stem cell subpopulations in moderately differentiated head and neck cutaneous squamous cell carcinoma.
Koh SP, Brasch HD, de Jongh J, Itinteang T, Tan ST
Heliyon 2019 Aug;5(8):e02257
Heliyon 2019 Aug;5(8):e02257
Embryonic Stem Cell-like Population within Venous Malformation Expresses the Renin-Angiotensin System.
Tan EMS, Brasch HD, Davis PF, Itinteang T, Tan ST
Plastic and reconstructive surgery. Global open 2019 Apr;7(4):e2170
Plastic and reconstructive surgery. Global open 2019 Apr;7(4):e2170
Expression of Embryonic Stem Cell Markers on the Microvessels of WHO Grade I Meningioma.
Shivapathasundram G, Wickremesekera AC, Brasch HD, Marsh R, Tan ST, Itinteang T
Frontiers in surgery 2018;5:65
Frontiers in surgery 2018;5:65
3D bioprinter applied picosecond pulsed electric fields for targeted manipulation of proliferation and lineage specific gene expression in neural stem cells.
Petrella RA, Mollica PA, Zamponi M, Reid JA, Xiao S, Bruno RD, Sachs PC
Journal of neural engineering 2018 Oct;15(5):056021
Journal of neural engineering 2018 Oct;15(5):056021
Epigenetic alterations mediate iPSC-induced normalization of DNA repair gene expression and TNR stability in Huntington's disease cells.
Mollica PA, Zamponi M, Reid JA, Sharma DK, White AE, Ogle RC, Bruno RD, Sachs PC
Journal of cell science 2018 Jul 6;131(13)
Journal of cell science 2018 Jul 6;131(13)
Characterization of Cancer Stem Cells in Colon Adenocarcinoma Metastasis to the Liver.
Humphries HN, Wickremesekera SK, Marsh RW, Brasch HD, Mehrotra S, Tan ST, Itinteang T
Frontiers in surgery 2017;4:76
Frontiers in surgery 2017;4:76
Cancer Stem Cells in Moderately Differentiated Lip Squamous Cell Carcinoma Express Components of the Renin-Angiotensin System.
Ram RS, Brasch HD, Dunne JC, Davis PF, Tan ST, Itinteang T
Frontiers in surgery 2017;4:30
Frontiers in surgery 2017;4:30
Embryonic Stem Cell-Like Subpopulations in Venous Malformation.
Tan EMS, Siljee SD, Brasch HD, Enriquez S, Tan ST, Itinteang T
Frontiers in medicine 2017;4:162
Frontiers in medicine 2017;4:162
The Identification of Three Cancer Stem Cell Subpopulations within Moderately Differentiated Lip Squamous Cell Carcinoma.
Ram R, Brasch HD, Dunne JC, Davis PF, Tan ST, Itinteang T
Frontiers in surgery 2017;4:12
Frontiers in surgery 2017;4:12
Six1 is essential for differentiation and patterning of the mammalian auditory sensory epithelium.
Zhang T, Xu J, Maire P, Xu PX
PLoS genetics 2017 Sep;13(9):e1006967
PLoS genetics 2017 Sep;13(9):e1006967
Cancer Stem Cells in Moderately Differentiated Buccal Mucosal Squamous Cell Carcinoma Express Components of the Renin-Angiotensin System.
Featherston T, Yu HH, Dunne JC, Chibnall AM, Brasch HD, Davis PF, Tan ST, Itinteang T
Frontiers in surgery 2016;3:52
Frontiers in surgery 2016;3:52
Glioblastoma Multiforme Cancer Stem Cells Express Components of the Renin-Angiotensin System.
Bradshaw AR, Wickremesekera AC, Brasch HD, Chibnall AM, Davis PF, Tan ST, Itinteang T
Frontiers in surgery 2016;3:51
Frontiers in surgery 2016;3:51
Cancer Stem Cells in Glioblastoma Multiforme.
Bradshaw A, Wickremesekera A, Brasch HD, Chibnall AM, Davis PF, Tan ST, Itinteang T
Frontiers in surgery 2016;3:48
Frontiers in surgery 2016;3:48
Cancer stem cells in moderately differentiated oral tongue squamous cell carcinoma express components of the renin-angiotensin system.
Itinteang T, Dunne JC, Chibnall AM, Brasch HD, Davis PF, Tan ST
Journal of clinical pathology 2016 Oct;69(10):942-5
Journal of clinical pathology 2016 Oct;69(10):942-5
Embryonic Stem Cell-like Population in Dupuytren's Disease.
Koh SP, On N, Brasch HD, Chibnall AM, Armstrong JR, Davis PF, Tan ST, Itinteang T
Plastic and reconstructive surgery. Global open 2016 Nov;4(11):e1064
Plastic and reconstructive surgery. Global open 2016 Nov;4(11):e1064
Aldh1 Expression and Activity Increase During Tumor Evolution in Sarcoma Cancer Stem Cell Populations.
Martinez-Cruzado L, Tornin J, Santos L, Rodriguez A, García-Castro J, Morís F, Rodriguez R
Scientific reports 2016 Jun 13;6:27878
Scientific reports 2016 Jun 13;6:27878
Cancer stem cells in moderately differentiated oral tongue squamous cell carcinoma.
Baillie R, Itinteang T, Yu HH, Brasch HD, Davis PF, Tan ST
Journal of clinical pathology 2016 Aug;69(8):742-4
Journal of clinical pathology 2016 Aug;69(8):742-4
No comments: Submit comment
Supportive validation
- Submitted by
- Invitrogen Antibodies (provider)
- Main image
- Experimental details
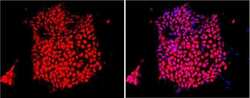
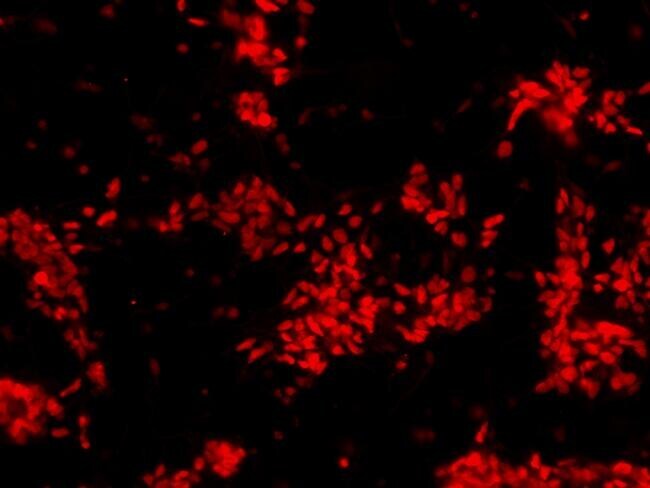
- Immunofluorescent analysis of Sox-2 using anti-Sox-2 polyclonal antibody (Product # PA1-094) shows nuclear localization in the human iPS cell line HEL 11.4. Sox-2 staining (red) and an overlay image of Sox-2 with DAPI (pink) is shown. HEL 11.4 cells were grown on matrigel coated chamber slides, fixed with formaldehyde and permeabilized with 0.1% Triton X-100 in TBS for 15 minutes at room temperature. The cells were probed with a rabbit polyclonal antibody recognizing Sox-2 (Product # PA1-094) at a dilution of 1:100 overnight at 4 °C, washed with PBS and incubated with a FITC-conjugated secondary antibody at a dilution of 1:100 for 60 minutes at room temperature. Images were taken at 20X magnification.

- Submitted by
- Invitrogen Antibodies (provider)
- Main image
- Experimental details
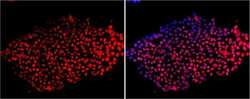
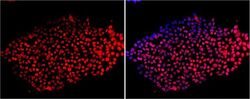
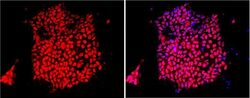
- Immunofluorescent analysis of Sox-2 using anti-Sox-2 polyclonal antibody (Product # PA1-094) shows nuclear localization in the human embryonic stem cell line H9. Sox-2 staining (red) and an overlay image of Sox-2 with DAPI (pink) is shown. H9 cells were grown on matrigel coated chamber slides, fixed with formaldehyde and permeabilized with 0.1% Triton X-100 in TBS for 15 minutes at room temperature. The cells were probed with a rabbit polyclonal antibody recognizing Sox-2 (Product # PA1-094) at a dilution of 1:100 overnight at 4 °C, washed with PBS and incubated with a FITC-conjugated secondary antibody at a dilution of 1:100 for 60 minutes at room temperature. Images were taken at 20X magnification.

- Submitted by
- Invitrogen Antibodies (provider)
- Main image
- Experimental details
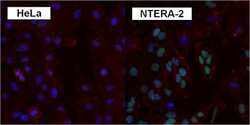
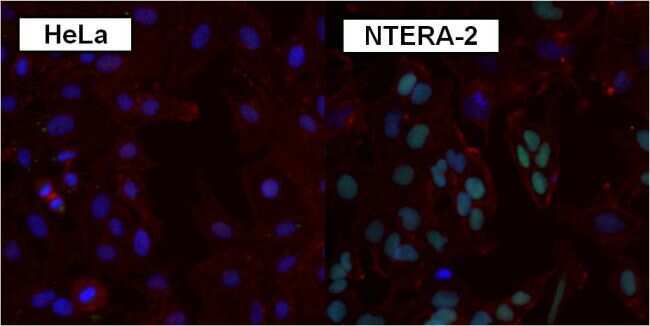
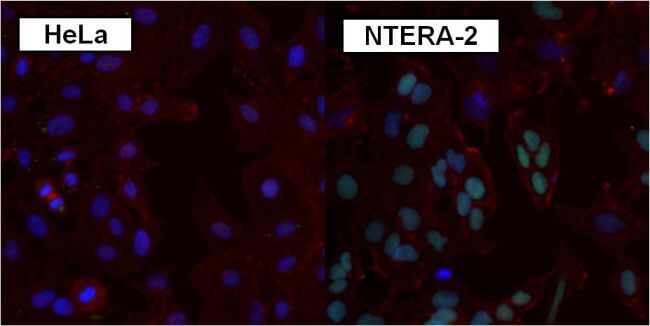
- Immunofluorescent analysis of SOX2 using anti-SOX2 polyclonal antibody (Product # PA1-094) shows specific expression in human embryonal carcinoma NTERA-2 cells (shown in green) but not in negative control HeLa cells. Formalin fixed cells were permeabilized with 0.1% Triton X-100 in TBS for 10 minutes at room temperature. Cells were blocked with 1% Blocker BSA (Product # 37525) for 15 minutes at room temperature. Cells were probed with a rabbit polyclonal antibody recognizing SOX2 (Product # PA1-094), at a dilution of 1:200 for at least 1 hour at room temperature. Cells were washed with PBS and incubated with DyLight 488 goat-anti-rabbit IgG secondary antibody (Product # 35552) at a dilution of 1:400 for 30 minutes at room temperature. F-Actin (red) was stained with DY-547 phalloidin, nuclei (blue) were stained with Hoechst 33342 dye (Product # 62249). Images were taken on a Thermo Scientific ArrayScan at 20X magnification.
- Submitted by
- Invitrogen Antibodies (provider)
- Main image

- Experimental details
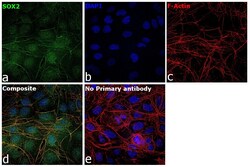
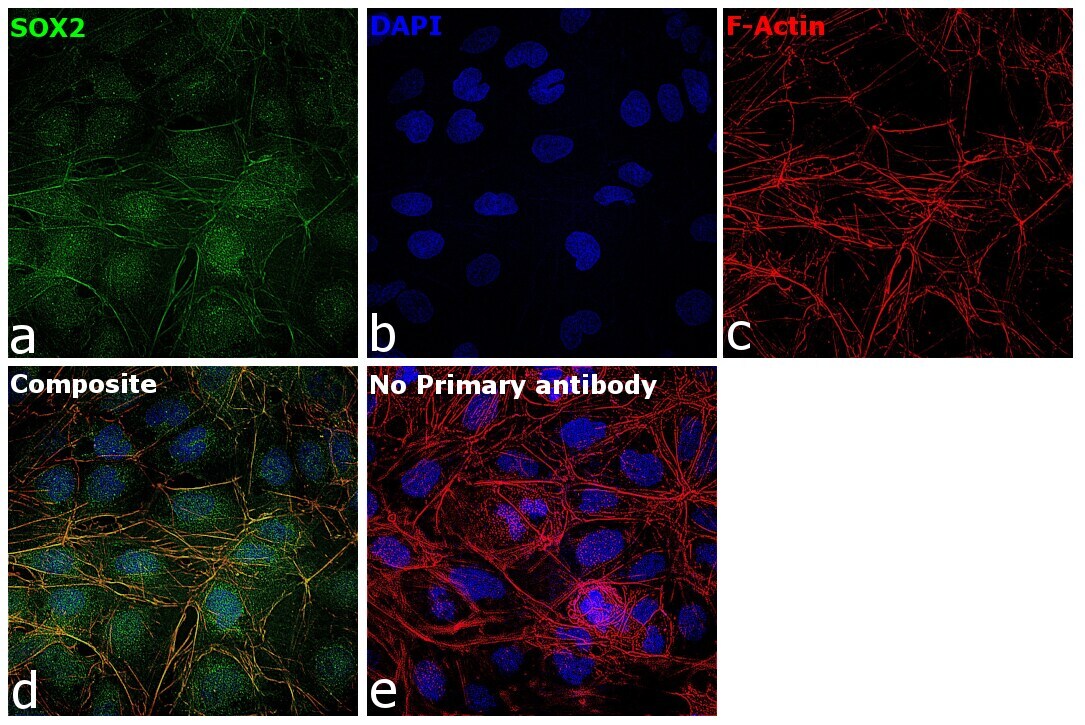
- Immunofluorescence analysis of SOX2 was performed using 70% confluent log phase NTERA-2 cl.D1 cells. The cells were fixed with 4% paraformaldehyde for 5 minutes, permeabilized with 0.1% Triton™ X-100 for 10 minutes, and blocked with 2% BSA for overnight at room temperature. The cells were labeled with SOX2 Polyclonal Antibody (Product # PA1-094) at 1:200 dilution in 0.1% BSA, incubated at 4 degree celsius overnight and then labeled with Donkey anti-Rabbit IgG (H+L) Highly Cross-Adsorbed Secondary Antibody, Alexa Fluor Plus 488 (Product # A32790), (1:2000 dilution), for 45 minutes at room temperature (Panel a: Green). Nuclei (Panel b:Blue) were stained with ProLong™ Diamond Antifade Mountant with DAPI (Product # P36962). F-actin (Panel c: Red) was stained with Rhodamine Phalloidin (Product # R415, 1:300). Panel d represents the merged image showing nuclear localization. Panel e represents control cells with no primary antibody to assess background. The images were captured at 40x magnification in CellInsight CX7 LZR High-Content Screening (HCS) Platform (Product # CX7C1115LZR).

- Submitted by
- Invitrogen Antibodies (provider)
- Main image

- Experimental details
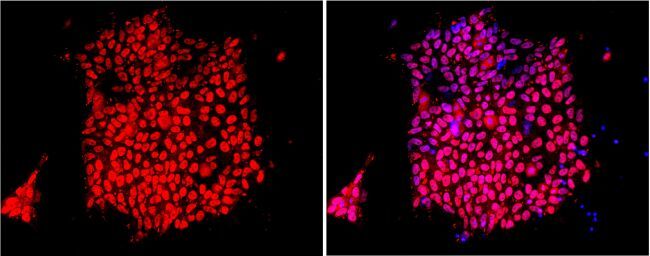
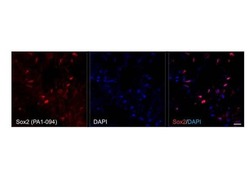
- Immunofluorescent analysis of Sox2 (red) in human neural stem cells derived from PD-3 iPSCs using Gibco® PSC Neural Induction Medium (Product # A1647801). The cells were fixed and permeabilized using Image-IT® Fixation/Permeabilization kit (Product # R37602), and blocked with blocking buffer included the kit for one hour at room temperature. Cells were stained with a Sox2 polyclonal antibody (Product # PA1-094) at a dilution of 1:200 in blocking buffer for 3 hours at room temperature, and then incubated with an DyLight 594-conjugated goat anti-rabbit IgG secondary antibody (Product # 35560) at a dilution of 1:250 for 1 hour at room temperature. Images were taken on an EVOS® FLoid® Cell Imaging Station at 10X magnification.
- Submitted by
- Invitrogen Antibodies (provider)
- Main image

- Experimental details
- Immunofluorescent analysis of Sox2 (red) in human neural stem cells derived from PD-3 iPSCs using Gibco® PSC Neural Induction Medium (Product # A1647801). The cells were fixed and permeabilized using Image-IT® Fixation/Permeabilization kit (Product # R37602), and blocked with blocking buffer included the kit for one hour at room temperature. Cells were stained with a Sox2 polyclonal antibody (Product # PA1-094) at a dilution of 1:200 in blocking buffer for 3 hours at room temperature, and then incubated with an DyLight 594-conjugated goat anti-rabbit IgG secondary antibody (Product # 35560) at a dilution of 1:250 for 1 hour at room temperature. Images were taken on an EVOS® FLoid® Cell Imaging Station at 10X magnification.

- Submitted by
- Invitrogen Antibodies (provider)
- Main image
- Experimental details
- Immunofluorescent analysis of Sox-2 using anti-Sox-2 polyclonal antibody (Product # PA1-094) shows nuclear localization in the human embryonic stem cell line H9. Sox-2 staining (red) and an overlay image of Sox-2 with DAPI (pink) is shown. H9 cells were grown on matrigel coated chamber slides, fixed with formaldehyde and permeabilized with 0.1% Triton X-100 in TBS for 15 minutes at room temperature. The cells were probed with a rabbit polyclonal antibody recognizing Sox-2 (Product # PA1-094) at a dilution of 1:100 overnight at 4 °C, washed with PBS and incubated with a FITC-conjugated secondary antibody at a dilution of 1:100 for 60 minutes at room temperature. Images were taken at 20X magnification.

- Submitted by
- Invitrogen Antibodies (provider)
- Main image
- Experimental details
- Immunofluorescent analysis of Sox-2 using anti-Sox-2 polyclonal antibody (Product # PA1-094) shows nuclear localization in the human iPS cell line HEL 11.4. Sox-2 staining (red) and an overlay image of Sox-2 with DAPI (pink) is shown. HEL 11.4 cells were grown on matrigel coated chamber slides, fixed with formaldehyde and permeabilized with 0.1% Triton X-100 in TBS for 15 minutes at room temperature. The cells were probed with a rabbit polyclonal antibody recognizing Sox-2 (Product # PA1-094) at a dilution of 1:100 overnight at 4 °C, washed with PBS and incubated with a FITC-conjugated secondary antibody at a dilution of 1:100 for 60 minutes at room temperature. Images were taken at 20X magnification.
- Submitted by
- Invitrogen Antibodies (provider)
- Main image

- Experimental details
- Immunofluorescent analysis of SOX2 using anti-SOX2 polyclonal antibody (Product # PA1-094) shows specific expression in human embryonal carcinoma NTERA-2 cells (shown in green) but not in negative control HeLa cells. Formalin fixed cells were permeabilized with 0.1% Triton X-100 in TBS for 10 minutes at room temperature. Cells were blocked with 1% Blocker BSA (Product # 37525) for 15 minutes at room temperature. Cells were probed with a rabbit polyclonal antibody recognizing SOX2 (Product # PA1-094), at a dilution of 1:200 for at least 1 hour at room temperature. Cells were washed with PBS and incubated with DyLight 488 goat-anti-rabbit IgG secondary antibody (Product # 35552) at a dilution of 1:400 for 30 minutes at room temperature. F-Actin (red) was stained with DY-547 phalloidin, nuclei (blue) were stained with Hoechst 33342 dye (Product # 62249). Images were taken on a Thermo Scientific ArrayScan at 20X magnification.
- Submitted by
- Invitrogen Antibodies (provider)
- Main image
- Experimental details
- Immunofluorescence analysis of SOX2 was performed using 70% confluent log phase NTERA-2 cl.D1 cells. The cells were fixed with 4% paraformaldehyde for 5 minutes, permeabilized with 0.1% Triton™ X-100 for 10 minutes, and blocked with 2% BSA for overnight at room temperature. The cells were labeled with SOX2 Polyclonal Antibody (Product # PA1-094) at 1:200 dilution in 0.1% BSA, incubated at 4 degree celsius overnight and then labeled with Donkey anti-Rabbit IgG (H+L) Highly Cross-Adsorbed Secondary Antibody, Alexa Fluor Plus 488 (Product # A32790), (1:2000 dilution), for 45 minutes at room temperature (Panel a: Green). Nuclei (Panel b:Blue) were stained with ProLong™ Diamond Antifade Mountant with DAPI (Product # P36962). F-actin (Panel c: Red) was stained with Rhodamine Phalloidin (Product # R415, 1:300). Panel d represents the merged image showing nuclear localization. Panel e represents control cells with no primary antibody to assess background. The images were captured at 40x magnification in CellInsight CX7 LZR High-Content Screening (HCS) Platform (Product # CX7C1115LZR).
- Submitted by
- Invitrogen Antibodies (provider)
- Main image
- Experimental details
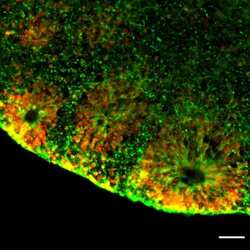
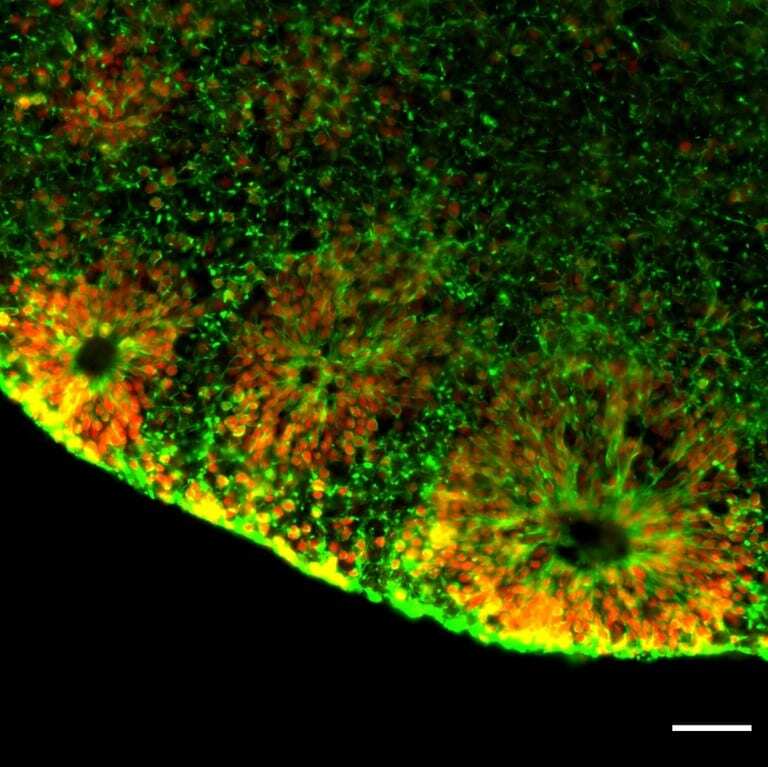
- Immunofluorescence analysis of SOX2 Polyclonal Antibody was performed in sections of H9 derived cerebral organoids derived on Day 50. The organoids were fixed with 4% PFA for 1 hour at room temperature, followed by incubation in 30% sucrose solution overnight at 4°C. The organoids were then embedded in OCT and cryosectioned at 10 µm, permeabilized with 0.1% Triton™ X-100 for 10 minutes and blocked with 2% BSA for 1 hour at room temperature. The cells were labeled with SOX2 polyclonal antibody (Product # PA1-094, 1:500) in 0.1% BSA and incubated for 3 hours at room temperature and then labeled with Goat anti-Rabbit IgG (H+L) Superclonal™ Secondary Antibody, Alexa Fluor™ 488 (Product # A27034, 1:2,000) for 45 minutes at room temperature. The sections were stained with DAPI (Product # D1306) and F-actin (Product # R415). The images were captured on EVOS™ M7000 Imaging System (Product # AMF7000) at 20X magnification.
Supportive validation
- Submitted by
- Invitrogen Antibodies (provider)
- Main image

- Experimental details
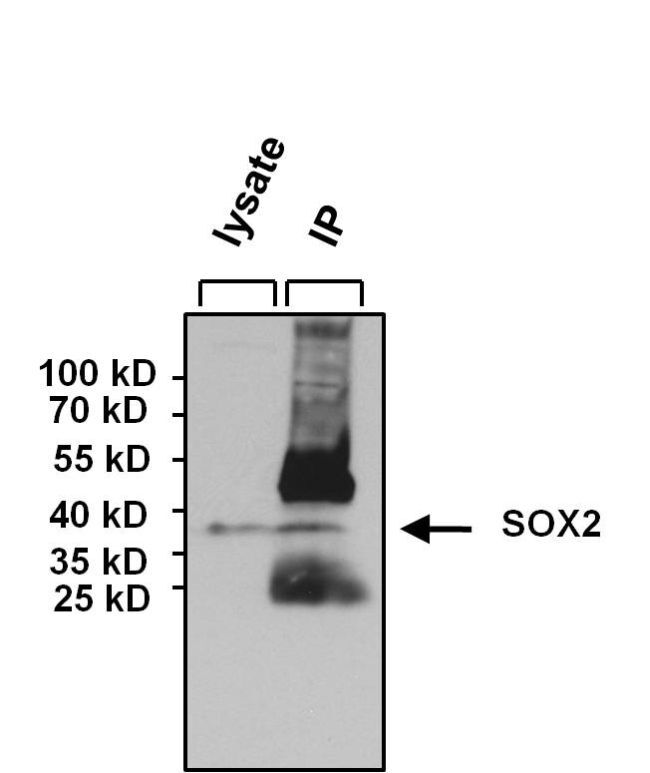
- Immunoprecipitation of SOX2 was performed on NCCIT cells. The antigen:antibody complex was formed by incubating 750 µg whole cell lysate with 5 µg of rabbit polyclonal antibody recognizing SOX2 (Product # PA1-094) overnight on a rocking platform at 4°C. The immune-complex was captured on 50 µL Protein A/G Plus Agarose (Product # 20423). Captured immune-complexes were washed and proteins eluted with 5X Reducing Sample Loading Dye (Product # 39000). IP and lysate control samples were resolved on a 4-20% Tris-HCl polyacrylamide gel. Proteins were transferred to PVDF membrane and blocked with 5% BSA/TBS-0.1%Tween for at least 1 hour. Membranes were probed with a rabbit polyclonal antibody recognizing SOX2 (Product # PA1-094) at a dilution of 1:1000 overnight at 4°C on a rocking platform. Membranes were washed in TBS-0.1%Tween 20 and probed with a goat anti-rabbit-HRP secondary antibody (Product # 31460) at a dilution of 1:20,000 for at least one hour. Membranes were washed and chemiluminescent detection performed using Super Signal West Pico (Product # 34078).
Supportive validation
- Submitted by
- Invitrogen Antibodies (provider)
- Main image
- Experimental details
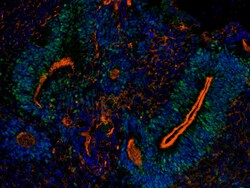
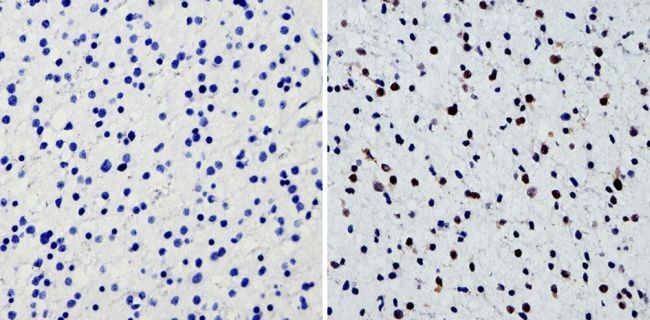
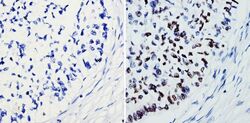
- Immunohistochemistry analysis of SOX2 showing staining in the nucleus of paraffin-treated human glioma tissue (right) compared with a negative control without primary antibody (left). To expose target proteins, antigen retrieval was performed using 10mM sodium citrate (pH 6.0), microwaved for 8-15 min. Following antigen retrieval, tissues were blocked in 3% H2O2-methanol for 15 min at room temperature, washed with ddH2O and PBS, and then probed with a SOX2 polyclonal antibody (Product # PA1-094) diluted by 3% BSA-PBS at a dilution of 1:200 overnight at 4°C in a humidified chamber. Tissues were washed extensively in PBST and detection was performed using an HRP-conjugated secondary antibody followed by colorimetric detection using a DAB kit. Tissues were counterstained with hematoxylin and dehydrated with ethanol and xylene to prep for mounting.
- Submitted by
- Invitrogen Antibodies (provider)
- Main image
- Experimental details
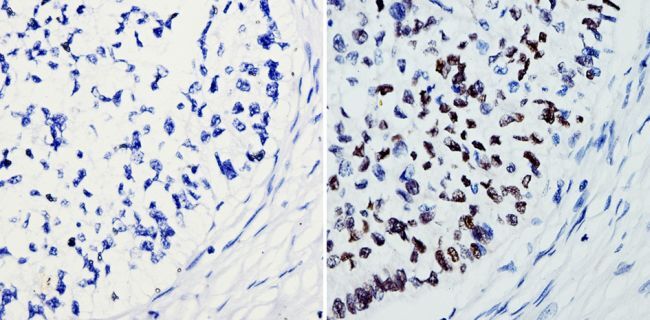
- Immunohistochemistry analysis of SOX2 showing staining in the nucleus of paraffin-treated human lung squamous carcinoma (right) compared with a negative control without primary antibody (left). To expose target proteins, antigen retrieval was performed using 10mM sodium citrate (pH 6.0), microwaved for 8-15 min. Following antigen retrieval, tissues were blocked in 3% H2O2-methanol for 15 min at room temperature, washed with ddH2O and PBS, and then probed with a SOX2 polyclonal antibody (Product # PA1-094) diluted by 3% BSA-PBS at a dilution of 1:100 overnight at 4°C in a humidified chamber. Tissues were washed extensively in PBST and detection was performed using an HRP-conjugated secondary antibody followed by colorimetric detection using a DAB kit. Tissues were counterstained with hematoxylin and dehydrated with ethanol and xylene to prep for mounting.
- Submitted by
- Invitrogen Antibodies (provider)
- Main image
- Experimental details
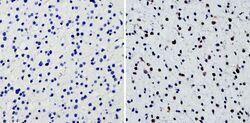
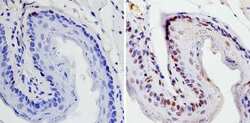
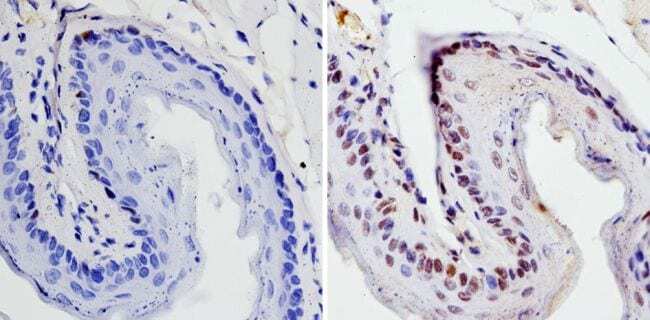
- Immunohistochemistry analysis of SOX2 showing staining in the nucleus of paraffin-treated mouse esophagus tissue (right) compared with a negative control without primary antibody (left). To expose target proteins, antigen retrieval was performed using 10mM sodium citrate (pH 6.0), microwaved for 8-15 min. Following antigen retrieval, tissues were blocked in 3% H2O2-methanol for 15 min at room temperature, washed with ddH2O and PBS, and then probed with a SOX2 polyclonal antibody (Product # PA1-094) diluted by 3% BSA-PBS at a dilution of 1:100 overnight at 4°C in a humidified chamber. Tissues were washed extensively in PBST and detection was performed using an HRP-conjugated secondary antibody followed by colorimetric detection using a DAB kit. Tissues were counterstained with hematoxylin and dehydrated with ethanol and xylene to prep for mounting.
- Submitted by
- Invitrogen Antibodies (provider)
- Main image
- Experimental details
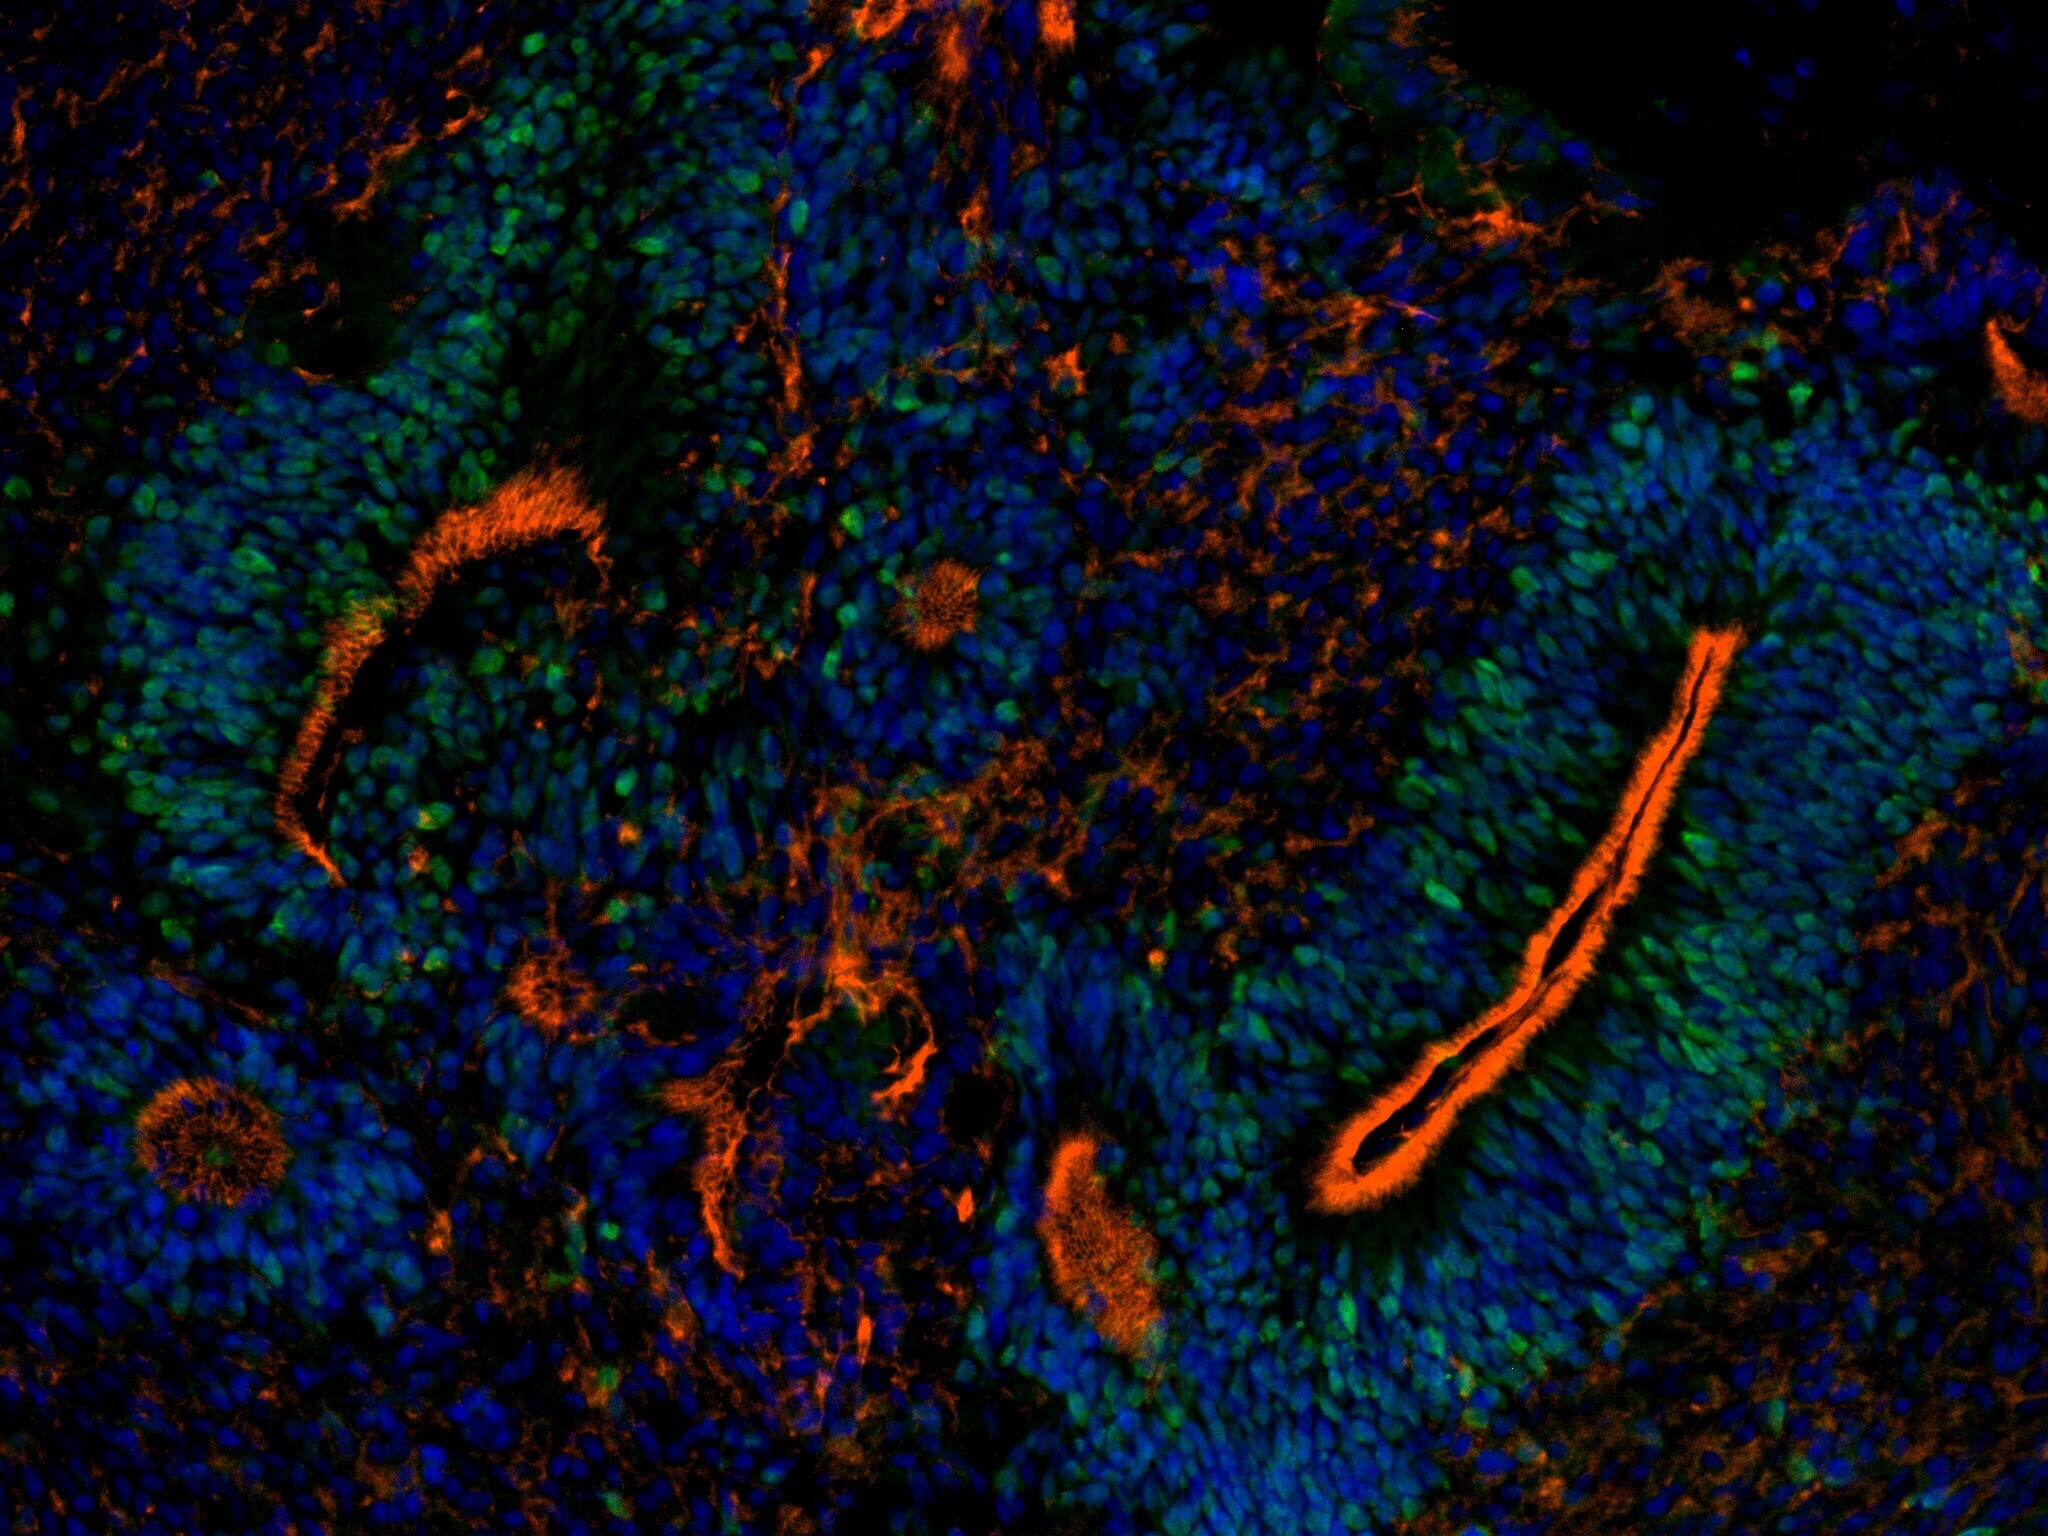
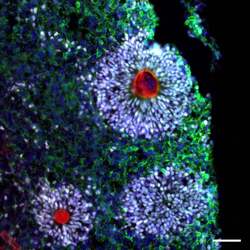
- Immunofluorescent analysis of NESTIN (green) and SOX2 (red) in human iPSC-derived forebrain organoids derived at Day 40. The organoids were fixed with 4% PFA for 1 hour at room temperature, followed by incubation with 30% sucrose solution overnight at 4°C. The organoids were then embedded in OCT and cryosectioned at 5 µm, permeabilized with 0.2% Triton X-100 for 20 min, and blocked with 10% donkey serum in PBS for 30 min at room temperature. Organoid slices were stained with a Mouse NESTIN monoclonal antibody (green; Product # MA1-110) at a dilution of 1:500, and a Rabbit SOX2 polyclonal antibody (red; Product # PA1-094X) at a dilution of 1:500 in blocking buffer overnight at 4°C, and then incubated with Donkey anti-Mouse Alexa Fluor 488 (Product # R37114) and Donkey anti-Rabbit Alexa Fluor 568 (Product # A10042) at a dilution of 1:1000 in blocking solution at room temperature for 1 hour. Images were taken at 20X magnification. Scale bar: 50 µm. Data courtesy of Dr. Zhexing Wen at Emory University.
- Submitted by
- Invitrogen Antibodies (provider)
- Main image
- Experimental details
- Immunohistochemistry was performed on frozen sections of Knifefish (Apteronotus leptorhynchus) brain tissue fixed with 2% paraformaldehyde and permeabilized with 0.3% Tissue sections were washed with TBS and blocked in a solution containing 3% serum, 1% BSA, 1% teleostean gelatin, 0.3% Triton X-100 in TBS, for 1 hour at room temperature. The primary antibody Sox2 (Product # PA1-094) (1:50 dilution) was applied overnight (~18 hours) at 4°C. After washing with TBS, the secondary antibody Alexa Fluor 546 - conjugated goat anti-rabbit IgG (Product # A-11035, 1:200) was applied for 2 hours at room temperature. Sections were counterstained with DAPI. Images were taken with a Zeiss 710 confocal microscope at 63X. Note: Data courtesy of Innovators program. Antibody staining shows specific nuclear localization of Sox2 in stem/progenitor cells in the brain. Calibration bar = 10µm.

- Submitted by
- Invitrogen Antibodies (provider)
- Main image
- Experimental details
- Immunofluorescent analysis of ZO-1 (red) and SOX2 (grey) in human iPSC-derived forebrain organoids derived at Day 40. The organoids were fixed with 4% PFA for 1 hour at room temperature, followed by incubation with 30% sucrose solution overnight at 4°C. The organoids were then embedded in OCT and cryosectioned at 5 µm, permeabilized with 0.2% Triton X-100 for 20 min, and blocked with 10% donkey serum in PBS for 30 min at room temperature. Organoid slices were stained with a Mouse ZO-1 monoclonal antibody (red; Product # 33-9100) at a dilution of 1:500, a Rabbit SOX2 polyclonal antibody (grey; Product # PA1-094X) at a dilution of 1:500, and a Chicken MAP2 polyclonal antibody (green) at a dilution of 1:1000 in blocking buffer overnight at 4°C, and then incubated with Donkey anti-Mouse Alexa Fluor 568 (Product # A10037), Donkey anti-Rabbit Alexa Fluor 647 (Product # A-31573), and Donkey Anti-Chicken Alexa Fluor 488 at a dilution of 1:1000 as well as DAPI (blue; 1:25000) in blocking solution at room temperature for 1 hour. Images were taken at 20X magnification. Scale bar: 50 µm. Data courtesy of Dr. Zhexing Wen at Emory University.

Supportive validation
- Submitted by
- Invitrogen Antibodies (provider)
- Main image
- Experimental details
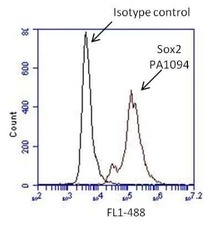
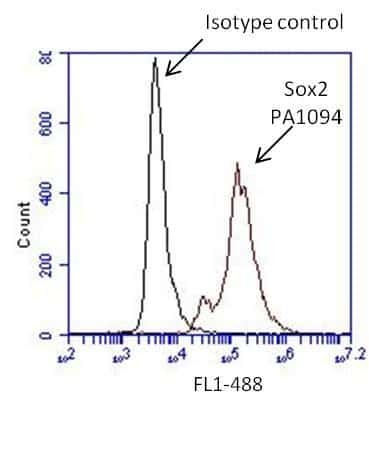
- Flow cytometry analysis of Sox2 on human neural stem cells derived from PD-3 iPSCs using Gibco® PSC Neural Induction Medium (Product # A1647801). Cells were fixed, permeabilized and stained with a Sox2 polyclonal antibody (Product # PA1-094, red histogram) or Rabbit IgG isotype control (Product # 31235, black histogram) at a 1:100 dilution in 5% BSA. After incubation of the primary antibody for 1 hour on ice, the cells were stained with a DyLight 488-conjugated goat anti-rabbit IgG secondary antibody (Product # 35552) at a dilution of 1:500 for 1 hour on ice. A representative 10,000 cells were acquired for each sample.
- Submitted by
- Invitrogen Antibodies (provider)
- Main image
- Experimental details
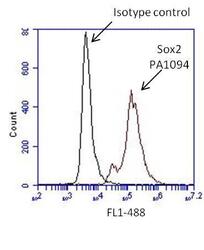
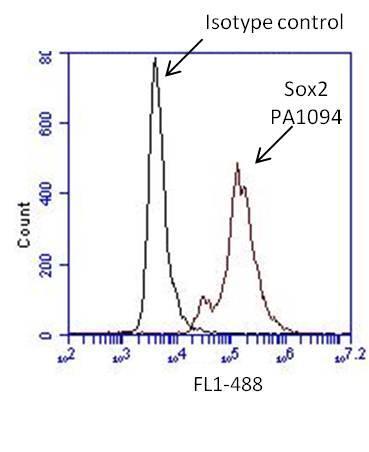
- Flow cytometry analysis of Sox2 on human neural stem cells derived from PD-3 iPSCs using Gibco® PSC Neural Induction Medium (Product # A1647801). Cells were fixed, permeabilized and stained with a Sox2 polyclonal antibody (Product # PA1-094, red histogram) or Rabbit IgG isotype control (Product # 31235, black histogram) at a 1:100 dilution in 5% BSA. After incubation of the primary antibody for 1 hour on ice, the cells were stained with a DyLight 488-conjugated goat anti-rabbit IgG secondary antibody (Product # 35552) at a dilution of 1:500 for 1 hour on ice. A representative 10,000 cells were acquired for each sample.
Supportive validation
- Submitted by
- Invitrogen Antibodies (provider)
- Main image

- Experimental details
- Immunoprecipitation of SOX2 was performed on NCCIT cells. The antigen:antibody complex was formed by incubating 750 µg whole cell lysate with 5 µg of rabbit polyclonal antibody recognizing SOX2 (Product # PA1-094) overnight on a rocking platform at 4°C. The immune-complex was captured on 50 µL Protein A/G Plus Agarose (Product # 20423). Captured immune-complexes were washed and proteins eluted with 5X Reducing Sample Loading Dye (Product # 39000). IP and lysate control samples were resolved on a 4-20% Tris-HCl polyacrylamide gel. Proteins were transferred to PVDF membrane and blocked with 5% BSA/TBS-0.1%Tween for at least 1 hour. Membranes were probed with a rabbit polyclonal antibody recognizing SOX2 (Product # PA1-094) at a dilution of 1:1000 overnight at 4°C on a rocking platform. Membranes were washed in TBS-0.1%Tween 20 and probed with a goat anti-rabbit-HRP secondary antibody (Product # 31460) at a dilution of 1:20,000 for at least one hour. Membranes were washed and chemiluminescent detection performed using Super Signal West Pico (Product # 34078).

- Submitted by
- Invitrogen Antibodies (provider)
- Main image
- Experimental details
- NULL
- Submitted by
- Invitrogen Antibodies (provider)
- Main image
- Experimental details
- NULL
- Submitted by
- Invitrogen Antibodies (provider)
- Main image
- Experimental details
- NULL
- Submitted by
- Invitrogen Antibodies (provider)
- Main image
- Experimental details
- NULL
- Submitted by
- Invitrogen Antibodies (provider)
- Main image
- Experimental details
- NULL
- Submitted by
- Invitrogen Antibodies (provider)
- Main image
- Experimental details
- NULL
- Submitted by
- Invitrogen Antibodies (provider)
- Main image
- Experimental details
- NULL
- Submitted by
- Invitrogen Antibodies (provider)
- Main image
- Experimental details
- NULL
- Submitted by
- Invitrogen Antibodies (provider)
- Main image
- Experimental details
- NULL
- Submitted by
- Invitrogen Antibodies (provider)
- Main image
- Experimental details
- NULL
- Submitted by
- Invitrogen Antibodies (provider)
- Main image
- Experimental details
- NULL

- Submitted by
- Invitrogen Antibodies (provider)
- Main image
- Experimental details
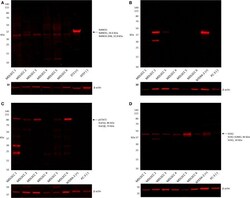
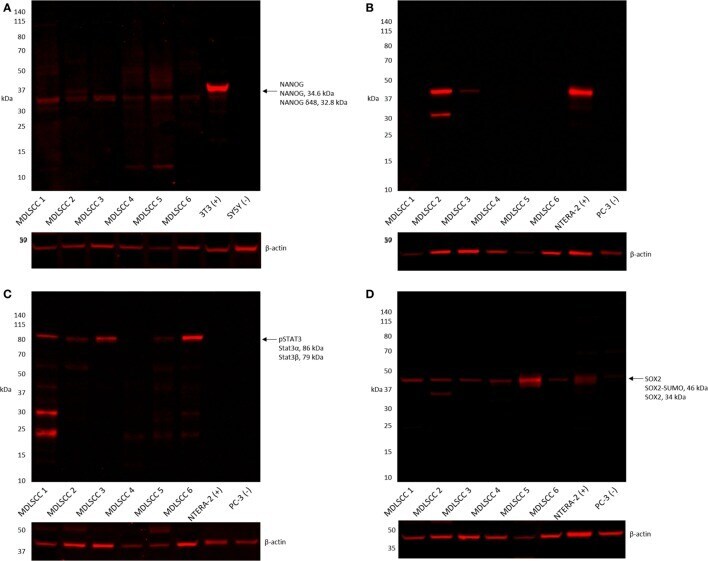
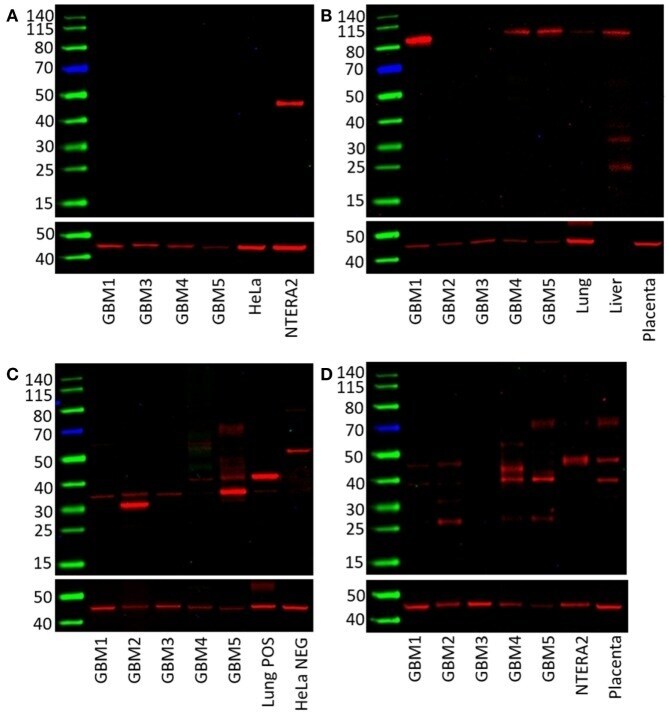
- Figure 4 Representative western blot analysis performed on six moderately differentiated lip squamous cell carcinoma samples demonstrating detection of NANOG across all six samples (A), octamer-binding transcription factor 4 in two samples (B), phosphorylated signal transducer and activator of transcription 3 in five samples (C), and sex-determining region Y-box 2 in all six samples (D) .
- Submitted by
- Invitrogen Antibodies (provider)
- Main image

- Experimental details
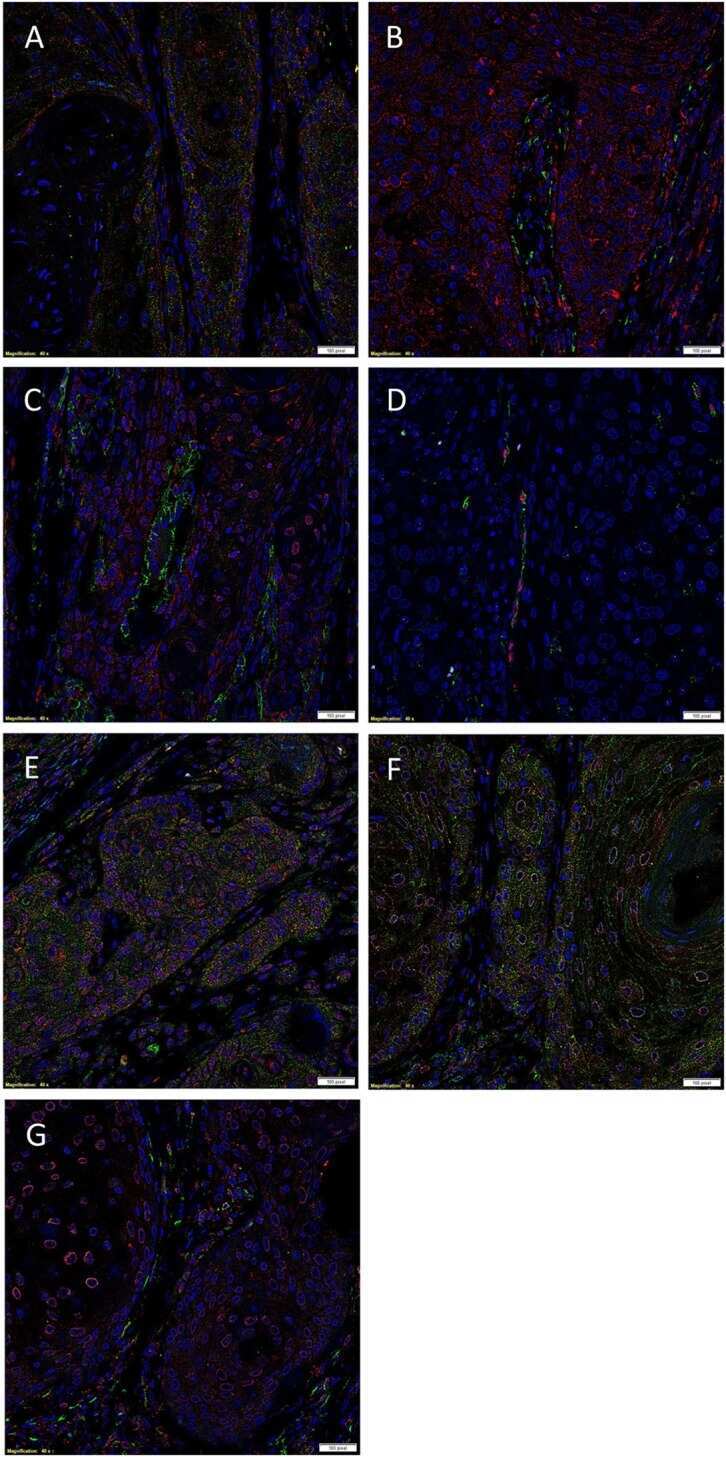
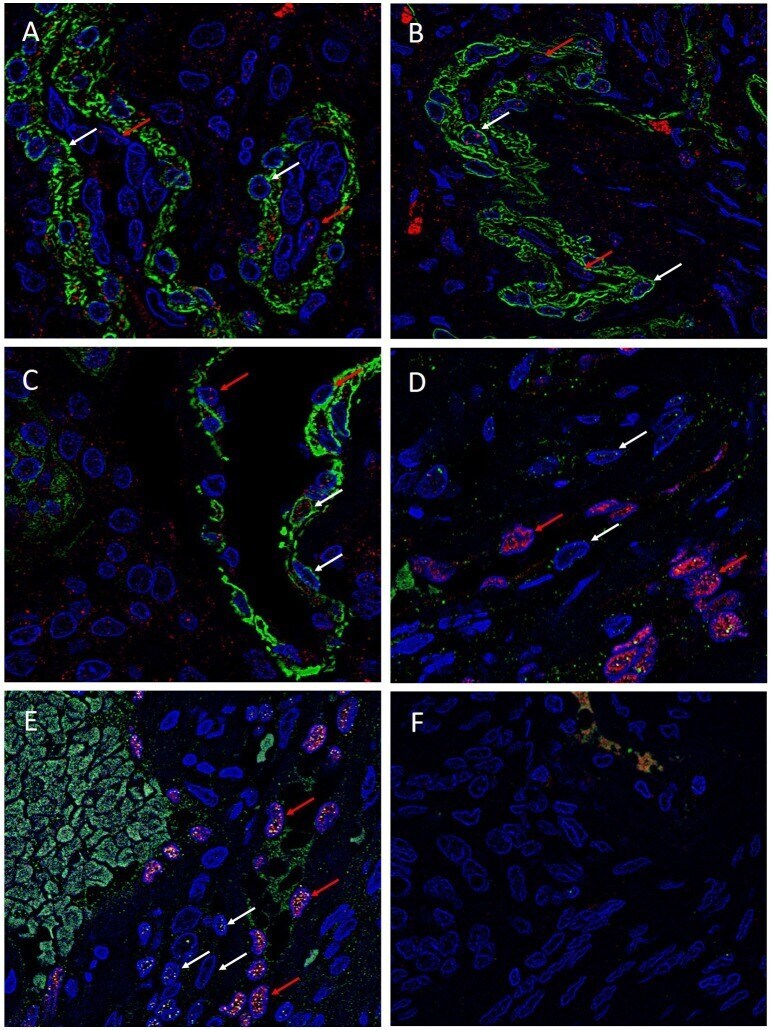
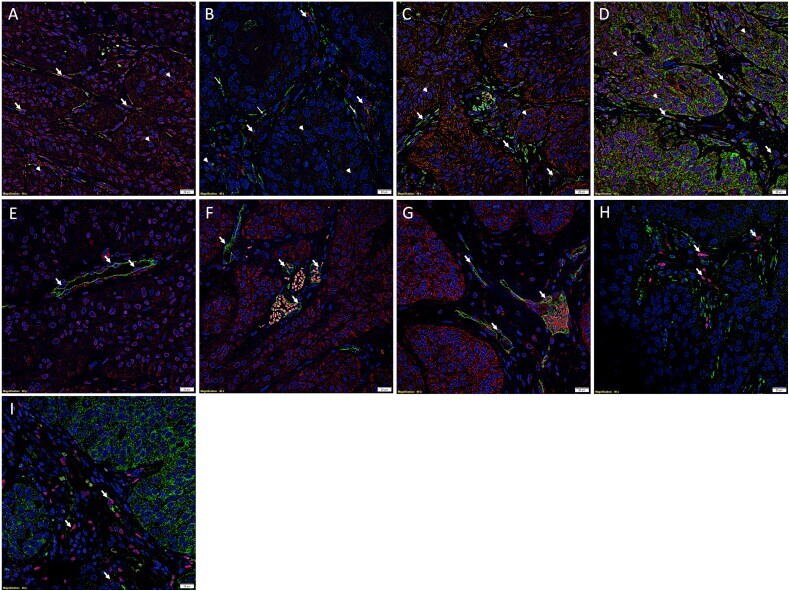
- Figure 4 Representative immonoflourescence immunohistochemical stained images of WHO grade I meningioma demonstrating the expression of SOX2 ( A , red), NANOG ( B , red), KLF4 ( C , red), OCT4 ( D , green) and c-MYC ( E , green) on both the SMA + ( A-C , red, red arrows ) pericyte layer, and the ERG + endothelial layer ( D,E , red, white arrows ). Cell nuclei were counterstained with 4', 6'-diamino-2-phenylindole (A-F) , blue. Original magnification: 600X.
- Submitted by
- Invitrogen Antibodies (provider)
- Main image
- Experimental details
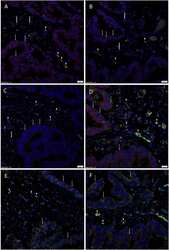
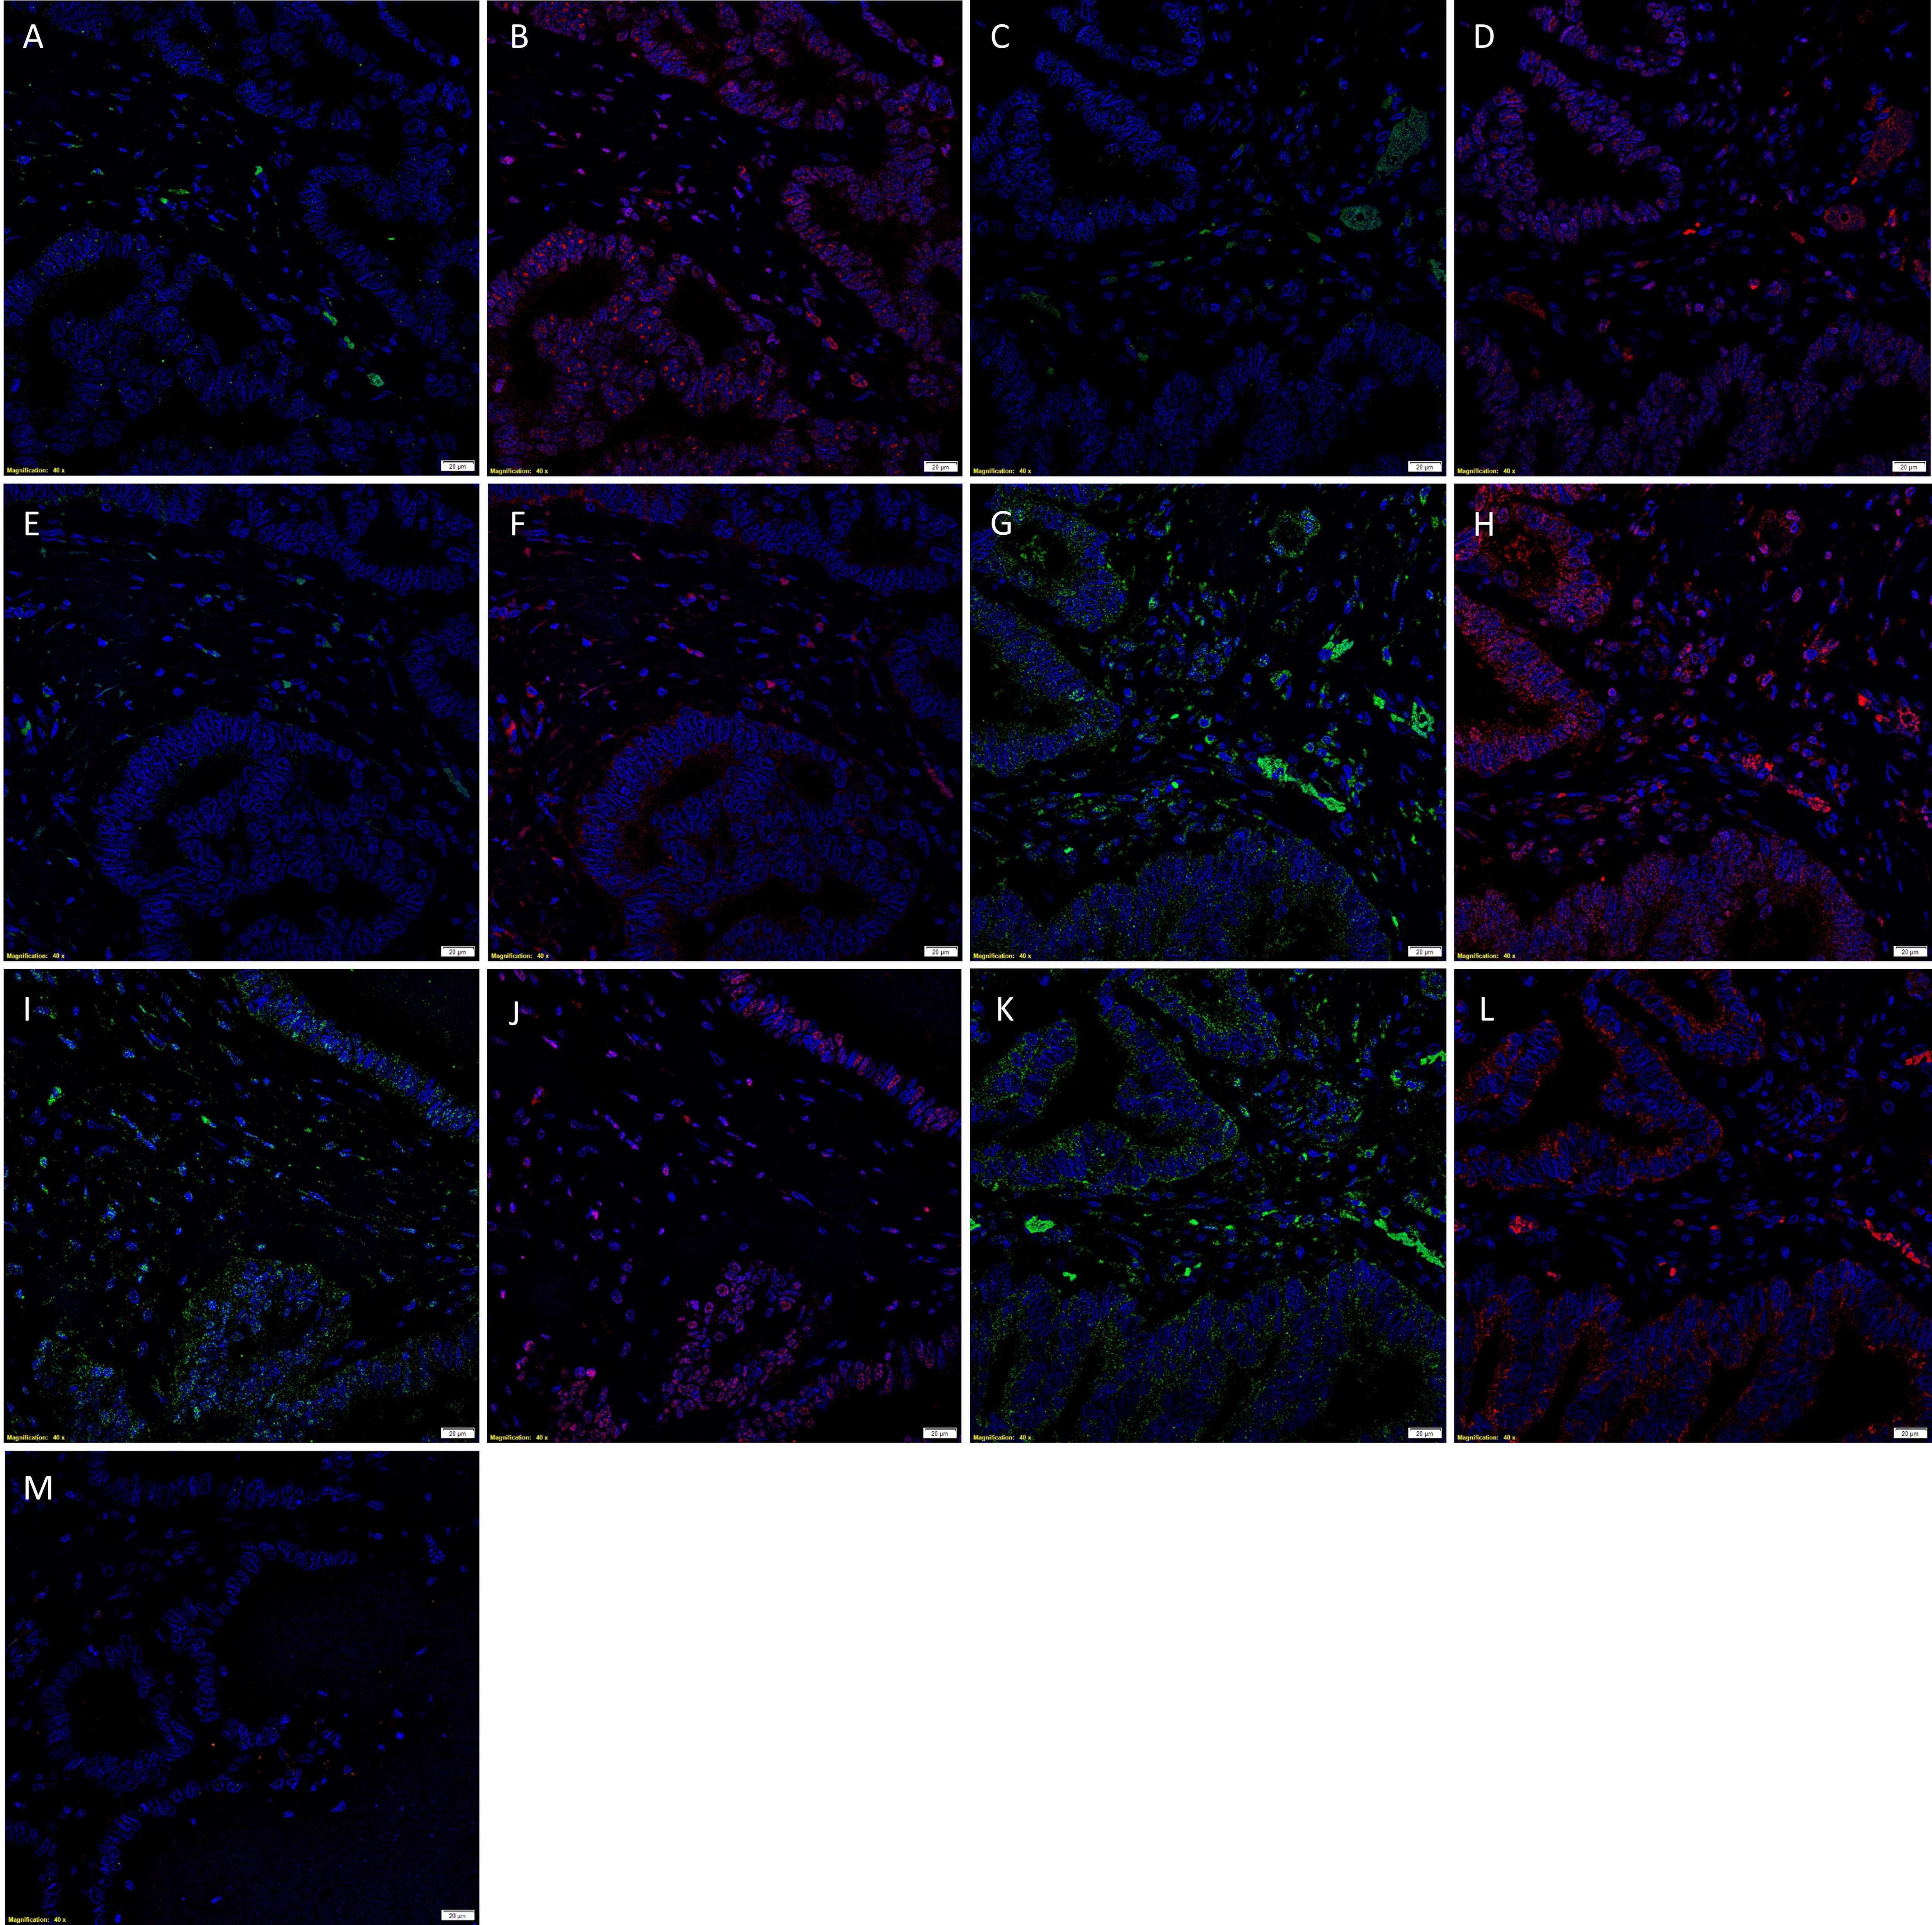
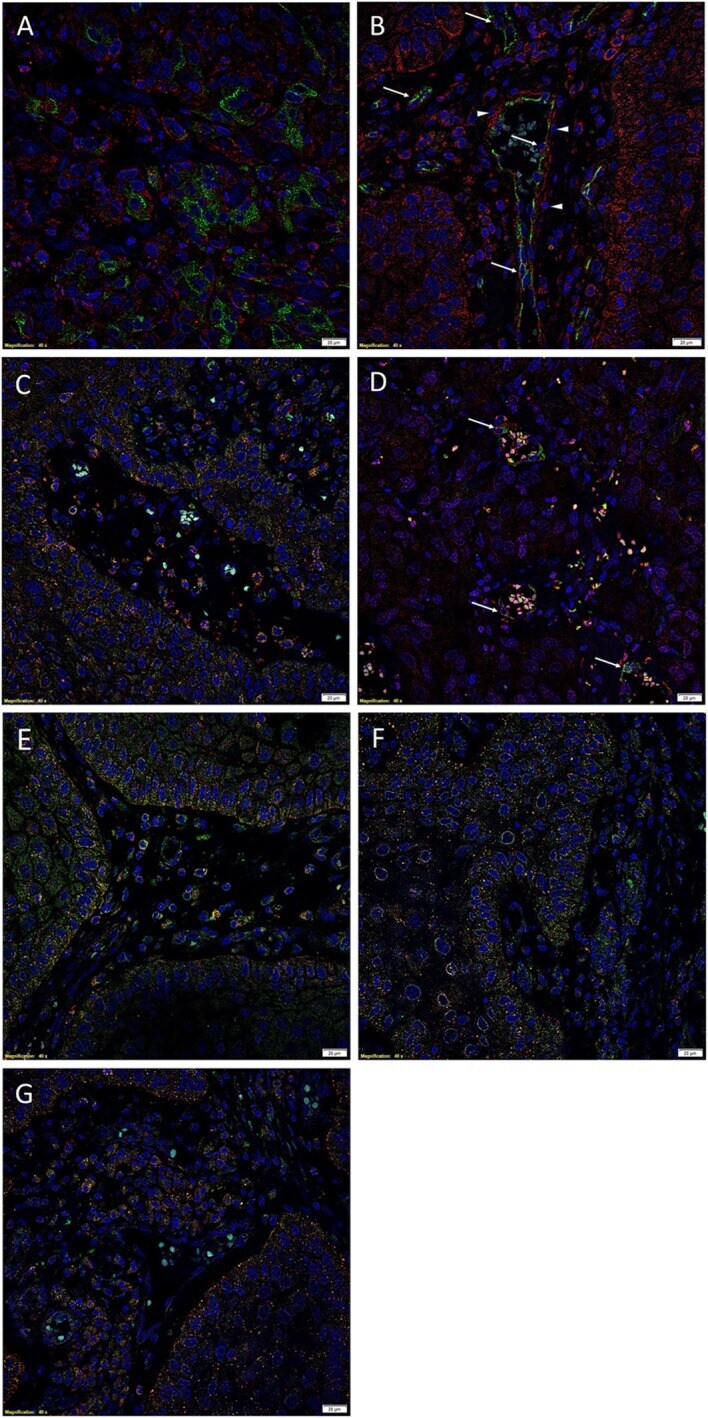
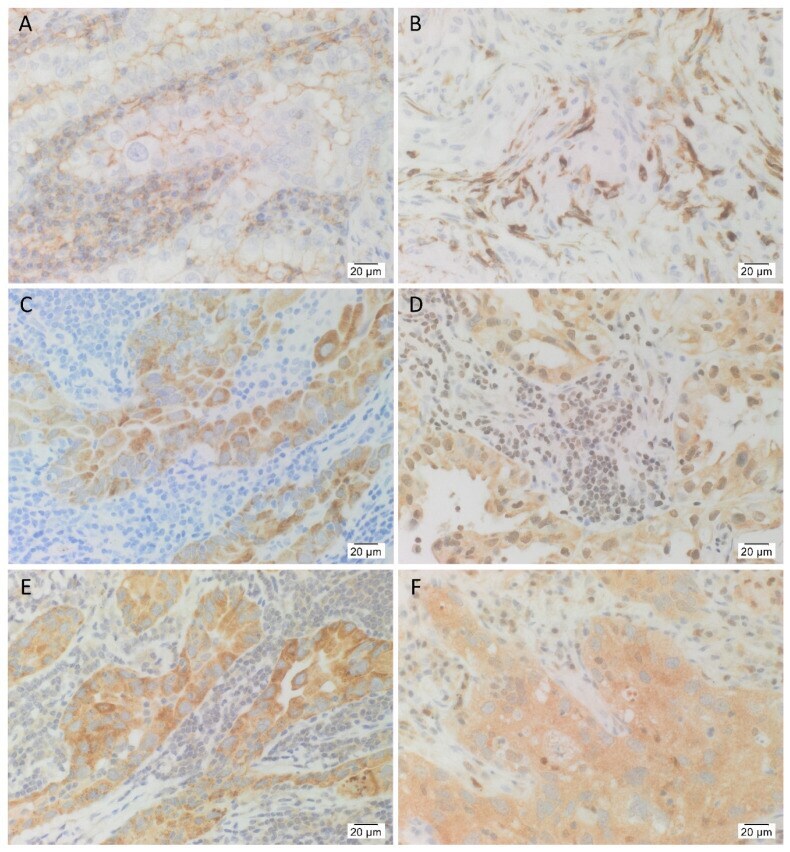
- Figure 2 Representative immunofluorescent (IF) immunohistochemical (IHC)-stained sections of moderately differentiated oral tongue squamous cell carcinoma showing PRR (A and B, red) were expressed by the cancer stem cells (CSC) within the tumour nests (TNs) that expressed SALL4 (A, green) as well as those that expressed OCT4 (A, green). ACE (C, green) was expressed on the endothelium of the microvessels within the stroma, but not the cells within the TNs that stained positively for SOX2 (C, red). ATIIR2 (D and E, red) was expressed by cells within the TNs that expressed SALL4 (D, green) but not those that expressed OCT4 (E, green). ATIIR1 (F, green) was localised to the CSC expressing SOX2 (F, red) within the TNs and cells within the stroma, between the TNs (F, green, arrowheads ). PRR (G, red) and ATIIR1 (G, green) were colocalised to cells within the TNs and those within the stroma and the endothelium within the stroma. Scale bars: 20 mum.
- Submitted by
- Invitrogen Antibodies (provider)
- Main image
- Experimental details
- Figure 2 Representative immunofluorescent immunohistochemical-stained sections of moderately differentiated buccal mucosal squamous cell carcinoma demonstrating PRR [(A), red] was expressed by cells within the tumor nests that stained positively for EMA [(A), green] . PRR [ (B) , red] was also expressed by the CD34 + [ (B) , green] endothelium of the microvessels. In addition, RRR [ (C) , red] was expressed by cells within the peri-tumoral stroma, which also expressed OCT4 [ (C) , green]. ACE [ (D) , green] was expressed on the endothelium of the microvessels, which also expressed SOX2 [ (D) , red], within the peri-tumoral stroma. Cytoplasmic expression of ATIIR1 [ (E) , green] and PRR [ (E) , red] was demonstrated in cells within the tumor nests, the peri-tumoral stroma, and the endothelium of the microvessels within the peri-tumoral stroma. ATIIR2 [ (F,G) , red] was expressed by cells within the tumor nests that expressed SALL4 [ (F) , green] and OCT4 [ (G) , green]. Cell nuclei were counterstained with 4',6'-diamidino-2-phenylindole [ (A-G) , blue]. Scale bars: 20 mum.
- Submitted by
- Invitrogen Antibodies (provider)
- Main image
- Experimental details
- Fig. 2. Representative DAB immunohistochemical-stained slides of DD cords (A, C, E, G, and I) and nodules (B, D, F, H, and J) showing the expression of OCT4 (A and B; brown), NANOG (C and D; brown), SOX2 (E and F; brown), SALL4 (G and H; brown), and pSTAT3 (I and J; brown) on the microvessels within DD tissues. The expression of OCT4 (E and F), NANOG (C and D), SOX2 (E and F), and pSTAT3 (I and J) was localized to the endothelium of the microvessels, whereas SALL4 (G and H) was primarily localized to the pericyte layer of the microvessels. Original magnification: x400.
- Submitted by
- Invitrogen Antibodies (provider)
- Main image
- Experimental details
- Fig. 3. Representative immunofluorescent immunohistochemical-stained sections of DD cords, demonstrating coexpression of the endothelial markers ERG (A, red) on the CD34 + endothelium (A, green). OCT4 (B, green) and SALL4 (C, green) were localized to the ERG + endothelium of the microvessels (B and C; red). SOX2 (D, red), pSTAT3 (E, red), and NANOG (F, red) were expressed on the CD34 + endothelium (D-F, green). The nuclei were counterstained with 4'6-diamino-2-phenylindole (A-F, blue). Scale bar: 20 um.
- Submitted by
- Invitrogen Antibodies (provider)
- Main image

- Experimental details
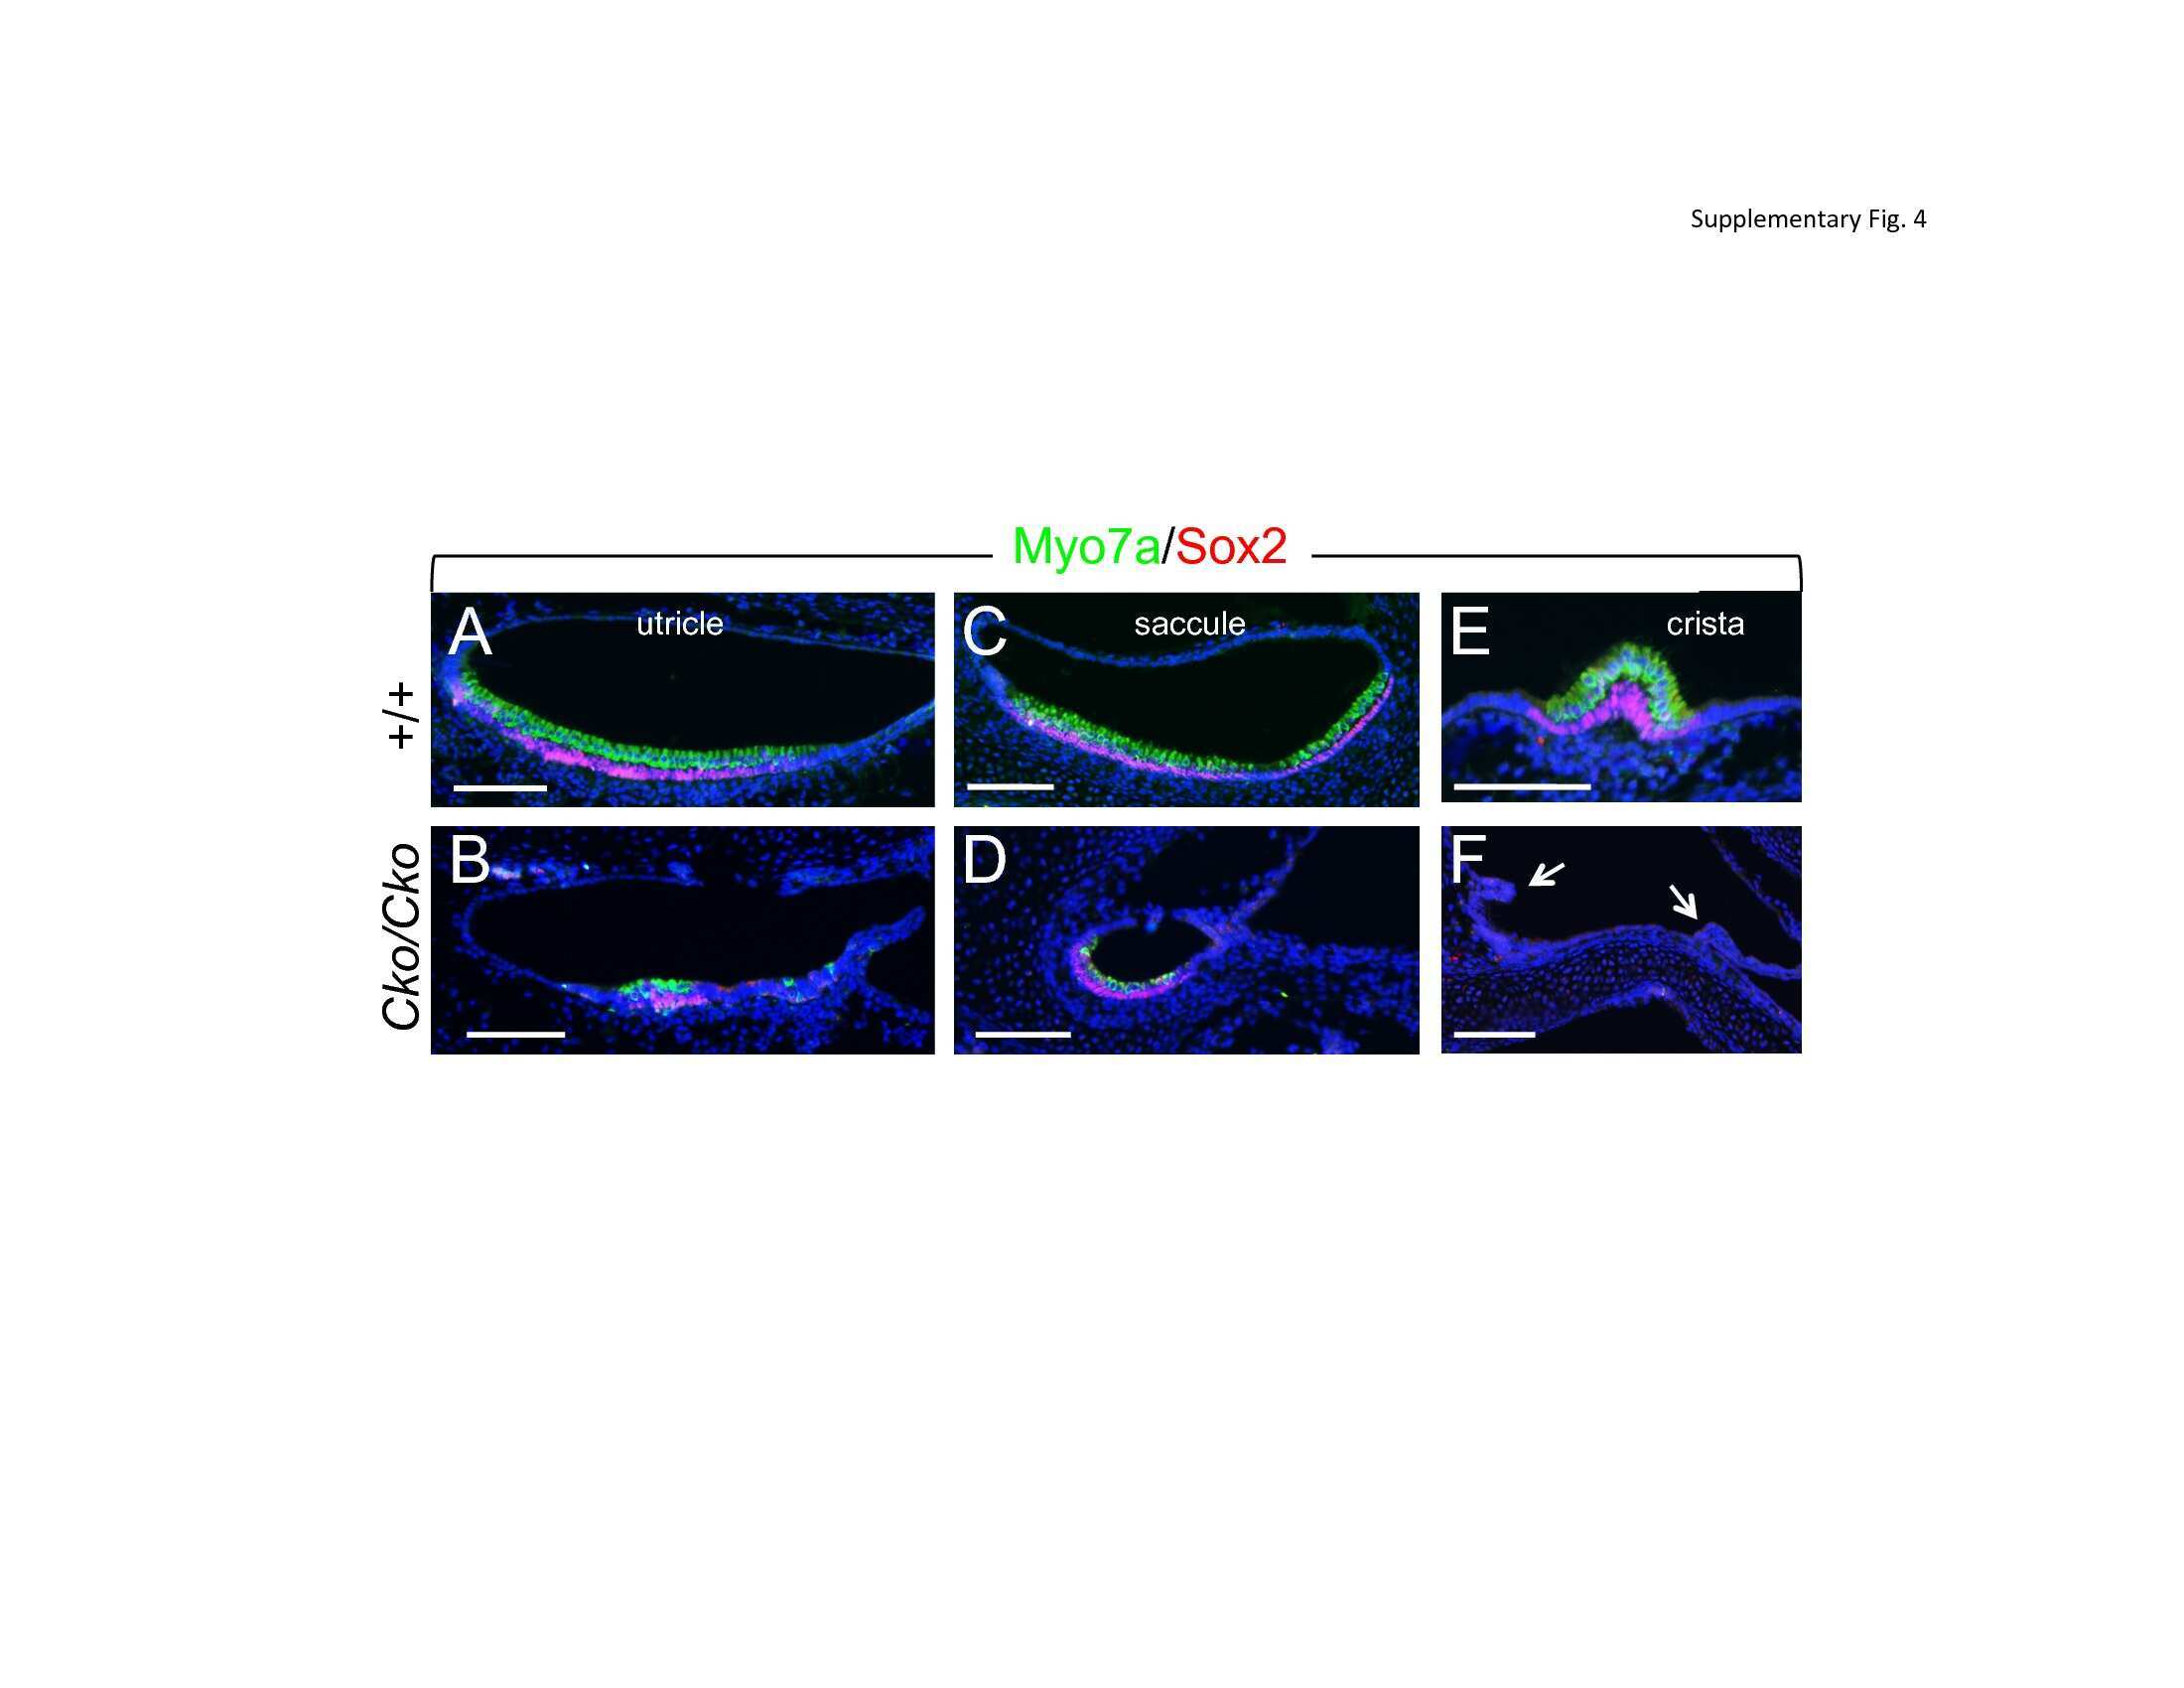
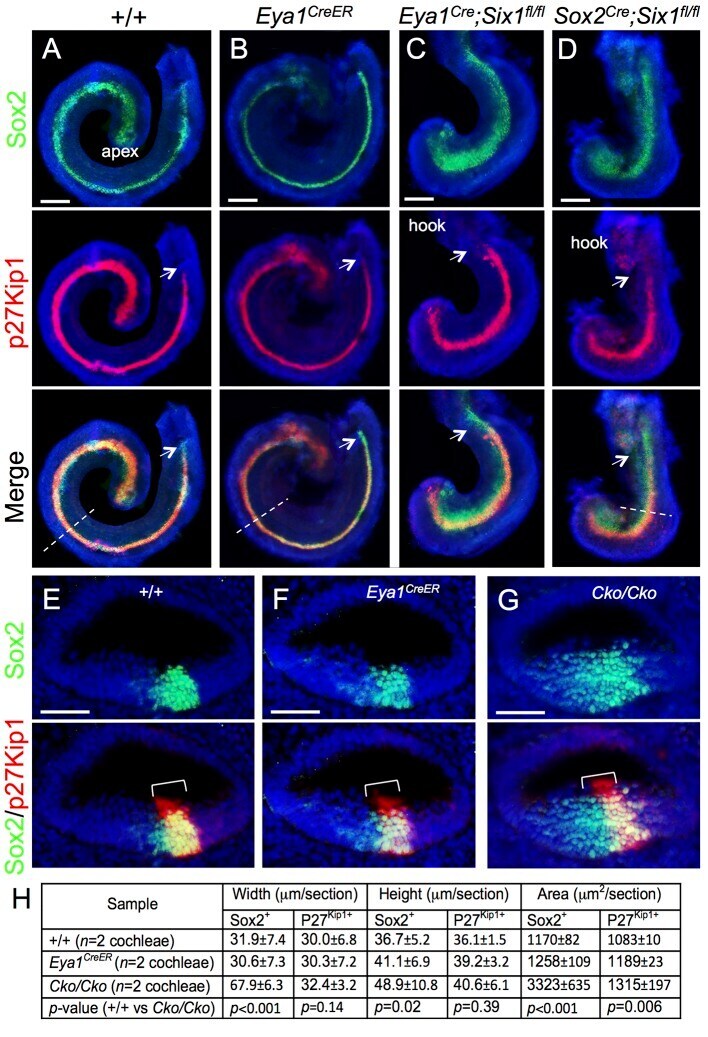
- Fig 1 Deletion of Six1 in the developing cochlea using Eya1 CreER or Sox2 CreER leads to shortened and thickened prosensory primordium. Cochleae were dissected from E14.5 embryos given tamoxifen at E11.5 (9 am) and E12.5 (9 am) and processed for whole-mount (A-D) or section (E-G) immunostaining with anti-Sox2 (green) and -p27 Kip1 (red). Hoechst was used for nuclear-counter staining. (E-G) Section collected from mid-cochlear duct in wild-type, Eya1 CreER or Sox2 CreER ;Six1 fl/fl ( Cko/Cko ) littermates as indicated by dashed line in A, B, D respectively. Bracket indicates p27 Kip1 -positive prosensory domain within the cochlea epithelium and its width on mediolateral axis is comparable between control and mutant littermates. (H) Spatial calibration of Sox2 + and p27 Kip1+ width, height and square area and value represents average number (+-standard deviations) per section (6 mum) (see Methods for calibration). P- value was measured for +/+ and Cko/Cko using Two-tailed Student's t-test. Scale bars: 200 mum in A-C and 40 mum in D,E.
- Submitted by
- Invitrogen Antibodies (provider)
- Main image

- Experimental details
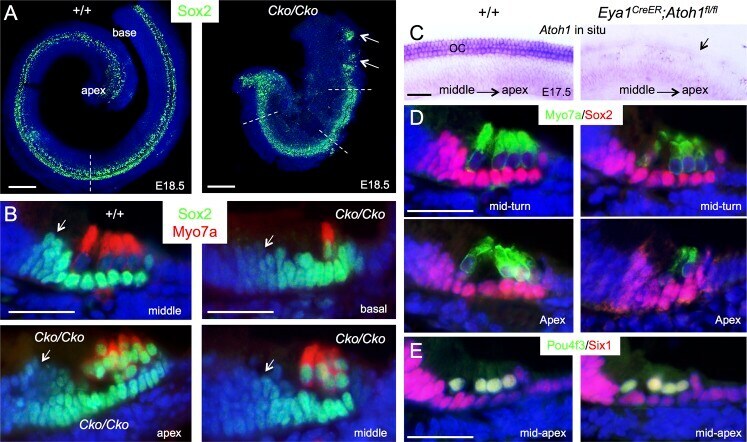
- Fig 3 Downregulation of Sox2 in differentiating hair cells is disrupted in Six1 CKO. (A) Immunostaining for Sox2 (green) on whole-mount and (B) Sox2 (green)/Myo7a (red) on sections of cochleae from wild-type or Six1 CKO ( Eya1 CreER ;Six1 fl/fl ) littermate embryos at E18.5 (given tamoxifen at E11.5-12.5). Cochlear section region was indicated by dashed line in A. Arrows point to Sox2 expression in the GER cells flanking the inner hair cells. (C) Atoh1 in situ hybridization showing Atoh1 expression in the organ of Corti in wild-type embryos at E17.5 and absence of Atoh1 in Atoh1 fl/fl ;Eya1 CreER littermate embryos (arrow) given tamoxifen at E14.75-15.5. (D) Immunostaining for Myo7a (green) and Sox2 (red) on cochlear sections from E17.5 wild-type or Eya1 CreER ;Atoh1 fl/fl littermate embryos given tamoxifen at E14.75-15.5. (E) Immunostaining for Pou4f3 (green) and Six1 (red) on cochlear sections from E17.5 wild-type and Eya1 CreER ;Atoh1 fl/fl littermate embryos given tamoxifen at E14.75-15.5. Scale bars: 200 mum in A; 30 mum in B,D,E; 40 mum in C.
- Submitted by
- Invitrogen Antibodies (provider)
- Main image
- Experimental details
- Figure 1 Representation of immunofluorescent (IF) immunohistochemical (IHC)-stained sections of 10 moderately differentiated oral tongue squamous cell carcinoma, demonstrating nuclear co-expression of the epithelial cell marker p63 (A, green) and the cancer stem cell (CSC) marker SOX2 (A, red), within the tumour nests. The SOX2 + population (B, red) was distinct from the CSC population that expressed OCT4 (B, green). The OCT4 + (C, green) cells were distinct from the CSC that expressed NANOG (C, red). Further staining with SALL4 demonstrated that the SALL4 + cells (D and E, green) also expressed NANOG (D, red) and SOX2 (E, red); this combination of the green and red stains displayed as orange (D and E). The SOX2 + (F, red) cells also expressed the membranous CSC marker CD44 (F, green). The CD44 + (G, green) cells also expressed the CSC marker pSTAT3 (G, red). Scale bars: 20 mum.
- Submitted by
- Invitrogen Antibodies (provider)
- Main image
- Experimental details
- Figure 2 Representative images of IF IHC-stained sections of GBM tissue for ESC markers . SOX2 [ (A) , red, arrows ], NANOG [ (B) , red, arrows ], and pSTAT3 [ (C) , red, arrows ] all showed nuclear expression on GFAP+ tumor cells [ (A-C) , green]. OCT4 [ (D) , red, arrows ] staining was scarce and solely cytoplasmic in GFAP+ tumor cells. SALL4 [ (E) , green] and SOX2 [ (E) , red] were co-expressed ( arrows ) in the nuclei of some tumor cells, with SALL4 also staining SOX2-negative cells. Cell nuclei were counterstained with 4', 6'-diamidino-2-phenylindole [(A-E), blue]. Scale bars: 20 mum.

- Submitted by
- Invitrogen Antibodies (provider)
- Main image
- Experimental details
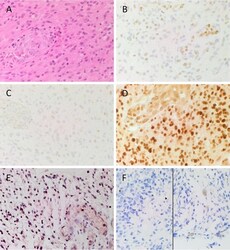
- Figure 1 Representative image of H&E stained slides showing the presence of GBM (A) and DAB IHC-stained slides of GBM tissue demonstrating expression of CSC markers (B-F) . pSTAT3 [ (B) , brown] was expressed in the nuclei of tumor and endothelium of the microvessels throughout the sample. SALL4 [ (C) , brown] was predominantly expressed on the nuclei of the tumor cells, and the cytoplasm of the endothelial cells lining the microvessels. SOX2 [ (D) , brown] displayed strong nuclear staining of the tumor cells, and moderate cytoplasmic staining of the endothelium of the microvessels. Nuclear expression of NANOG [ (E) , pink/red] was observed on the tumor cells, and to the lesser extent on the endothelium of the microvessels. Nuclear and cytoplasmic staining of OCT4 [ (F) , brown] was observed in few tumor cells. Cell nuclei were counterstained with hematoxylin [ (A-F) , blue]. Original magnification: 400X.

- Submitted by
- Invitrogen Antibodies (provider)
- Main image

- Experimental details
- Figure 3 Western blots of five GBM tissue samples . OCT4 was not detected (A) , pSTAT3 at ~90 kDa was found in three out of five samples (B) , NANOG was present in all five samples with multiple bands at approximately 40 and 31 kDa (C) . SOX2 was detected in four out of five samples with bands at approximately 45 and 38 kDa (D) .
- Submitted by
- Invitrogen Antibodies (provider)
- Main image
- Experimental details
- Figure 2 Representative immunofluorescent immunohistochemical-stained sections of moderately differentiated lip squamous cell carcinoma demonstrating the expression of sex-determining region Y-box 2 (SOX2) [(A), red] by the EMA + [(A), green] cells within the TNs and the stroma . SOX2 [ (B,C) , red] was expressed by cells within both the TNs and the stroma that expressed CD44 [ (B) , green] and spalt-like transcription factor 4 [ (C) , green]. Expression of NANOG [ (D) , red] and phosphorylated signal transducer and activator of transcription 3 [ (E) , red] was seen in cells within the TNs and the stroma that expressed CD44 [ (D,E) , green]. Octamer-binding transcription factor 4 [ (F) , green] was expressed in a proportion of cells within the stroma that expressed SOX2 [ (F) , red]. Cell nuclei were counterstained with 4',6-diamidino-2-phenylindole [ (A-F) , blue]. Scale bars: 20 mum.
- Submitted by
- Invitrogen Antibodies (provider)
- Main image
- Experimental details
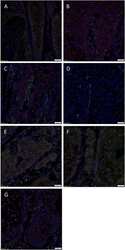
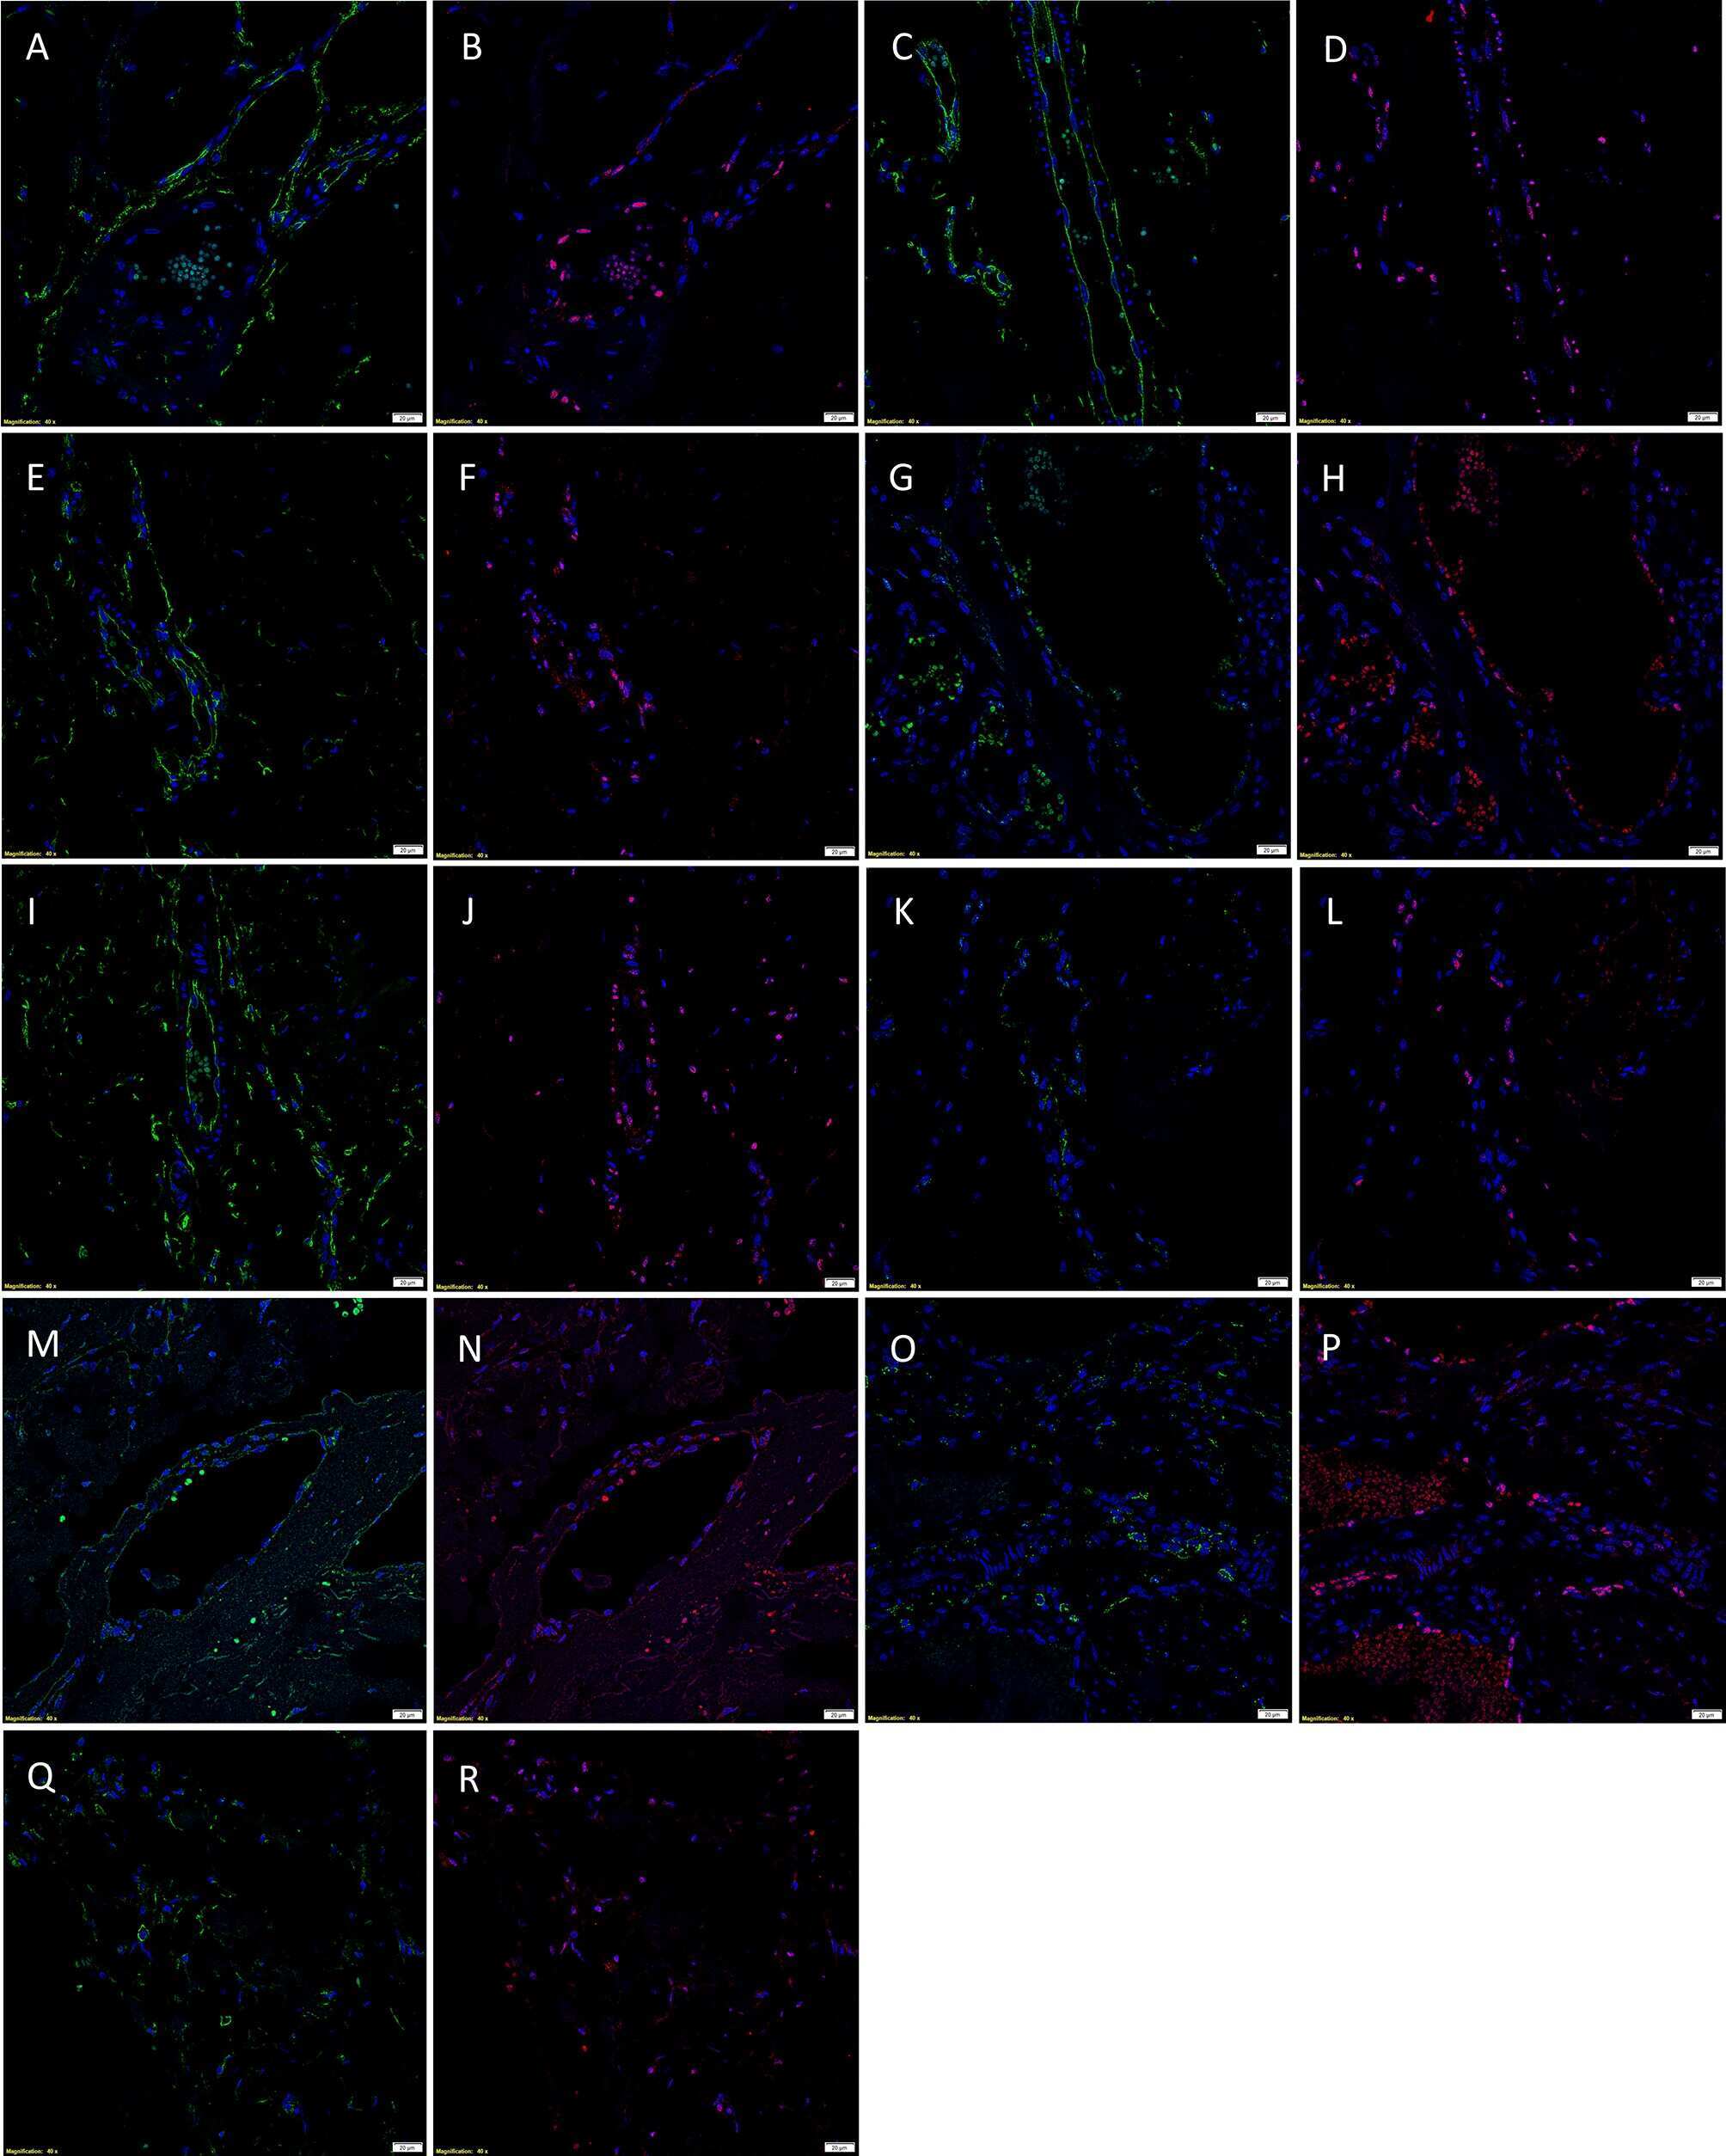
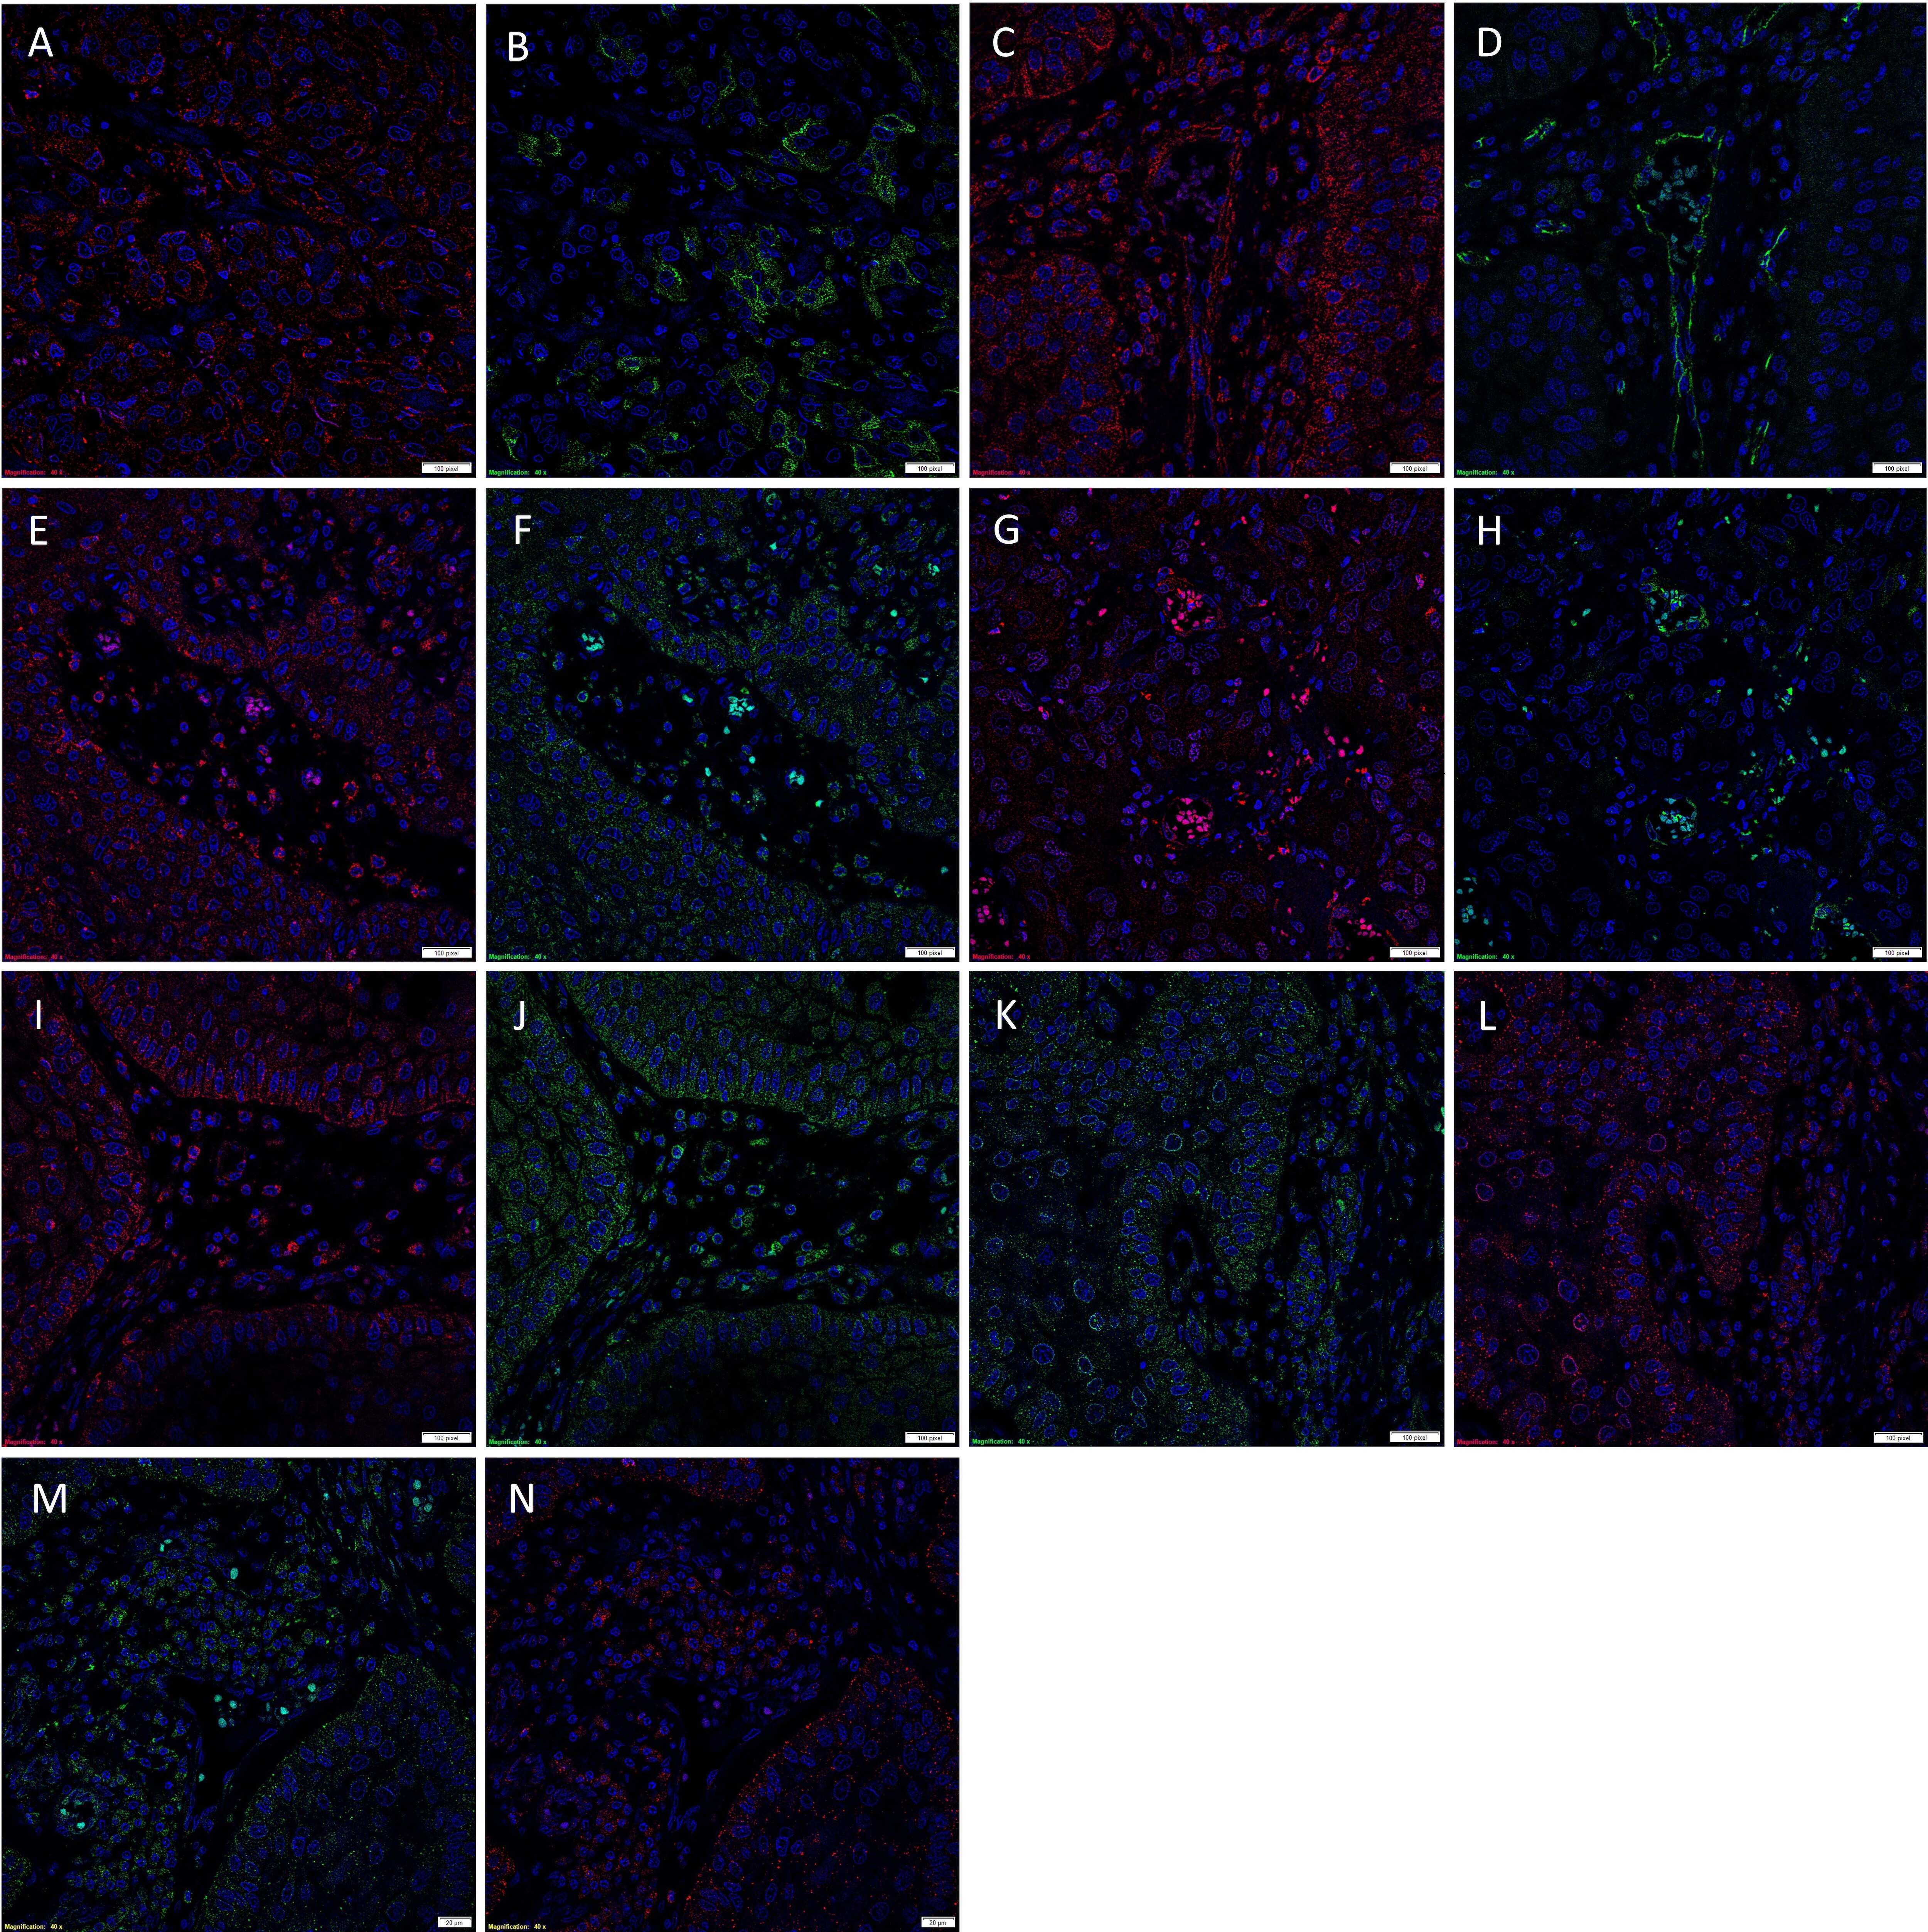
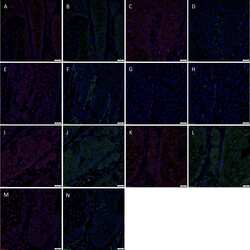
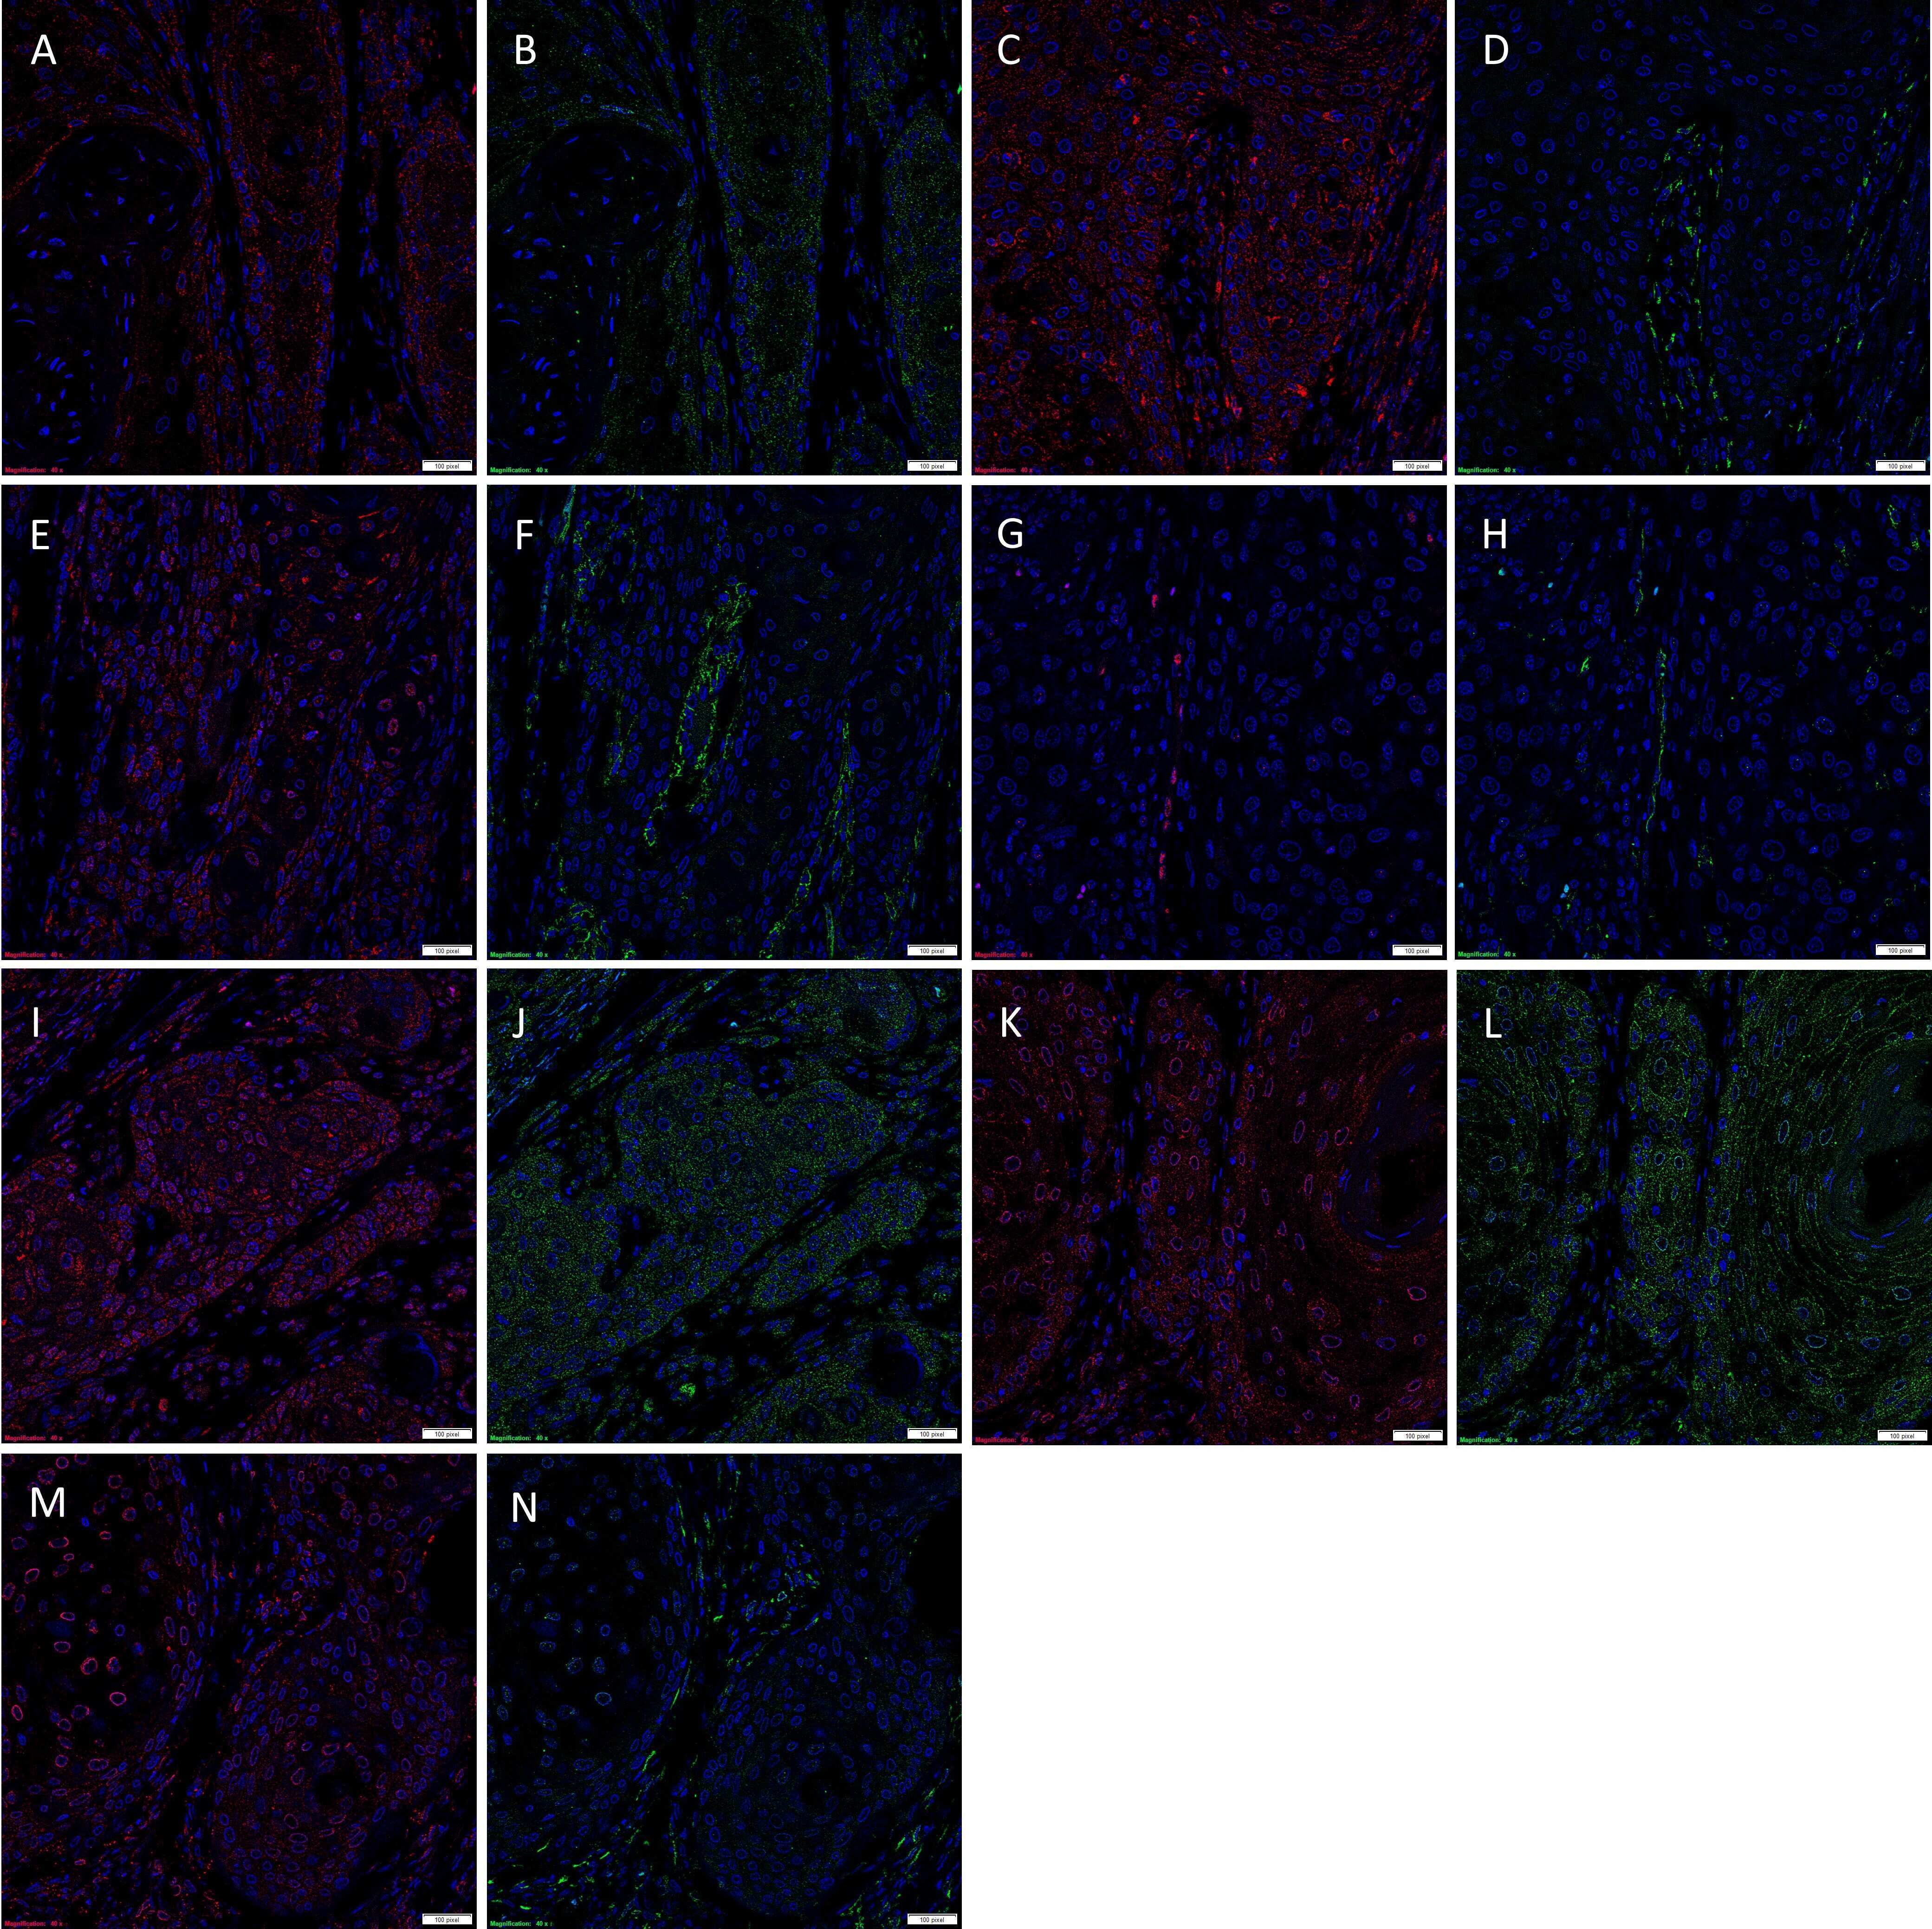
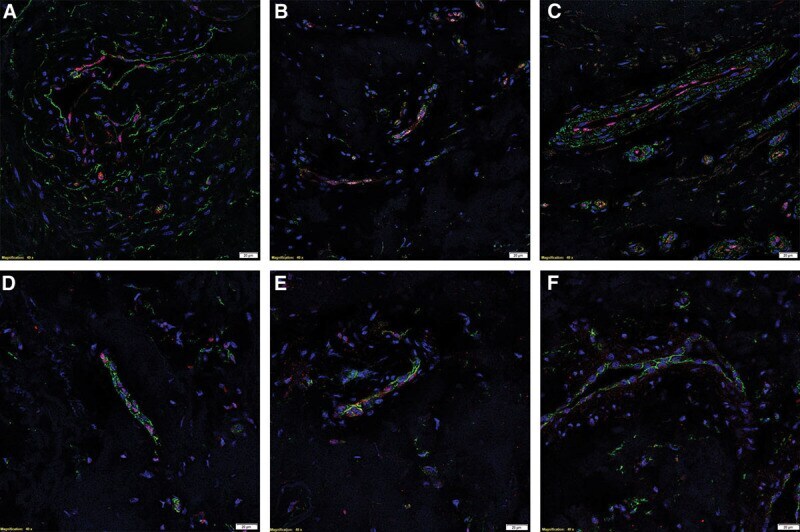
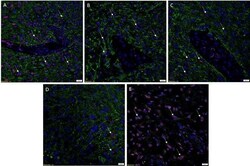
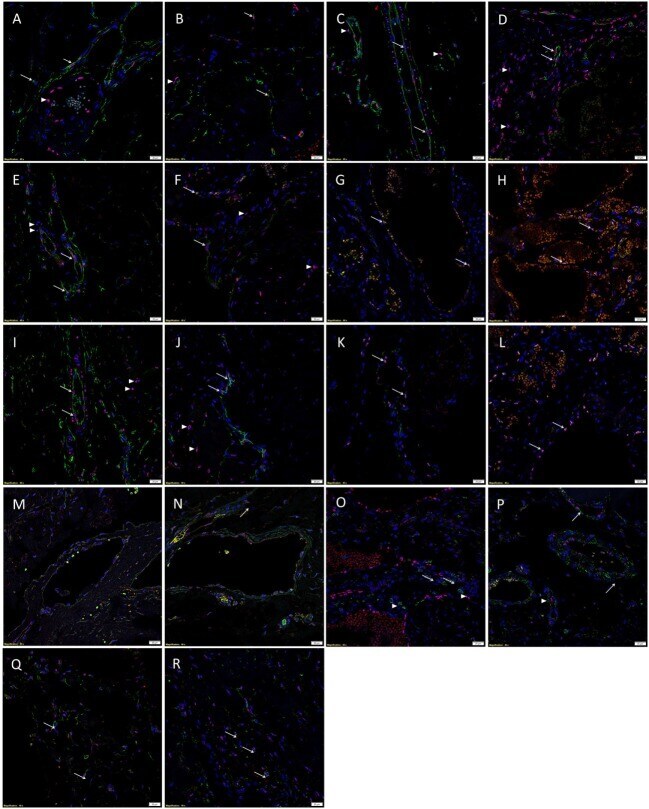
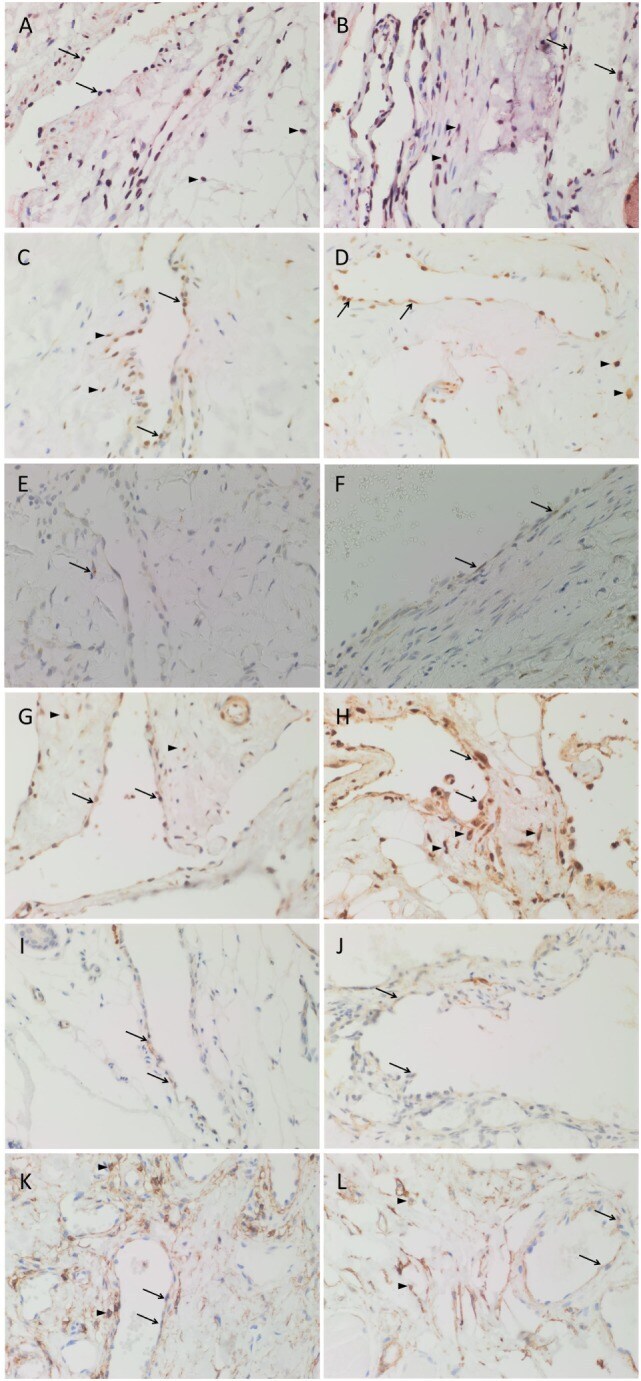
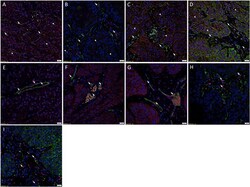
- Figure 3 Representative immunofluorescent immunohistochemical-stained sections of subcutaneous venous malformation (SCVM) (A) and intramuscular venous malformation (IMVM) (B) samples, demonstrating the endothelium consisted of CD34 + (green)/ERG - (red) ( long arrows ), ERG + (red)/CD34 - (green) endothelium ( arrowheads ), and CD34 + (red)/ERG + (red) ( short arrows ) phenotypes. The CD34 + (green) endothelium expressed Nanog (red, arrows ) in SCVM (C) and IMVM (D) lesions with cells away from the endothelium also expressing Nanog (red, arrowheads ) within SCVM (C) and IMVM (D) lesions. The CD34 + (green) endothelium expressed pSTAT3 (red, arrows ) in both SCVM (E) and IMVM (F) lesions. Cells away from the endothelium also expressed pSTAT3 (red, arrowheads ) within SCVM (E) and IMVM (F) lesions. The ERG + (red) endothelium also expressed OCT4 (green, arrows ) in both SCVM (G) and IMVM (H) lesions. The CD34 + (green) endothelium expressed SOX2 (red, arrows ) in SCVM (I) and IMVM (J) lesions. Cells away from the endothelium also expressed SOX2 (red, arrowheads ) in SCVM (I) and IMVM (J) lesions. The ERG + endothelium (red) expressed SALL4 (green, arrows ) in SCVM (K) and IMVM (L) lesions. Dual staining of with SOX2 and SALL4 demonstrated the SALL4 + [ (M,N) , green] endothelial population expressed SOX2 [ (M,N) , red] in both SCVM (M) and IMVM (N) . The ERG + endothelium (red) expressed CD44 (green, arrows ) in SCVM (O) and IMVM (P) lesions with cells away from the endothelium
- Submitted by
- Invitrogen Antibodies (provider)
- Main image
- Experimental details
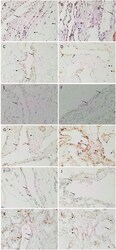
- Figure 2 3,3'-Diaminobenzidine immunohistochemical-stained images demonstrating the expression of Nanog [ (A,B) , red], pSTAT3 [ (C,D) , brown], OCT4 [ (E,F) , brown], SOX2 [ (G,H) , brown], SALL4 [ (I,J) , brown], and CD44 [ (K,L) , brown] in subcutaneous venous malformation (SCVM) (A,C,E,G,I,K) and intramuscular venous malformation (IMVM) (B,D,F,H,J,L) . Endothelial staining of all six embryonic stem cell markers was present on the endothelium within both SCVM and IMVM samples. Nanog (A,B) , pSTAT3 (C,D) , SOX2 (G,H) , and CD44 (K,L) were also expressed on cells ( arrowheads ) away from the endothelium in both SCVM and IMVM samples. Nuclei were counterstained with hematoxylin (blue). Original magnification: 400x.
- Submitted by
- Invitrogen Antibodies (provider)
- Main image

- Experimental details
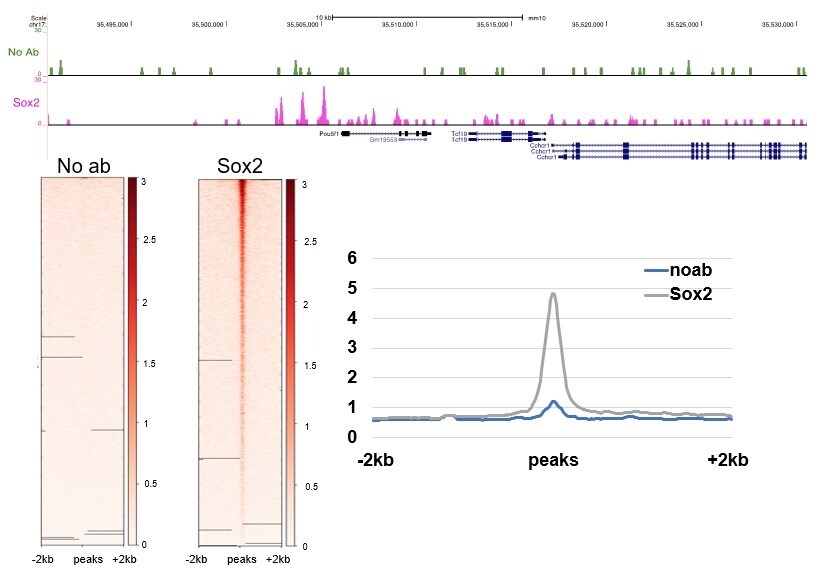
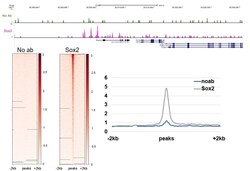
- CUT&RUN was performed using 200,000 E14 mouse embryonic stem cells with a polyclonal Sox2 antibody (Product # PA1-094) or no antibody control. Sequencing reads were aligned to previously described Sox2 peaks (+/- 2kbp; from GSE11724) of 19,316 peaks. Libraries were sequenced to ~10 million mapped reads. Gray lines indicate regions of no sequence coverage. Data courtesy of Sarah Hainer at University of Pittsburgh.
- Submitted by
- Invitrogen Antibodies (provider)
- Main image
- Experimental details
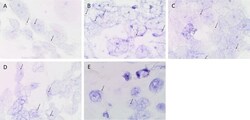
- Figure 3 Representative in situ hybridisation-stained formalin-fixed paraffin-embedded oral tongue squamous cell carcinoma sections demonstrating mRNA expression of OCT4 (A, red, arrows ), SOX2 (B, red, arrows ), STAT3 (C, red, arrows ), NANOG (D, red, arrows ) and SALL4 (E, red, arrows ). Original magnification: x1000.
- Submitted by
- Invitrogen Antibodies (provider)
- Main image
- Experimental details
- Figure 1 Immunohistochemical analysis of SOX2 expression in sarcoma patients and associations with clinical data. ( A ) Representative examples of the indicated types of sarcoma showing positive or negative SOX2 staining. Scale bars: 200 or 500 mum (insets). ( B ) Distribution of sarcoma cases (N = 88) according to their SOX2 expression level across categories of the indicated patient characteristics and tumor clinicopathologic parameters. p values are shown. ( C ) Kaplan-Meier cumulative survival curves categorized by SOX2 protein expression in the cohort of sarcoma patients. p -values were estimated using the log-rank test.

- Submitted by
- Invitrogen Antibodies (provider)
- Main image
- Experimental details
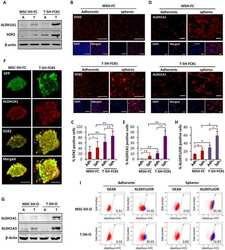
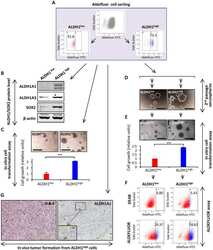
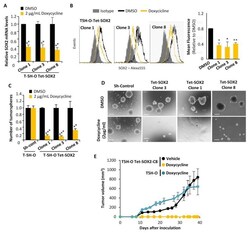
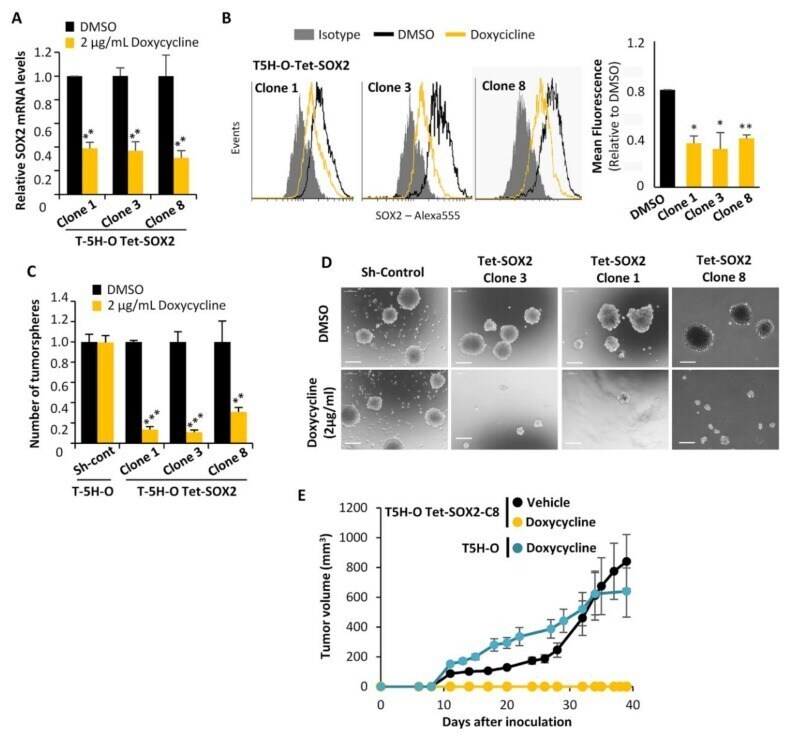
- Figure 2 The depletion of SOX2 strongly reduced the tumorigenic potential of sarcoma cells. ( A , B ) Relative mRNA expression ( A ) and flow cytometry analysis ( B ) of SOX2 in three clones of T-5H-O cells carrying a doxycycline-inducible SOX2 shRNA in the presence or absence of 2 mug/mL doxycycline for 48 h. ( C , D ) Average number of three independent experiments ( C ) and representative images ( D ) of tumorspheres formed by the parental T-5H-O cells transduced with control ShRNA or the T-5H-O clones carrying a doxycycline-inducible SOX2 shRNA in the presence or absence of 2 mug/mL doxycycline for 48 h. Scale bars = 200 mum. ( E ) T-5H-O and T-5H-O-Tet-SOX2-C8 cells were pretreated as indicated with vehicle (DMSO) or 2 mug/mL doxycycline for 72 h prior to the subcutaneous inoculation of 1 x 10 4 cells in immunodeficient mice ( n = 7 mice per series). Upon inoculation mice were treated daily with vehicle (saline) or doxycycline (50 mg/kg) via intraperitoneal. Tumor growth (mean volume) kinetics of each series are represented. Error bars represent the standard deviation and asterisks indicate statistically significant differences with control groups (*: p < 0.05, **: p < 0.005, ***: p < 0.0005; two-sided Student t test).
- Submitted by
- Invitrogen Antibodies (provider)
- Main image
- Experimental details
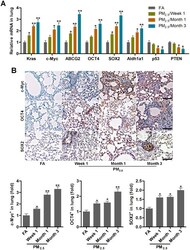
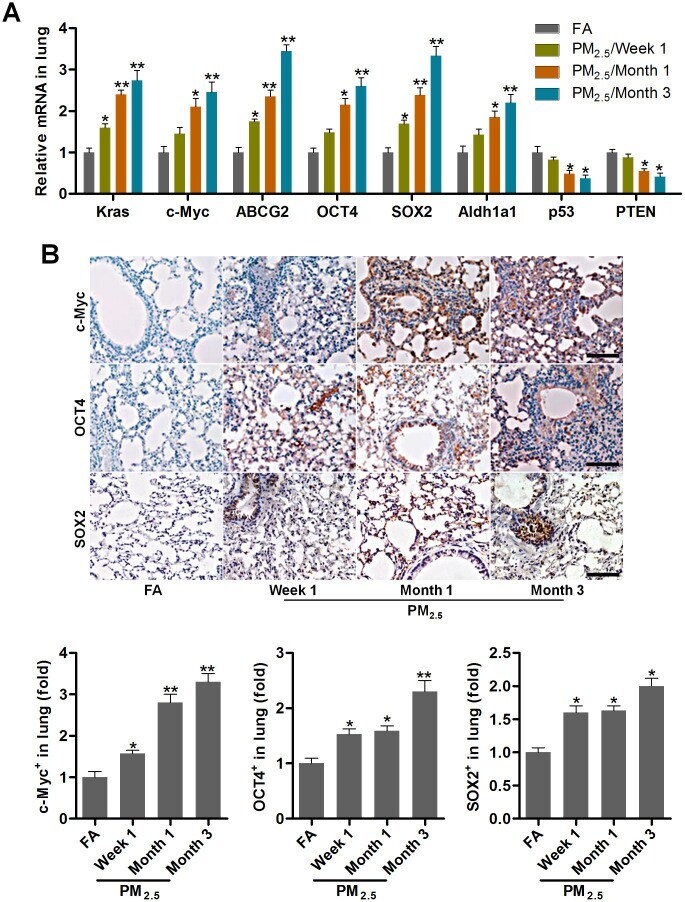
- Figure 2 PM 2.5 treatments lead to cancer stem cell properties in mice. ( A ) RT-qPCR analysis was used to measure lung cancer-related biomarkers (Kras, c-Myc, ABCG2, OCT4, SOX2, Aldh1a1, p53 and PTEN) in lung tissues of mice following PM 2.5 treatment at the indicated time (n = 4). ( B ) IHC staining was performed to calculate c-Myc, OCT4 and SOX2 in pulmonary sections of PM 2.5 -challenged mice (n = 6). The quantification of c-Myc, OCT4 and SOX2 relative expression was exhibited. Scale bar, 100 mum. All data are expressed as mean +- SEM. * p
- Submitted by
- Invitrogen Antibodies (provider)
- Main image
- Experimental details
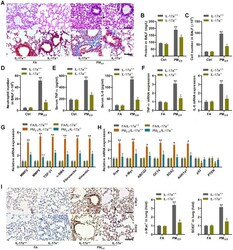
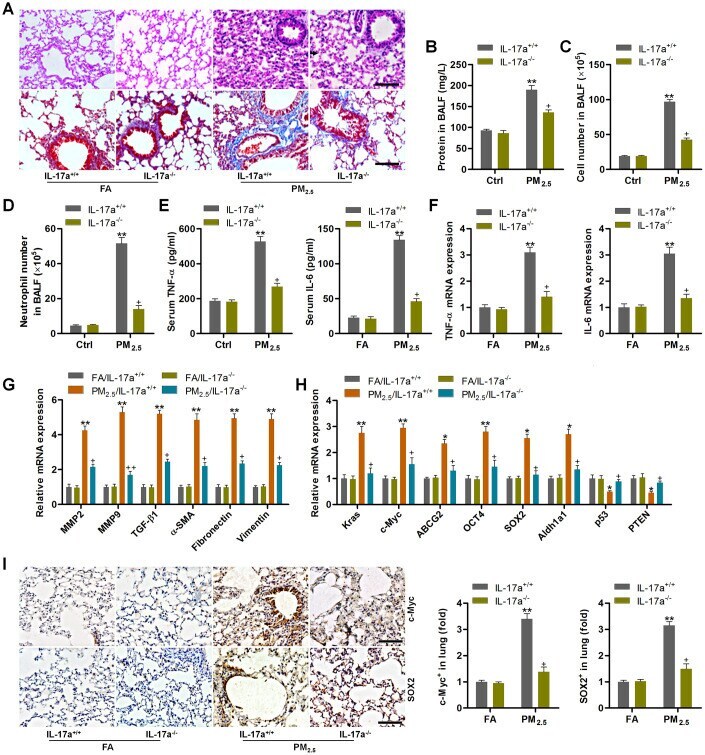
- Figure 8 IL-17a knockout alleviates pulmonary injury and cancer stem cell properties in mice following PM 2.5 exposure for 3 months. ( A ) H&E staining (up panel) and Masson trichrome staining (down panel) of lung sections from IL-17a +/+ and IL-17a -/- mice challenged with or without PM 2.5 for 3 months (n = 6). Scale bar, 100 mum. ( B ) Protein levels in BALF were measured (n = 8). ( C ) The total number of cells in BALF was assessed (n = 8). ( D ) The number of neutrophils in BALF was measured (n = 8). ( E ) Serum TNF-alpha and IL-6 levels in mice were measured by ELISA (n = 8). ( F ) TNF-alpha and IL-6 mRNA levels in the pulmonary samples were determined using RT-qPCR analysis (n = 4). ( G ) Fibrosis-associated genes as shown were tested using RT-qPCR analysis (n = 4). ( H ) Genes associated with lung cancer progression were calculated using RT-qPCR analysis (n = 4). ( I ) IHC staining of c-Myc and SOX2 in pulmonary sections from the indicated groups of mice (n = 6). Scale bar, 100 mum. All data are expressed as mean +- SEM. * p
- Submitted by
- Invitrogen Antibodies (provider)
- Main image

- Experimental details
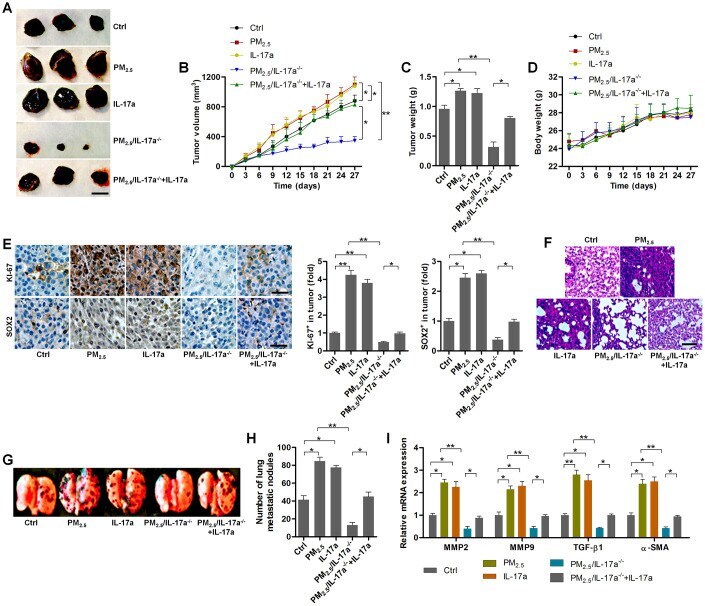
- Figure 9 PM 2.5 -promoted tumor growth and metastasis are associated with IL-17a in xenograft mouse models. ( A ) Representative images of tumor samples isolated from each group of mice as indicated (n = 6). Scale bar, 1 cm. ( B ) Tumor volume was measured (n = 6). ( C ) Tumor weight was recorded (n = 6). ( D ) The body weight of mice was recorded (n = 6). ( E ) IHC staining was used to determine KI-67 and SOX2 expression levels in the tumor sections (n = 4). Scale bar, 100 mum. ( F ) H&E staining of pulmonary tissues (n = 4; Scale bar, 100 mum) and ( G ) pictures of lung samples isolated from the indicated groups of mice to calculate the metastatic nodules on the surface of lungs (n = 6). ( H ) The number of lung metastatic nodules was quantified (n = 6). ( I ) RT-qPCR analysis was used to calculate the expression of metastasis-associated genes as displayed (n = 4). All data are expressed as mean +- SEM. * p
- Submitted by
- Invitrogen Antibodies (provider)
- Main image
- Experimental details
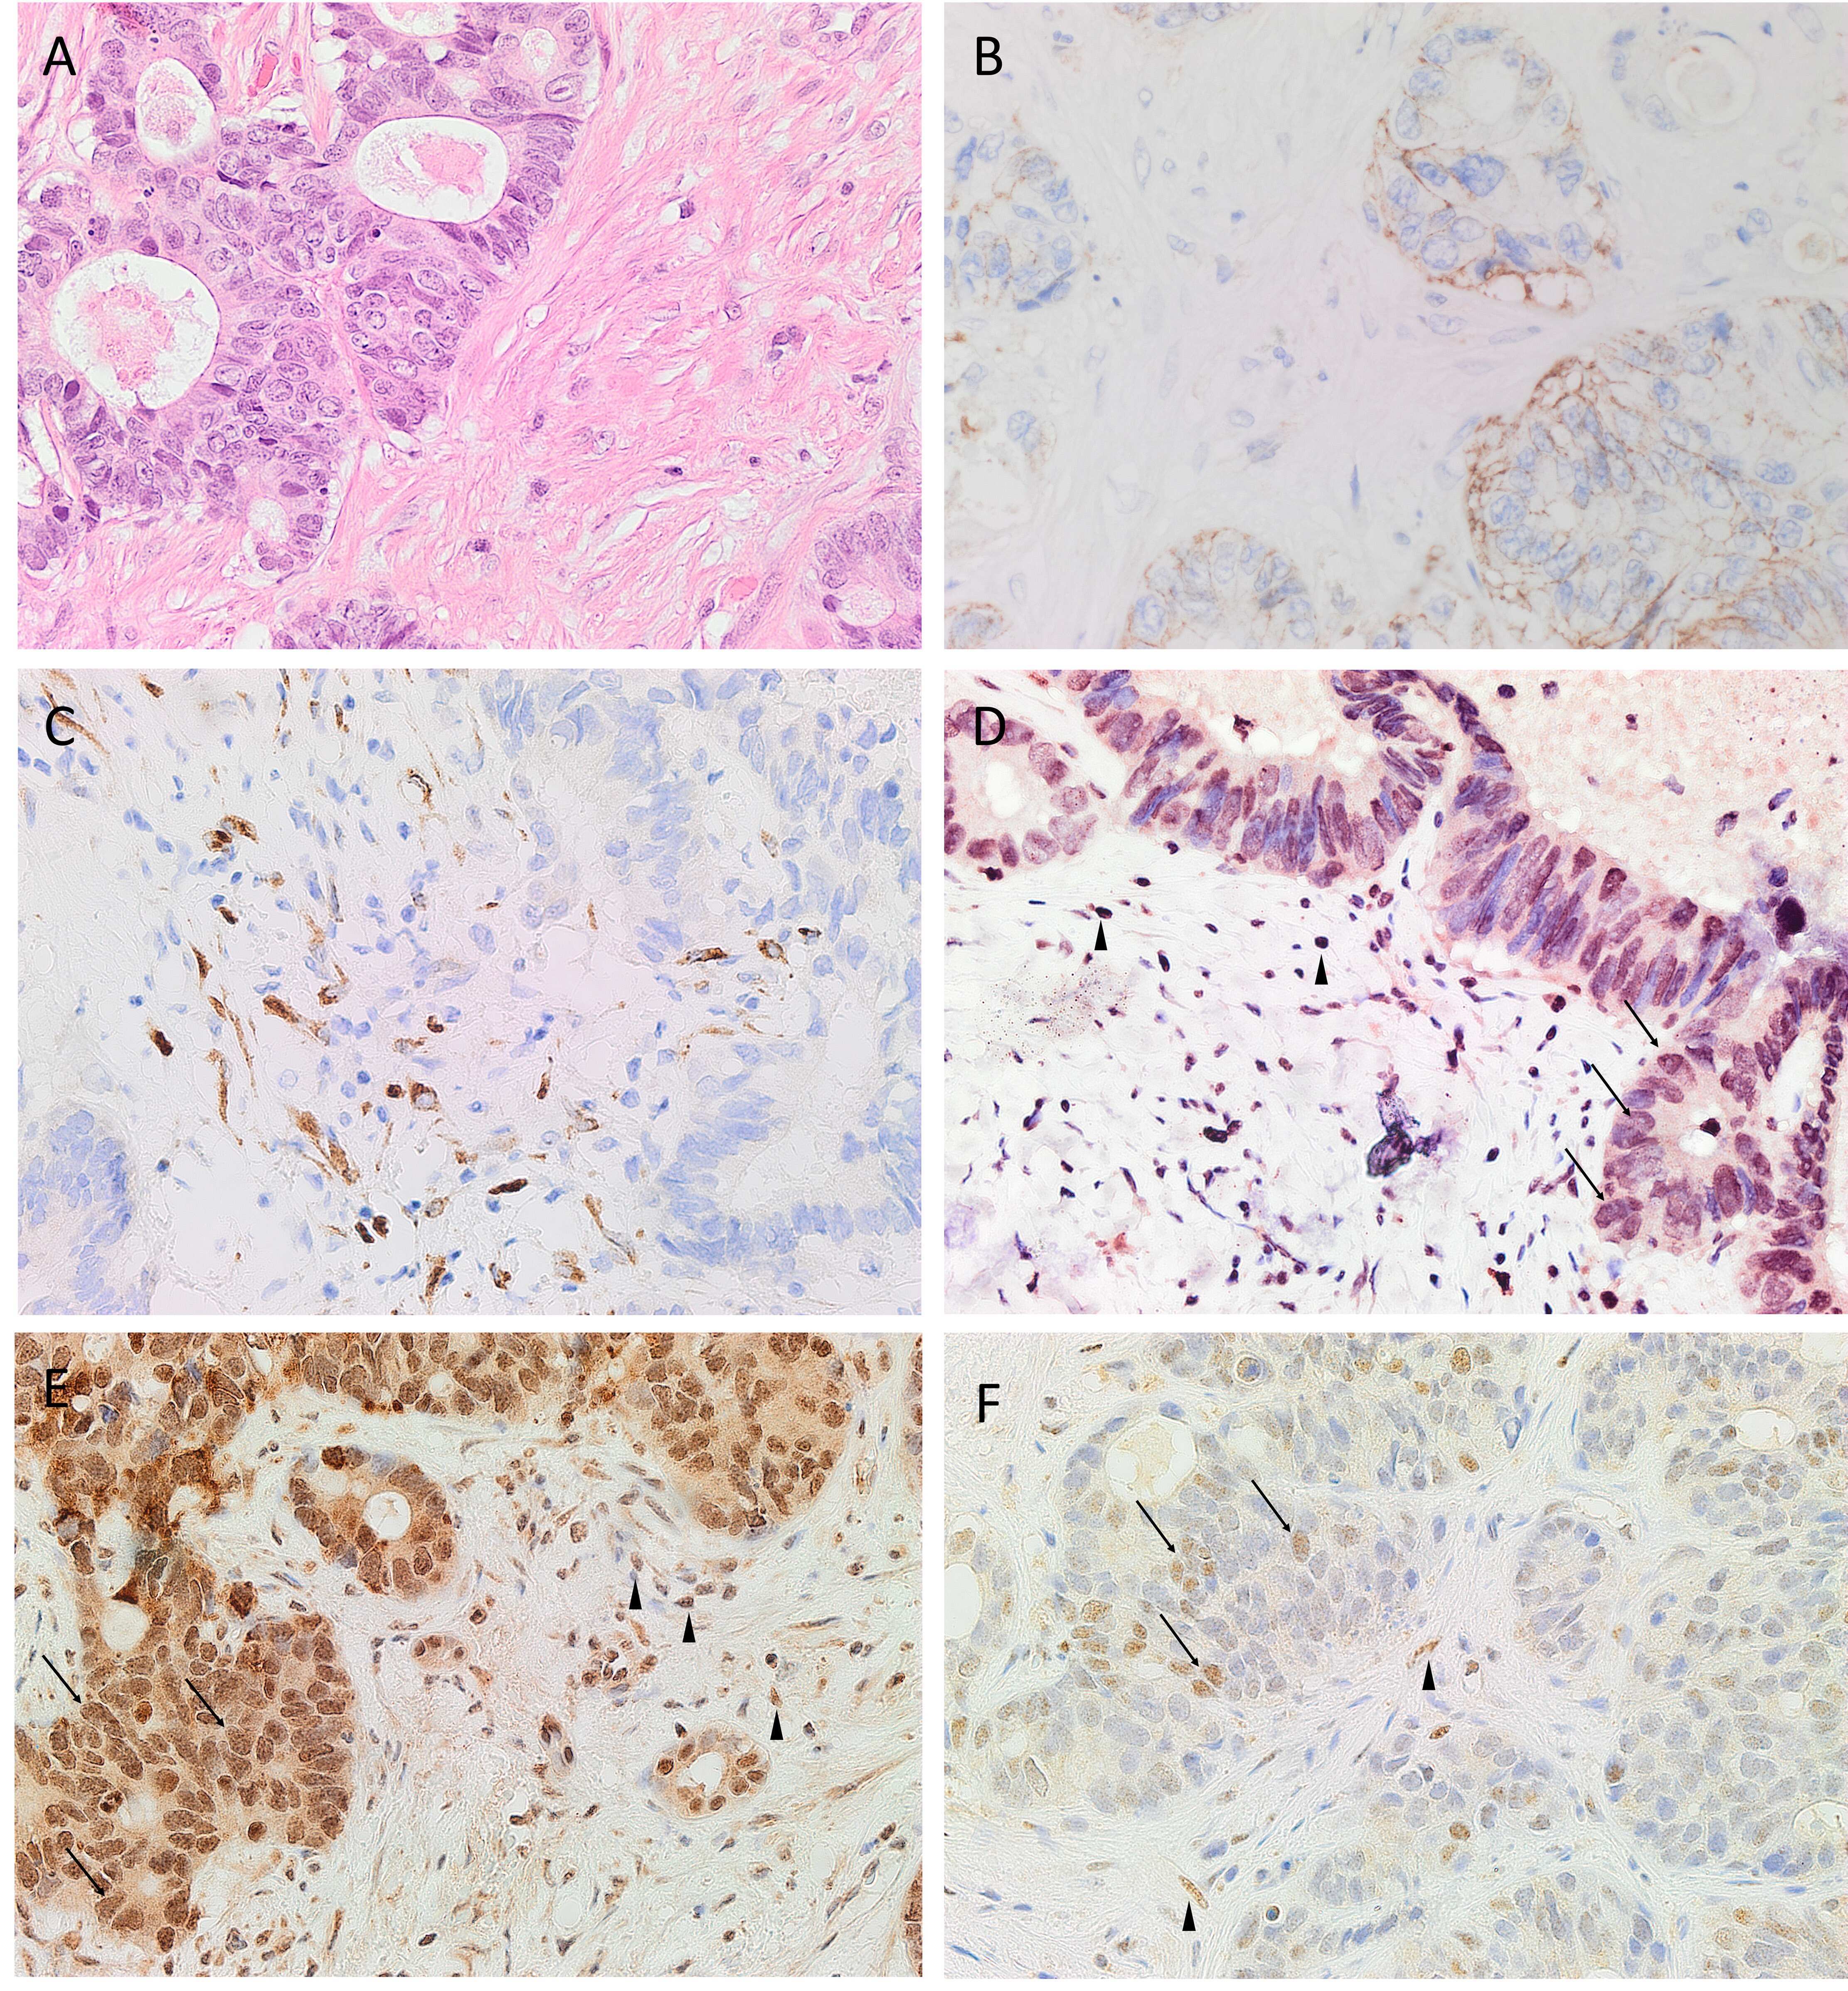
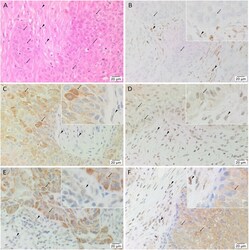
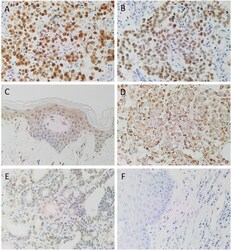
- Figure 1 Representative hematoxylin and eosin (A) and immunohistochemical (B-F) stained slides of metastatic head and neck cutaneous squamous cell carcinoma (mHNcSCC) tissue samples, demonstrating the tumor nests (TNs, arrows ) separated by peritumoral stroma (PTS, arrowheads ) (A) , and nuclear and cytoplasmic expression of OCT4 ( B , brown) by cells within the PTS ( arrowheads ), and cytoplasmic expression in occasional cells within the TNs ( arrows ). NANOG ( C , brown) was expressed on the cytoplasm of cells within the TNs ( arrows ). Cells within the PTS did not express for NANOG ( arrowheads ). SOX2 ( D , brown) was expressed on the nucleus and the cytoplasm of cells within the TNs ( arrows ) and the PTS ( arrowheads ). KLF4 ( E , brown) was present on the cytoplasm in cells throughout the TNs ( arrow ), and to a lesser extent, on cells within the PTS ( arrowheads ). c-MYC (F , brown) showed cytoplasmic and occasional nuclear expression on cells within the TNs ( arrows ) and cytoplasmic and nuclear expression in cells within the PTS ( arrowheads ). Nuclei were counter-stained with hematoxylin. Original magnification: 400x.

- Submitted by
- Invitrogen Antibodies (provider)
- Main image
- Experimental details
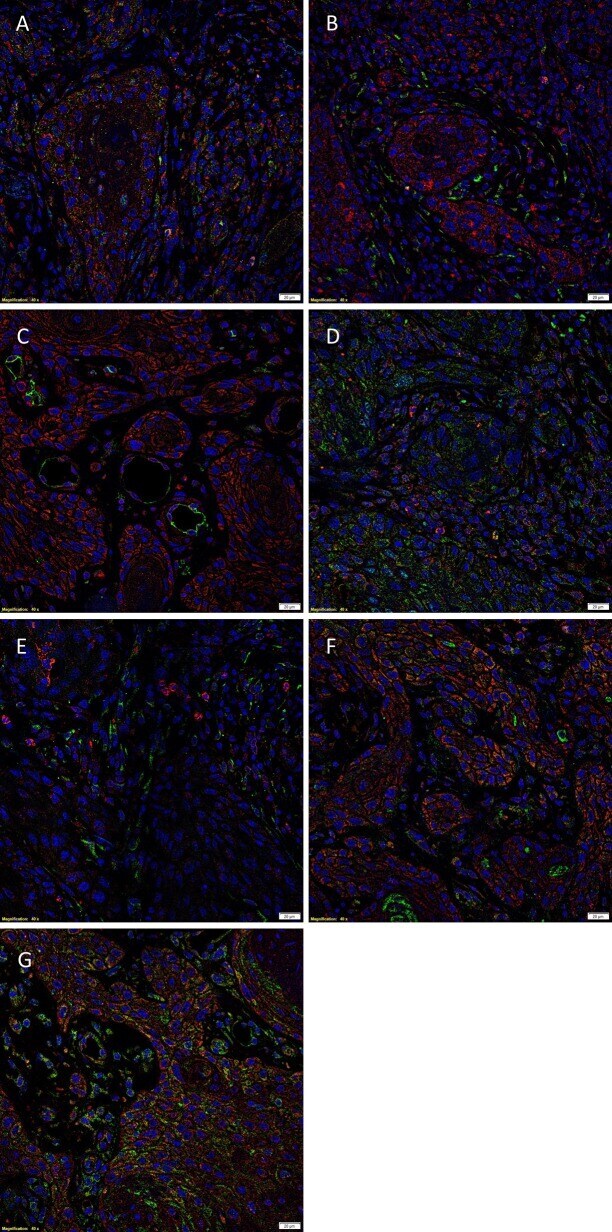
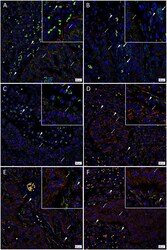
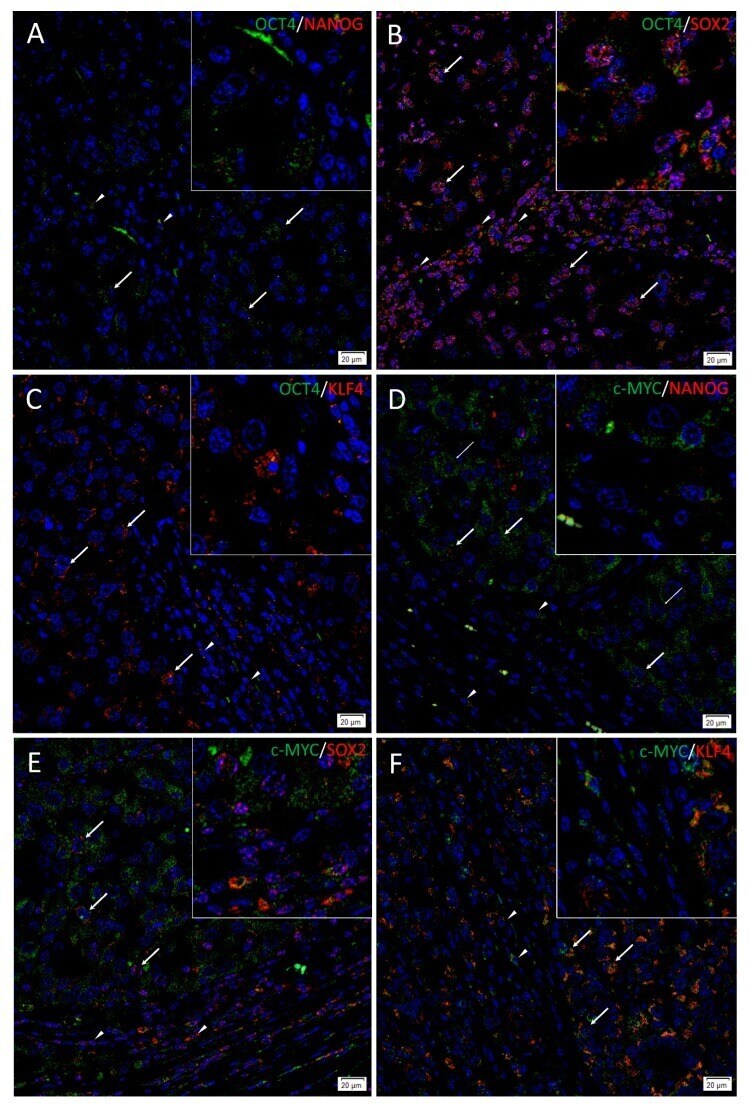
- Figure 3 Representative immunofluorescence-stained sections of a metastatic cutaneous head and neck squamous cell carcinoma tissue sample demonstrating expression of induced pluripotent stem cell markers, with abundant expression of c-MYC ( A-C , green) on the cells within the peritumoral stroma (PTS, arrowheads ) and the tumor nests (TNs, thin arrows ). These c-MYC + cells also demonstrated cytoplasmic expression of KLF4 ( A , red). Most of the c-MYC + cells within the TNs ( thin arrows ) and few of those within the PTS ( arrowheads ) also expressed NANOG ( B , red) with few c-MYC+ cells within the TNs not expressing NANOG ( B , red, thick arrows ). These c-MYC + cells within the TNs ( thin arrows ) and the PTS ( arrowheads ) exhibited nuclear and cytoplasmic expression of SOX2 ( C , red). The KLF4+ ( D , red) cells within the TNs ( thin arrows ) and the PTS ( arrowheads ) also expressed OCT4 ( D , green). The majority of OCT4+ ( E,F , green) cells within the TNs ( thin arrows ) and the PTS ( arrowheads ) also expressed NANOG ( E , red), and all expressed SOX2 ( F , red). All slides were counter-stained with 4',6'-diamidino-2-phenylindole ( A-F , blue). Original magnification 400x. The insets show enlarged views of the corresponding images.
- Submitted by
- Invitrogen Antibodies (provider)
- Main image
- Experimental details
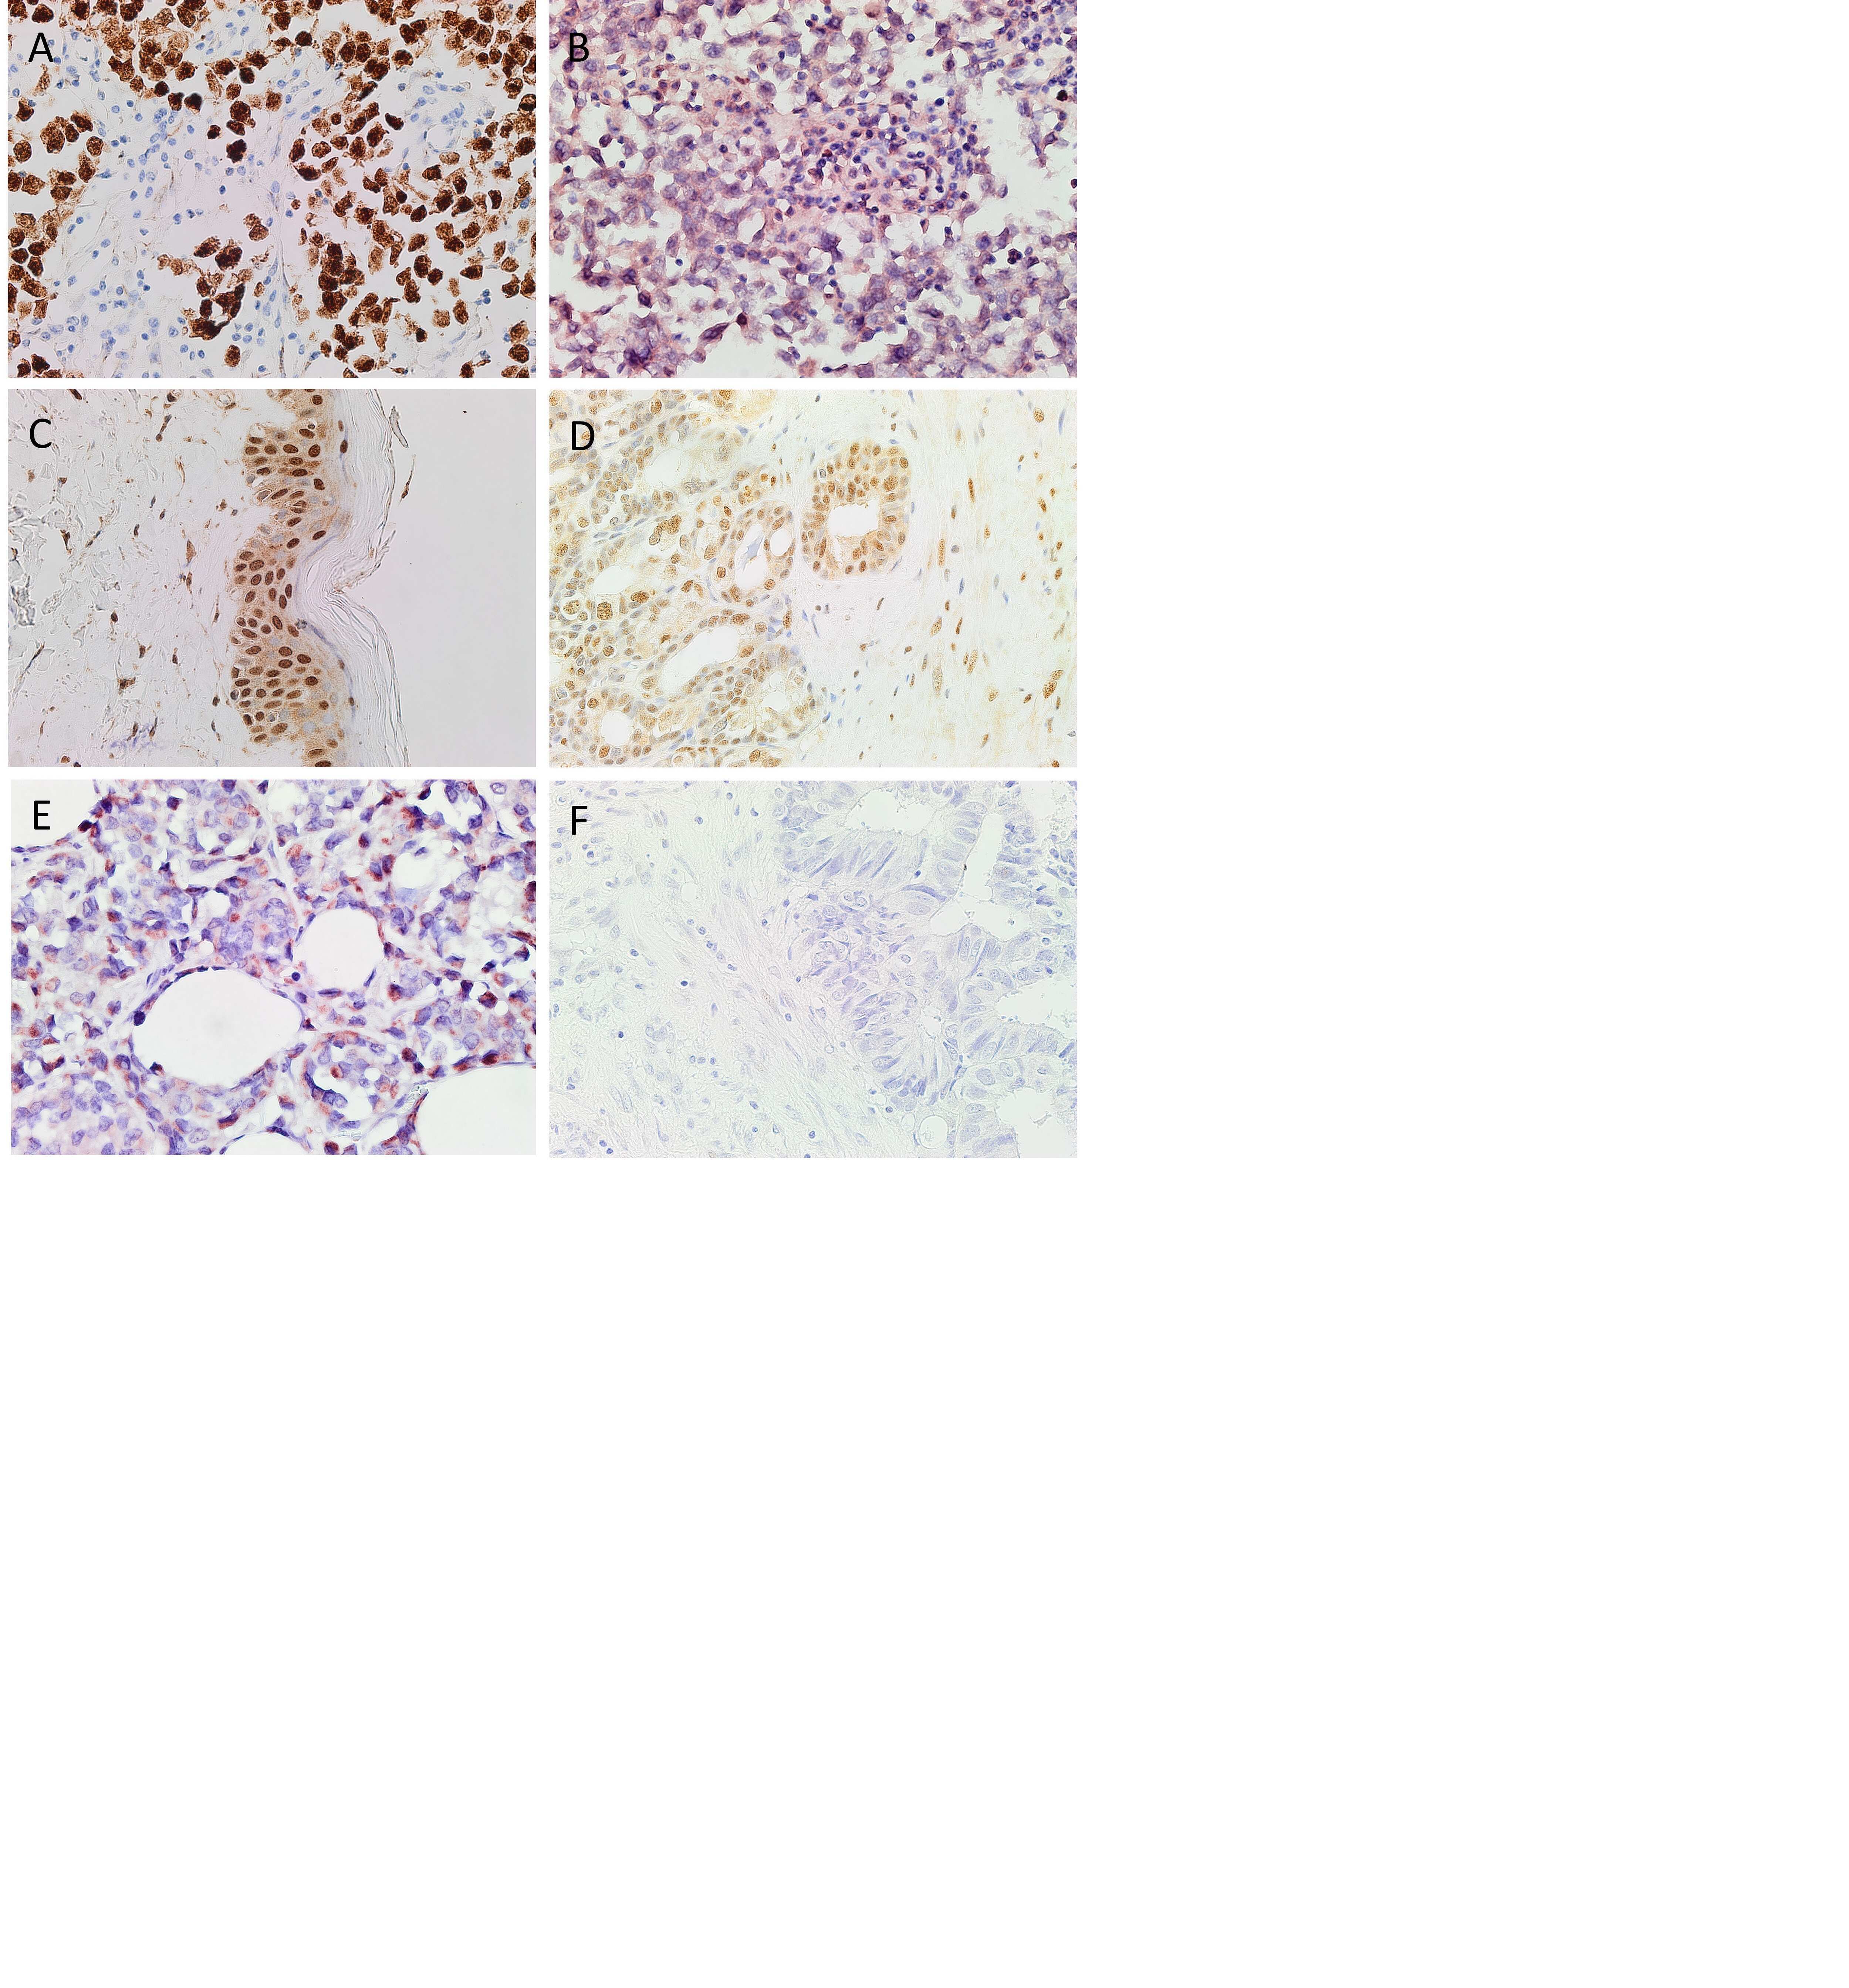
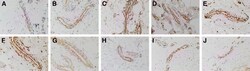
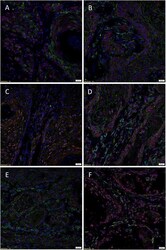
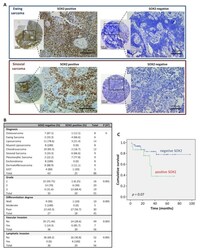
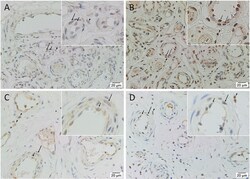
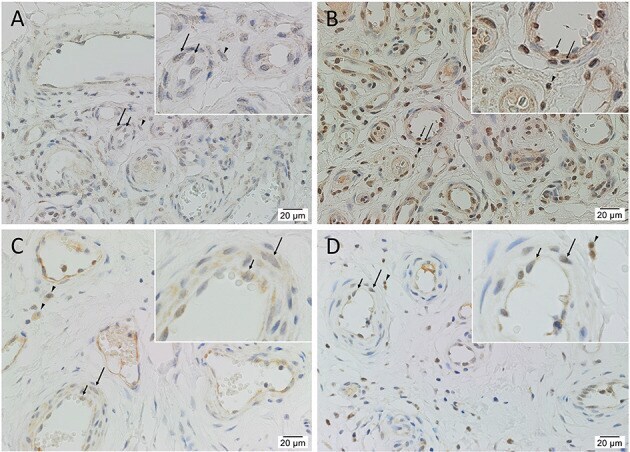
- Figure 2 Representative immunohistochemical-stained sections of arteriovenous malformation tissue samples demonstrating the expression of OCT4 ( A , brown) and SOX2 ( B , brown), KLF4 ( C , brown), and c-MYC ( D , brown) on the endothelium ( short arrows ) and the media ( long arrows ) of the lesional vessels and on cells within the stroma ( arrowheads ) of the nidus . Nuclei were counterstained with hematoxylin ( A-D , blue). Original magnification: x400.
- Submitted by
- Invitrogen Antibodies (provider)
- Main image
- Experimental details
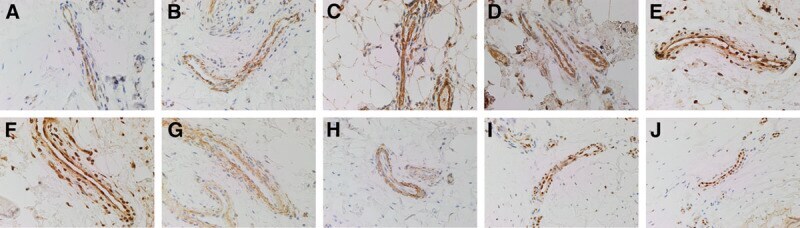
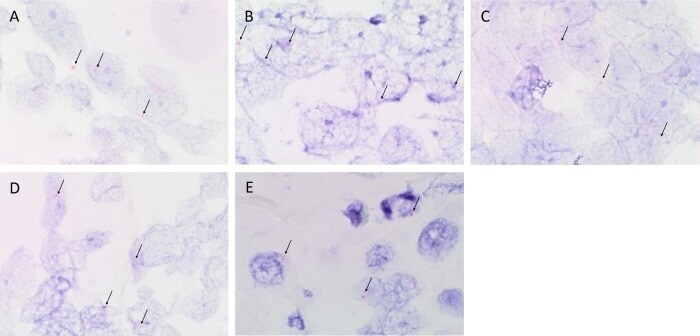
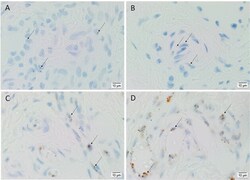
- Figure 4 Representative in situ hybridization sections of arteriovenous malformation tissue samples demonstrating the presence of transcripts for OCT4 ( A , brown), SOX2 ( B , brown), KLF4 ( C , brown), and c-MYC ( D , brown) on the endothelium ( long arrows ) of the lesional vessels. OCT4 ( A , brown), KLF4 ( C , brown), and c-MYC ( D , brown) were also present on the media of the lesional vessels and on cells within the stroma ( short arrows ) of the nidus . Nuclei were counterstained with hematoxylin ( A-D , blue). Original magnification: x1,000.
- Submitted by
- Invitrogen Antibodies (provider)
- Main image

- Experimental details
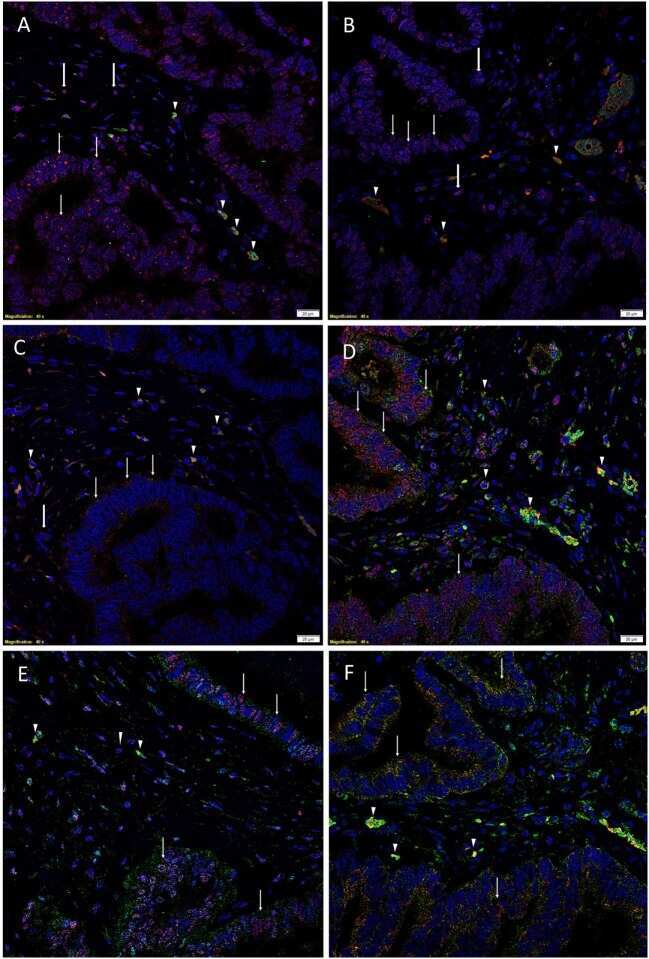
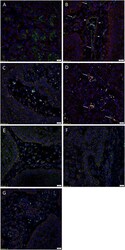
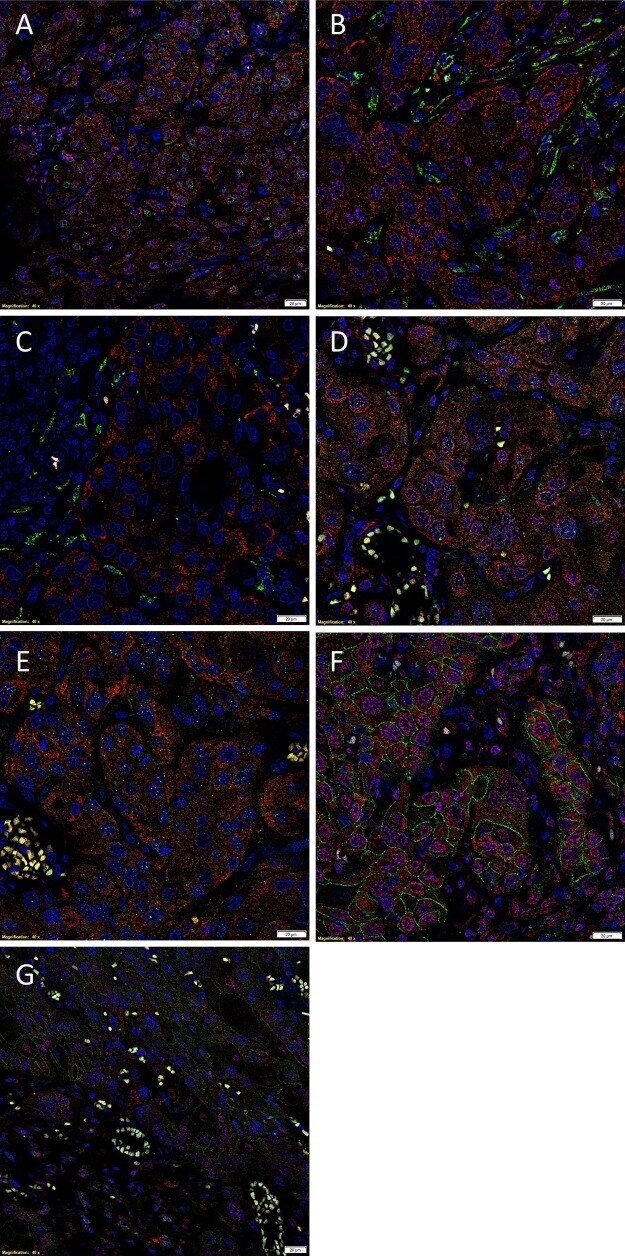
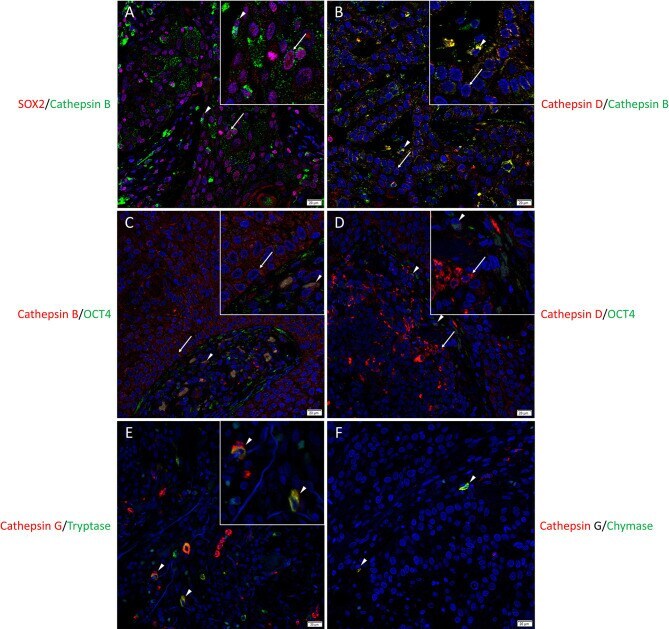
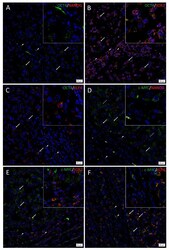
- Figure 2 Representative immunofluorescence-stained sections of a metastatic cutaneous head and neck squamous cell carcinoma tissue sample demonstrating the co-expression of cathepsins B and D with embryonic stem cell markers. Cathepsin B ( A , green) was expressed by the SOX2+ ( A , red) CSCs within the tumor nests (TNs) and to a lesser extent those within the peritumoral stroma (PTS). Cells that expressed cathepsin B ( B , green) also expressed cathepsin D ( B , red ) . Cathepsin B ( C , red) and cathepsin D ( D , red) were expressed by OCT4+ ( D, E , green) CSCs within the PTS. Cathepsin G ( E, F , red) were expressed by cells within the PTS, majority of which expressed tryptase ( E , green) and few expressed chymase ( F , green). All slides were counter-stained with 4',6-diamidino-2-phenylindole ( A-F , blue). Original magnification 400x. Scale bars: 20um. n = 2. The inserts show enlarged views of the corresponding images.
- Submitted by
- Invitrogen Antibodies (provider)
- Main image

- Experimental details
- Figure 1 Representative immunohistochemical-stained images of lung adenocarcinoma (LA) tissue samples demonstrating the expression of CD44, OCT4, NANOG, SOX2, KLF4 and c-MYC. LA was organized into tumor glands surrounded by the adjacent stroma. Membranous staining of CD44 (( A ), brown) was consistently observed on the cells within the tumor glands, and some cells within the stroma. OCT4 (( B ), brown) was consistently expressed in the cytoplasm of cells within the stroma, and occasionally, in the nucleus of cells within the stroma and the cytoplasm of cells within the tumor glands. NANOG (( C ), brown) was consistently seen in the cytoplasm of cells within the tumor glands. SOX2 (( D ), brown) was observed in the nucleus and the cytoplasm of cells within the tumor glands, as well as the nucleus of cells within the stroma. KLF4 (( E ), brown) was consistently seen in the cytoplasm of cells within the tumor glands, and also in the cytoplasm of cells within the stroma. c-MYC (( F ), brown) was observed in the nucleus and the cytoplasm of cells within the tumor glands, and the cells within the stroma. Nuclei were counterstained with hematoxylin (( A - F ), blue). Original magnification: 400x; n = 12.
- Submitted by
- Invitrogen Antibodies (provider)
- Main image

- Experimental details
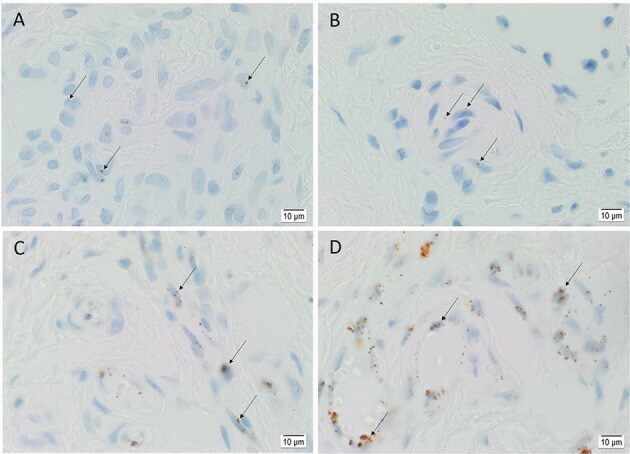
- Fig. 2 Representative 3,3-diaminobezidine immunohistochemical-stained slides of moderately differentiated head and neck cutaneous squamous cell carcinoma tissue samples demonstrating the expression of OCT4 (A, brown), NANOG (B, brown), SOX2 (C, brown), KLF4 (D, brown) and c-MYC (E, brown) by cells within the tumor nests ( arrowheads ), the peritumoral stroma (PTS, thick arrows ), and the endothelium of microvessels ( thin arrows ) within the PTS. Nuclei were counter-stained with hematoxylin (A-F, blue). Original magnification: 400x. Fig. 2
- Submitted by
- Invitrogen Antibodies (provider)
- Main image
- Experimental details
- Fig. 3 Positive 3,3-diaminobezidine immunohistochemical-stained of human control tissues: seminoma confirming the expression of OCT4 (A, brown) and NANOG (B, brown), normal skin for SOX2 (C, brown), breast carcinoma for KLF4 (D, brown) and prostate tissue for c-MYC (E, brown). A section moderately differentiated head and neck cutaneous squamous cell carcinoma probed with a matched isotype control for mouse and primary antibodies (F, brown), confirmed specificity of the secondary antibodies. Nuclei were counter-stained with hematoxylin (A-F, blue). Original magnification: 400x. Fig. 3

- Submitted by
- Invitrogen Antibodies (provider)
- Main image
- Experimental details
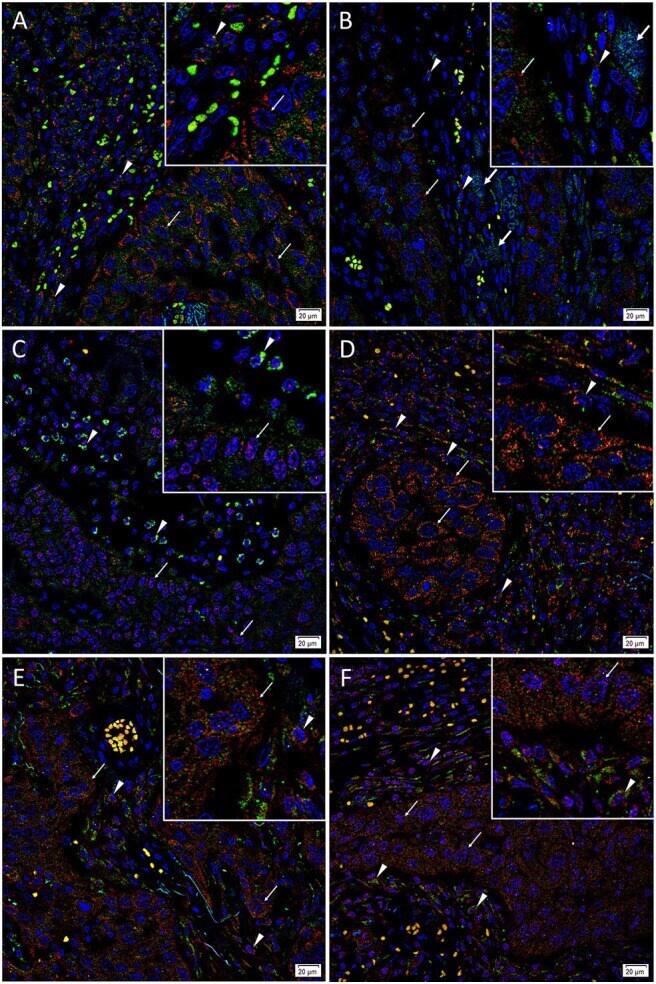
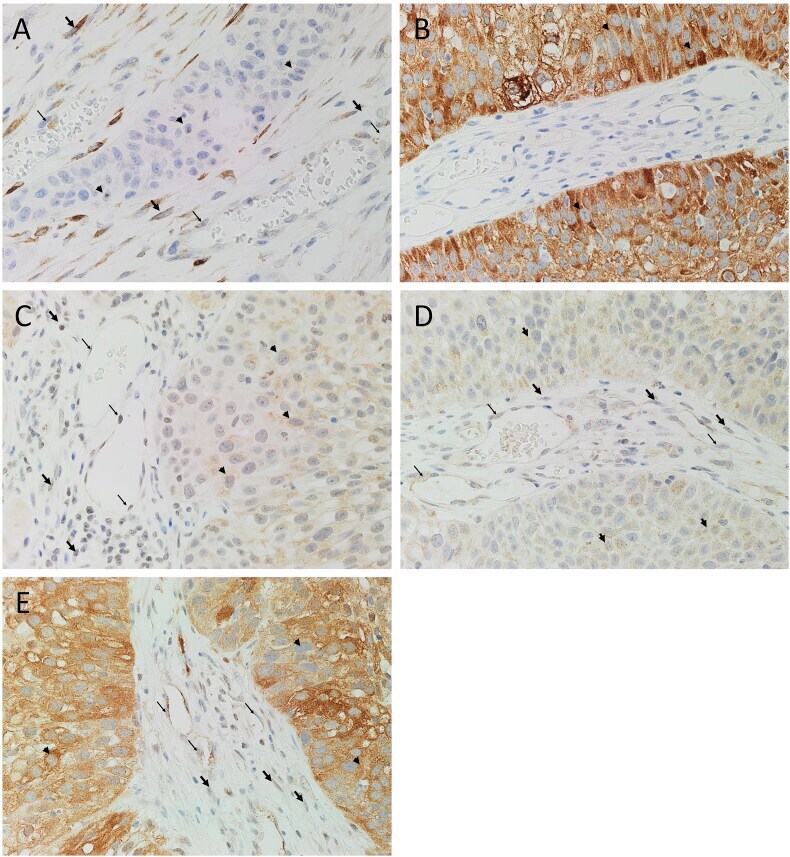
- Fig. 4 Representative immunofluorescence immunohistochemical-stained sections of moderately differentiated head and neck cutaneous squamous cell carcinoma tissue samples demonstrating expression of OCT4 (A-C, green) on cells within the peri-tumoral stroma (PTS, arrows ) and weak cytoplasmic expression on cells within the TNs ( arrowheads ). The OCT4 + subpopulations in the tumor nests (TNs, arrowheads ) and the PTS ( arrows ) also exhibited nuclear and cytoplasmic expression of SOX2 (A, red). The OCT4 + cells within the TNs ( arrowhead ) further demonstrated homogenous expression of NANOG (B, red). There was an OCT4 +/ NANOG + subpopulation ( thick arrows ) and an OCT4 + /NANOG - subpopulation ( thin arrows ) within the PTS. The OCT4 + subpopulations within the TNs ( arrowheads ) and PTS ( arrows ) demonstrated nuclear and cytoplasmic expression of KLF4 (C, red). The SOX2 + (D, red) cells within both the TNs ( arrowheads ) and the PTS ( arrows ) also expressed c-MYC (D, green). Dual staining of the iPSC markers with endothelial markers CD34 (E-G, green) or ERG (H-I, red) demonstrated expression of SOX2 (E, red), NANOG (F, red), KLF4 (G, red), OCT4 (H, green) and c-MYC (I, green) on the endothelium of microvessels ( arrows ) within the PTS. All slides were counter-stained with 4',6'-diamino-2-phenylindole. Scale bars: 20mum. Fig. 4
- Submitted by
- Invitrogen Antibodies (provider)
- Main image
- Experimental details
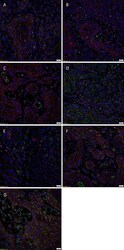
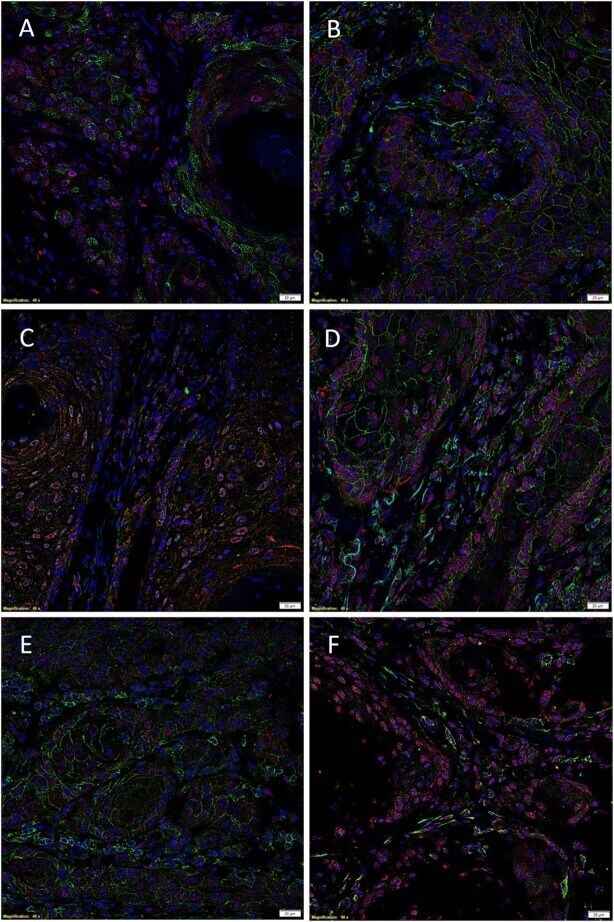
- Figure 3 Immunofluorescence stains of head and neck metastatic malignant melanoma tissue samples demonstrating expression of induced pluripotent stem cell markers. Representative sections showing expression of OCT4 ( A - C , green), SOX2 ( B , red), and KLF4 ( C , red) were expressed on the cells within both the tumor nests (TNs, thick arrows) and the peritumoral stroma (PTS, arrowheads). The c-MYC+ [( D - F ), green] cells within the TNs and the PTS also expressed SOX2 ( E , red) and KLF ( F , red). NANOG ( A , red) was expressed on the OCT4+ ( A , green) cells within both the TNs (thick arrows) and the PTS (arrowheads), and some cells (thick arrows) and not the others (thin arrows) within the TNs. All slides were counterstained with 4',6'-diamidino-2-phenylindole (blue). Original magnification 400x; n = 2. The insets show enlarged views of the corresponding images.
- Submitted by
- Invitrogen Antibodies (provider)
- Main image
- Experimental details
- CUT&RUN was performed using 200,000 E14 mouse embryonic stem cells with a polyclonal Sox2 antibody (Product # PA1-094) or no antibody control. Sequencing reads were aligned to previously described Sox2 peaks (+/- 2kbp; from GSE11724) of 19,316 peaks. Libraries were sequenced to ~10 million mapped reads. Gray lines indicate regions of no sequence coverage. Data courtesy of Sarah Hainer at University of Pittsburgh.
