Explore
 Validate
 Learn
Learn Immunocytochemistry
Antibody data
- Antibody Data
- Antigen structure
- References [20]
- Comments [0]
- Validations
- Immunocytochemistry [2]
- Other assay [34]
Submit
Validation data
Reference
Comment
Report error
- Product number
- 41-9811-80 - Provider product page

- Provider
- Invitrogen Antibodies
- Product name
- SOX2 Monoclonal Antibody (Btjce), eFluor™ 570, eBioscience™
- Antibody type
- Monoclonal
- Antigen
- Other
- Description
- Description: The Btjce monoclonal antibody reacts with the transcription factor Sox2, a member of the SOX (sex determining region Y -related HMG (High Mobility Group) Box) family of proteins. Sox family members play a role in early organ development, and in particular, Sox2 is essential for regulating genes that control normal mammalian embryogenesis. Sox2 and family member Sox3 are expressed as early as the preimplantation and epiblast stages respectively. Later expression is restricted to the neuroepithelium. Sox2 has been shown to be necessary for maintaining self-renewal and pluripotency of mouse and human embryonic stem (ES) cells (ESC). Oct4 (POU5F1), Klf4, c-myc, and Sox2 were the original four factors used to reprogram differentiated mouse and human cells to induced pluripotent stem cells (iPSC).
- Antibody clone number
- Btjce
- Concentration
- 0.2 mg/mL
Submitted references Hedgehog Signaling Pathway Orchestrates Human Lung Branching Morphogenesis.
Fibrinogen in the glioblastoma microenvironment contributes to the invasiveness of brain tumor-initiating cells.
Induction of inverted morphology in brain organoids by vertical-mixing bioreactors.
Wnt/β-catenin signalling is dispensable for adult neural stem cell homeostasis and activation.
Modulating mesendoderm competence during human germ layer differentiation.
PD-1 independent of PD-L1 ligation promotes glioblastoma growth through the NFκB pathway.
Quantitative analysis of signaling responses during mouse primordial germ cell specification.
Elp2 mutations perturb the epitranscriptome and lead to a complex neurodevelopmental phenotype.
Cancer Stem Cells in Metastatic Head and Neck Cutaneous Squamous Cell Carcinoma Express Components of the Renin-Angiotensin System.
Identification of Sox2 and NeuN Double-Positive Cells in the Mouse Hypothalamic Arcuate Nucleus and Their Reduction in Number With Aging.
Embryonic disc formation following post-hatching bovine embryo development in vitro.
Zika Virus with Increased CpG Dinucleotide Frequencies Shows Oncolytic Activity in Glioblastoma Stem Cells.
Spatial-Temporal Lineage Restrictions of Embryonic p63(+) Progenitors Establish Distinct Stem Cell Pools in Adult Airways.
Micropattern differentiation of mouse pluripotent stem cells recapitulates embryo regionalized cell fate patterning.
BCL11A interacts with SOX2 to control the expression of epigenetic regulators in lung squamous carcinoma.
Selection and dynamics of embryonic stem cell integration into early mouse embryos.
SOX9 accelerates ESC differentiation to three germ layer lineages by repressing SOX2 expression through P21 (WAF1/CIP1).
Disease-specific induced pluripotent stem cells.
Induction of pluripotent stem cells from adult human fibroblasts by defined factors.
Induction of pluripotent stem cells from mouse embryonic and adult fibroblast cultures by defined factors.
Belgacemi R, Danopoulos S, Deutsch G, Glass I, Dormoy V, Bellusci S, Al Alam D
International journal of molecular sciences 2022 May 9;23(9)
International journal of molecular sciences 2022 May 9;23(9)
Fibrinogen in the glioblastoma microenvironment contributes to the invasiveness of brain tumor-initiating cells.
Dzikowski L, Mirzaei R, Sarkar S, Kumar M, Bose P, Bellail A, Hao C, Yong VW
Brain pathology (Zurich, Switzerland) 2021 Sep;31(5):e12947
Brain pathology (Zurich, Switzerland) 2021 Sep;31(5):e12947
Induction of inverted morphology in brain organoids by vertical-mixing bioreactors.
Suong DNA, Imamura K, Inoue I, Kabai R, Sakamoto S, Okumura T, Kato Y, Kondo T, Yada Y, Klein WL, Watanabe A, Inoue H
Communications biology 2021 Oct 22;4(1):1213
Communications biology 2021 Oct 22;4(1):1213
Wnt/β-catenin signalling is dispensable for adult neural stem cell homeostasis and activation.
Austin SHL, Gabarró-Solanas R, Rigo P, Paun O, Harris L, Guillemot F, Urbán N
Development (Cambridge, England) 2021 Oct 15;148(20)
Development (Cambridge, England) 2021 Oct 15;148(20)
Modulating mesendoderm competence during human germ layer differentiation.
Valcourt JR, Huang RE, Kundu S, Venkatasubramanian D, Kingston RE, Ramanathan S
Cell reports 2021 Nov 9;37(6):109990
Cell reports 2021 Nov 9;37(6):109990
PD-1 independent of PD-L1 ligation promotes glioblastoma growth through the NFκB pathway.
Mirzaei R, Gordon A, Zemp FJ, Kumar M, Sarkar S, Luchman HA, Bellail AC, Hao C, Mahoney DJ, Dunn JF, Bose P, Yong VW
Science advances 2021 Nov 5;7(45):eabh2148
Science advances 2021 Nov 5;7(45):eabh2148
Quantitative analysis of signaling responses during mouse primordial germ cell specification.
Morgani SM, Hadjantonakis AK
Biology open 2021 May 15;10(5)
Biology open 2021 May 15;10(5)
Elp2 mutations perturb the epitranscriptome and lead to a complex neurodevelopmental phenotype.
Kojic M, Gawda T, Gaik M, Begg A, Salerno-Kochan A, Kurniawan ND, Jones A, Drożdżyk K, Kościelniak A, Chramiec-Głąbik A, Hediyeh-Zadeh S, Kasherman M, Shim WJ, Sinniah E, Genovesi LA, Abrahamsen RK, Fenger CD, Madsen CG, Cohen JS, Fatemi A, Stark Z, Lunke S, Lee J, Hansen JK, Boxill MF, Keren B, Marey I, Saenz MS, Brown K, Alexander SA, Mureev S, Batzilla A, Davis MJ, Piper M, Bodén M, Burne THJ, Palpant NJ, Møller RS, Glatt S, Wainwright BJ
Nature communications 2021 May 11;12(1):2678
Nature communications 2021 May 11;12(1):2678
Cancer Stem Cells in Metastatic Head and Neck Cutaneous Squamous Cell Carcinoma Express Components of the Renin-Angiotensin System.
Siljee S, Buchanan O, Brasch HD, Bockett N, Patel J, Paterson E, Purdie GL, Davis PF, Itinteang T, Tan ST
Cells 2021 Jan 27;10(2)
Cells 2021 Jan 27;10(2)
Identification of Sox2 and NeuN Double-Positive Cells in the Mouse Hypothalamic Arcuate Nucleus and Their Reduction in Number With Aging.
Sugiura A, Shimizu T, Kameyama T, Maruo T, Kedashiro S, Miyata M, Mizutani K, Takai Y
Frontiers in aging neuroscience 2020;12:609911
Frontiers in aging neuroscience 2020;12:609911
Embryonic disc formation following post-hatching bovine embryo development in vitro.
Ramos-Ibeas P, Lamas-Toranzo I, Martínez-Moro Á, de Frutos C, Quiroga AC, Zurita E, Bermejo-Álvarez P
Reproduction (Cambridge, England) 2020 Oct;160(4):579-589
Reproduction (Cambridge, England) 2020 Oct;160(4):579-589
Zika Virus with Increased CpG Dinucleotide Frequencies Shows Oncolytic Activity in Glioblastoma Stem Cells.
Trus I, Berube N, Jiang P, Rak J, Gerdts V, Karniychuk U
Viruses 2020 May 25;12(5)
Viruses 2020 May 25;12(5)
Spatial-Temporal Lineage Restrictions of Embryonic p63(+) Progenitors Establish Distinct Stem Cell Pools in Adult Airways.
Yang Y, Riccio P, Schotsaert M, Mori M, Lu J, Lee DK, García-Sastre A, Xu J, Cardoso WV
Developmental cell 2018 Mar 26;44(6):752-761.e4
Developmental cell 2018 Mar 26;44(6):752-761.e4
Micropattern differentiation of mouse pluripotent stem cells recapitulates embryo regionalized cell fate patterning.
Morgani SM, Metzger JJ, Nichols J, Siggia ED, Hadjantonakis AK
eLife 2018 Feb 7;7
eLife 2018 Feb 7;7
BCL11A interacts with SOX2 to control the expression of epigenetic regulators in lung squamous carcinoma.
Lazarus KA, Hadi F, Zambon E, Bach K, Santolla MF, Watson JK, Correia LL, Das M, Ugur R, Pensa S, Becker L, Campos LS, Ladds G, Liu P, Evan GI, McCaughan FM, Le Quesne J, Lee JH, Calado D, Khaled WT
Nature communications 2018 Aug 20;9(1):3327
Nature communications 2018 Aug 20;9(1):3327
Selection and dynamics of embryonic stem cell integration into early mouse embryos.
Alexandrova S, Kalkan T, Humphreys P, Riddell A, Scognamiglio R, Trumpp A, Nichols J
Development (Cambridge, England) 2016 Jan 1;143(1):24-34
Development (Cambridge, England) 2016 Jan 1;143(1):24-34
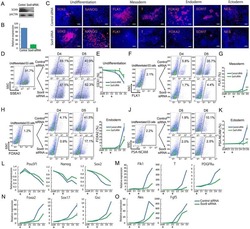
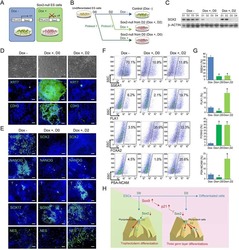
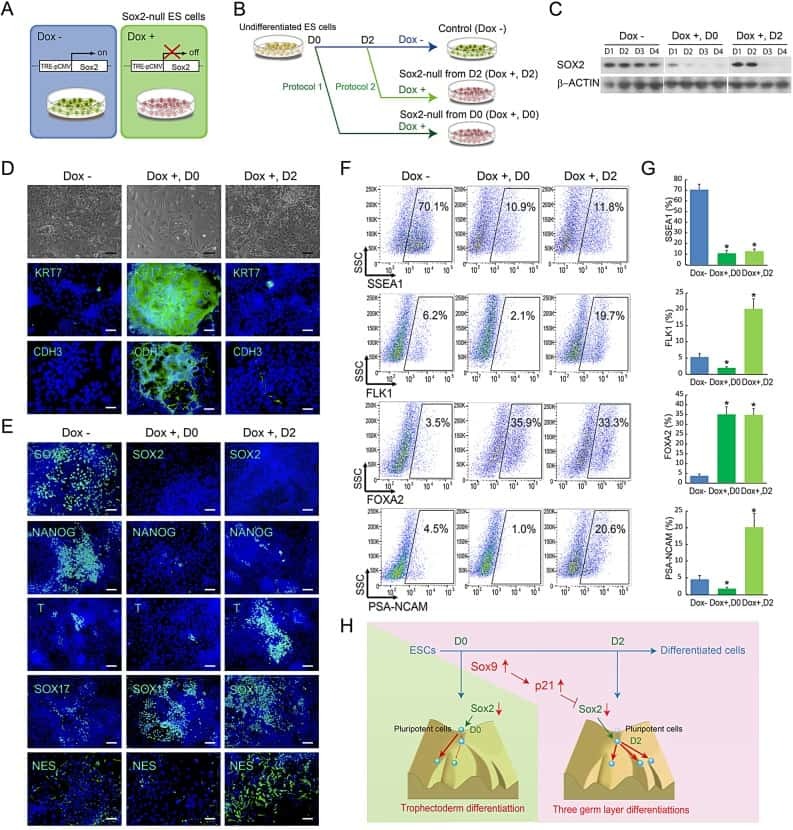
SOX9 accelerates ESC differentiation to three germ layer lineages by repressing SOX2 expression through P21 (WAF1/CIP1).
Yamamizu K, Schlessinger D, Ko MS
Development (Cambridge, England) 2014 Nov;141(22):4254-66
Development (Cambridge, England) 2014 Nov;141(22):4254-66
Disease-specific induced pluripotent stem cells.
Park IH, Arora N, Huo H, Maherali N, Ahfeldt T, Shimamura A, Lensch MW, Cowan C, Hochedlinger K, Daley GQ
Cell 2008 Sep 5;134(5):877-86
Cell 2008 Sep 5;134(5):877-86
Induction of pluripotent stem cells from adult human fibroblasts by defined factors.
Takahashi K, Tanabe K, Ohnuki M, Narita M, Ichisaka T, Tomoda K, Yamanaka S
Cell 2007 Nov 30;131(5):861-72
Cell 2007 Nov 30;131(5):861-72
Induction of pluripotent stem cells from mouse embryonic and adult fibroblast cultures by defined factors.
Takahashi K, Yamanaka S
Cell 2006 Aug 25;126(4):663-76
Cell 2006 Aug 25;126(4):663-76
No comments: Submit comment
Supportive validation
- Submitted by
- Invitrogen Antibodies (provider)
- Main image
- Experimental details
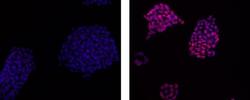
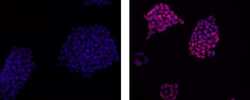
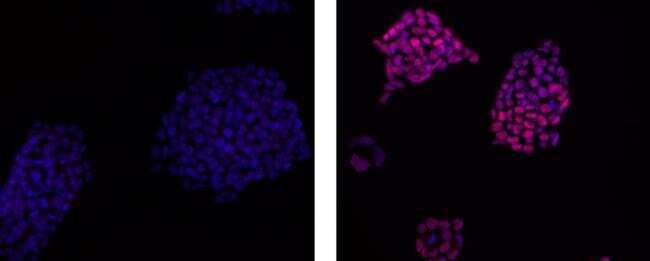
- Immunocytochemistry of F9 cells using 5 µg/mL of Rat IgG2a Isotype Control eFluor® 570 (left) or 5 µg/mL of Anti-Human/Mouse Sox2 eFluor® 570 (right). Nuclei are stained with DAPI.

- Submitted by
- Invitrogen Antibodies (provider)
- Main image
- Experimental details
- Immunocytochemistry of F9 cells using 5 µg/mL of Rat IgG2a Isotype Control eFluor® 570 (left) or 5 µg/mL of Anti-Human/Mouse Sox2 eFluor® 570 (right). Nuclei are stained with DAPI.
Supportive validation
- Submitted by
- Invitrogen Antibodies (provider)
- Main image
- Experimental details
- NULL

- Submitted by
- Invitrogen Antibodies (provider)
- Main image
- Experimental details
- NULL

- Submitted by
- Invitrogen Antibodies (provider)
- Main image
- Experimental details
- NULL
- Submitted by
- Invitrogen Antibodies (provider)
- Main image
- Experimental details
- NULL

- Submitted by
- Invitrogen Antibodies (provider)
- Main image
- Experimental details
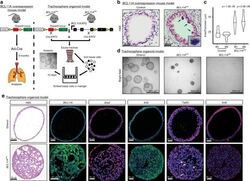
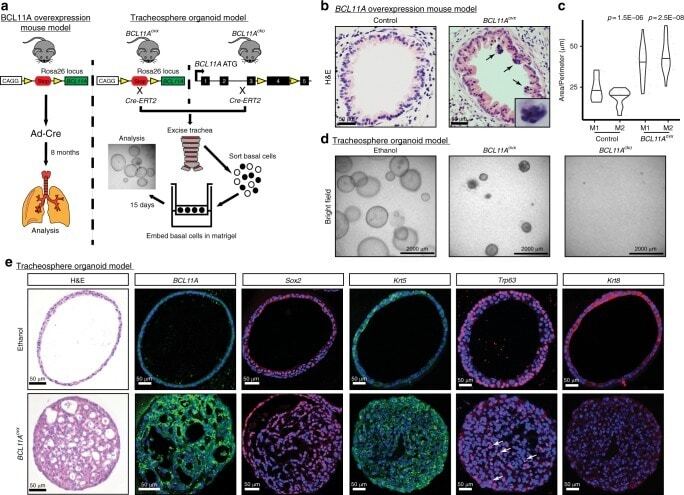
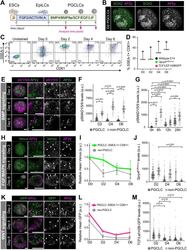
- Fig. 2 BCL11A overexpression leads to thickening of the airways and abnormal organoid formation. a Schematic representing strategy to explore the role of BCL11A in vivo and ex vivo. Left Panel: Adenovirus-Cre was nasally administered to BCL11A ovx mice and the lungs were analysed after eight months. Right panel: for the tracheosphere organoid model, basal cells from the trachea of either BCL11A ovx or BCL11A cko mice were FACS sorted, embedded in matrigel and analysed after 15 days. Three independent mice were used for each experiment. b Images of airways from control and BCL11A ovx . Arrows indicate small hyperchromatic cells with irregular nuclei. c Quantificaiton of airway epithelial layer hyperplasia from two control and BCL11A ovx mice. d Bright field images of organoids from Bcl11a cko and BCL11A ovx mice treated with vehicle or tamoxifen. e Sectioned organoids from BCL11A ovx mice stained with haematoxylin and eosin, BCL11A, Sox2, Krt5, Trp63 and Krt8. Arrows indicate positive staining. Scale bar indicates 50 mum
- Submitted by
- Invitrogen Antibodies (provider)
- Main image
- Experimental details
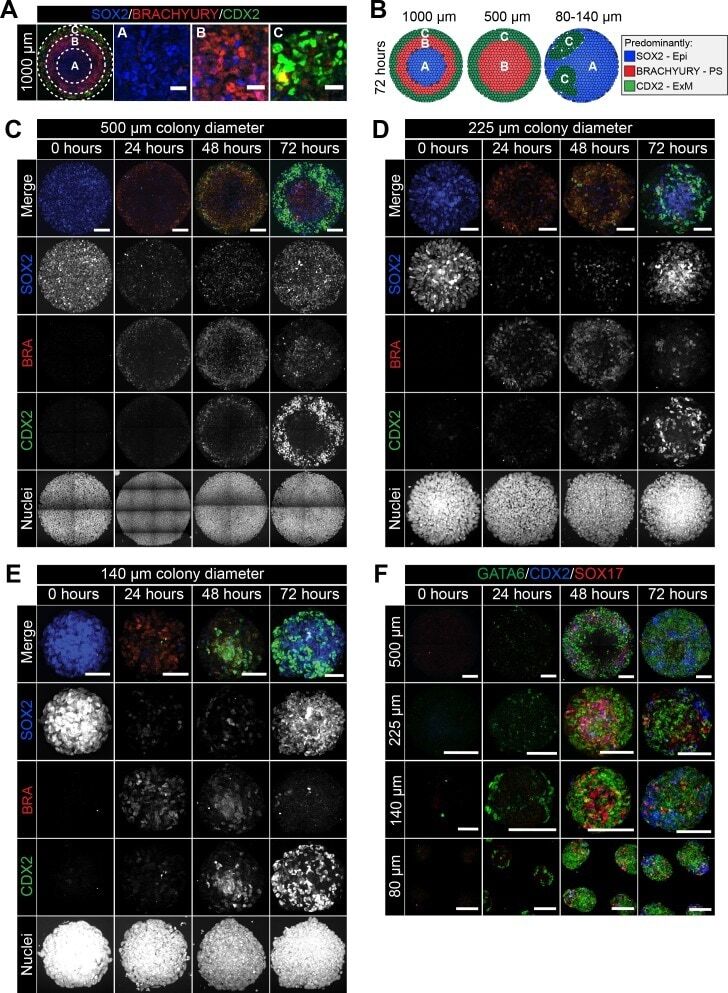
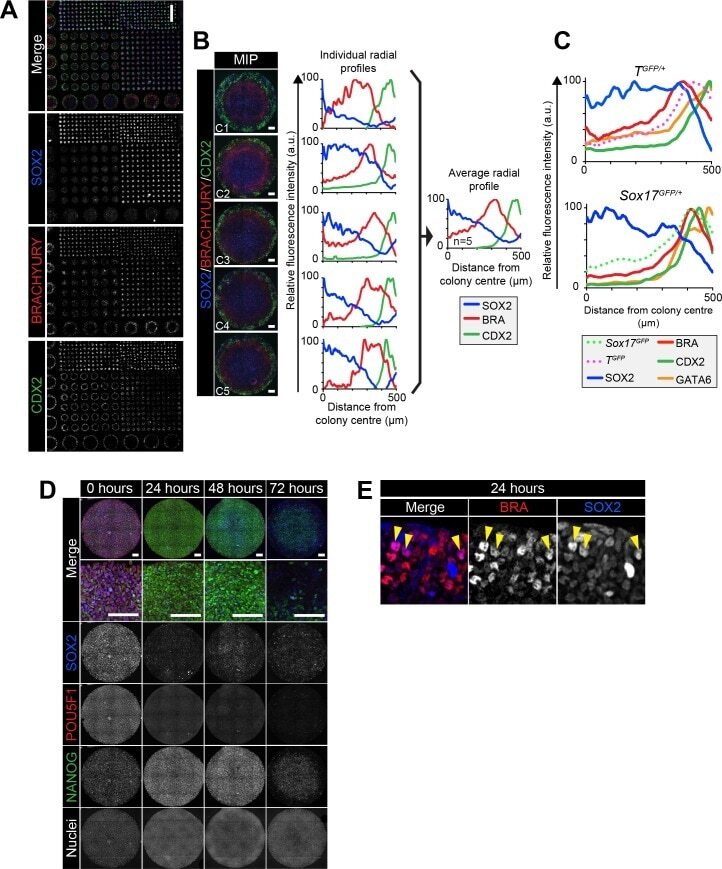
- Figure 2--figure supplement 2. Robust micropattern differentiation of EpiLCs. ( A ) Confocal maximum intensity projection (MIP) showing micropatterned colonies of 1000, 500, 250, 140 and 80 mum diameter. Scale bar, 1000 mum. ( B ) Left panels show confocal MIP images of 5 independent 1000 mum diameter colonies (C1-5). Middle panels show quantification of SOX2, BRACHYURY and CDX2 immunostaining voxel fluorescence intensity, in arbitrary units (a.u.), from colony center (0) to edge (500). Data relative to maximum voxel intensity for each marker. Right panel shows average radial profile of these five colonies. ( C ) While much of the work in this study utilized E14 ESCs, comparable patterning was observed with other mouse ESC lines. Quantification of immunostaining voxel fluorescence intensity of differentiated T GFP/+ and Sox17 GFP/+ cell lines, in arbitrary units (a.u.), from colony center (0) to edge (500). Data represents average voxel intensity across multiple colonies relative to maximum voxel intensity for each marker. For T GFP/+ cells, GATA6, SOX2: n = 10, BRACHYURY, CDX2, T GFP : n = 11. For Sox17 GFP/+ cells, SOX2: n = 5, BRACHYURY, CDX2, Sox17 GFP : n = 6, GATA6: n = 5. ( D ) Confocal MIPs of immunostained colonies differentiated as in Figure 2E . Scale bars, 100 mum. ( E ) High magnification confocal image of the colony edge after 24 hr in conditions defined in Figure 2E . Yellow arrowheads mark cells coexpressing BRACHYURY and SOX2.
- Submitted by
- Invitrogen Antibodies (provider)
- Main image
- Experimental details
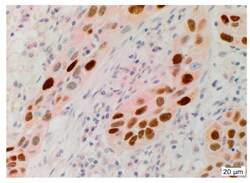
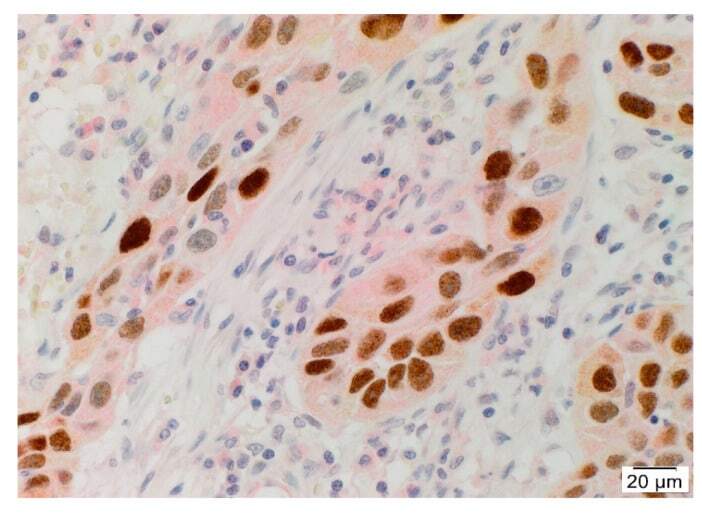
- Figure 2 Representative double immunohistochemical-stained section of metastatic head and neck cutaneous squamous cell carcinoma demonstrating cytoplasmic expression of angiotensinogen (red) in CSCs with nuclear expression of SOX2 (brown), within the TNs. Cell nuclei were counter-stained with hematoxylin (blue). Original magnification: 400x. n = 2.
- Submitted by
- Invitrogen Antibodies (provider)
- Main image
- Experimental details
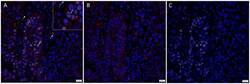
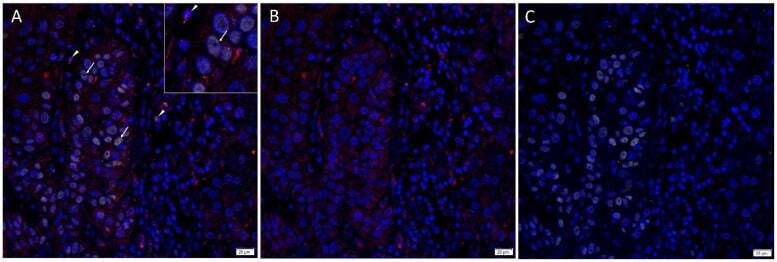
- Figure 3 Representative merged and split immunofluorescence-stained sections of metastatic head and neck cutaneous squamous cell carcinoma demonstrating the expression of PRR ( A , B , red) by SOX2+ ( A , C , yellow) CSCs throughout the tumor nests (TNs, arrows ) and the peritumoral stroma (PTS, arrowheads ). Cell nuclei were counter-stained with 4'',6-diamidino-2-phenylindole ( A - C , blue). The inserts show enlarged views of the corresponding images Original magnification 400x. n = 2.
- Submitted by
- Invitrogen Antibodies (provider)
- Main image

- Experimental details
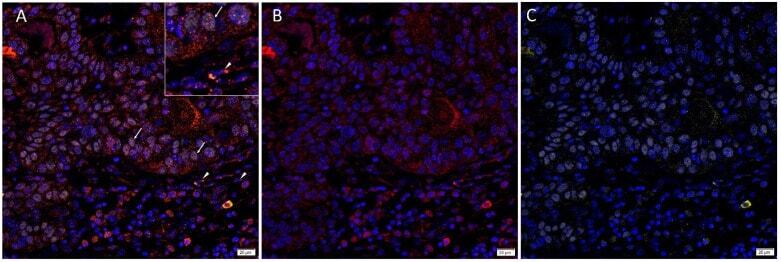
- Figure 5 Representative merged and split immunofluorescence-stained sections of metastatic head and neck cutaneous squamous cell carcinoma demonstrating the expression of AT 2 R ( A , B , red) in the cytoplasm and nucleus of the SOX2+ ( A , C , yellow) CSCs within the TNs ( arrows ) and the PTS ( arrowheads ). Cell nuclei were counter-stained with 4''6-diamidino-2-phenylindole ( A - C , blue). The inserts show enlarged views of the corresponding images Original magnification 400x. n = 2.
- Submitted by
- Invitrogen Antibodies (provider)
- Main image

- Experimental details
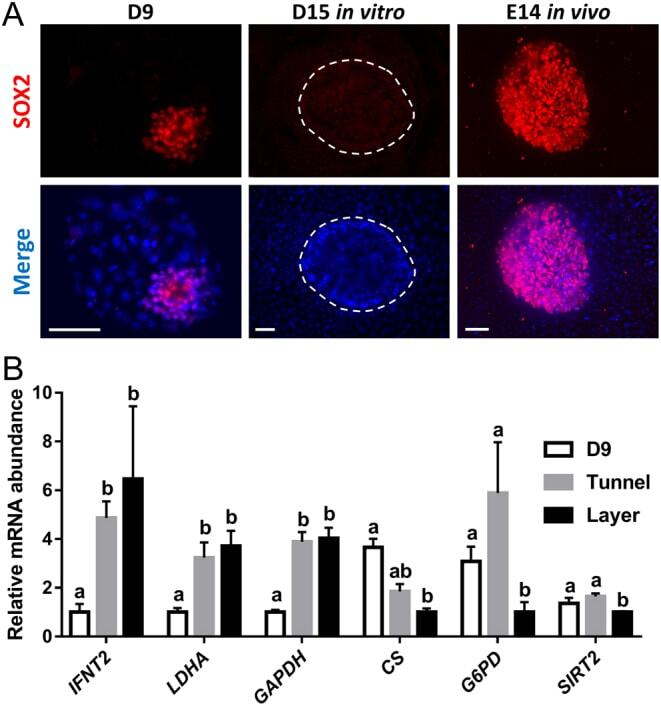
- Figure 3 Immunofluorescence detection of epiblast cells and relative mRNA abundance following culture in agarose tunnel or layer in PHD medium. (A) Epiblast development is impaired in D15 embryos developed in PHD medium. Immunofluorescence staining for SOX2 (epiblast) in representative D9 blastocyst (left column), D15 embryo developed in vitro in PHD medium (medium column) and E14 in vivo developed embryonic disc. Nuclei were counterstained with DAPI (merge). Scale bars = 50 um. (B) Relative mRNA abundance in D9 and D15 embryos cultured in agarose tunnel or layer in PHD medium. Different letters indicate significant differences based on one-way ANOVA ( P < 0.05).
- Submitted by
- Invitrogen Antibodies (provider)
- Main image
- Experimental details
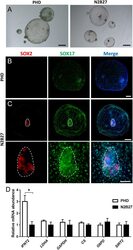
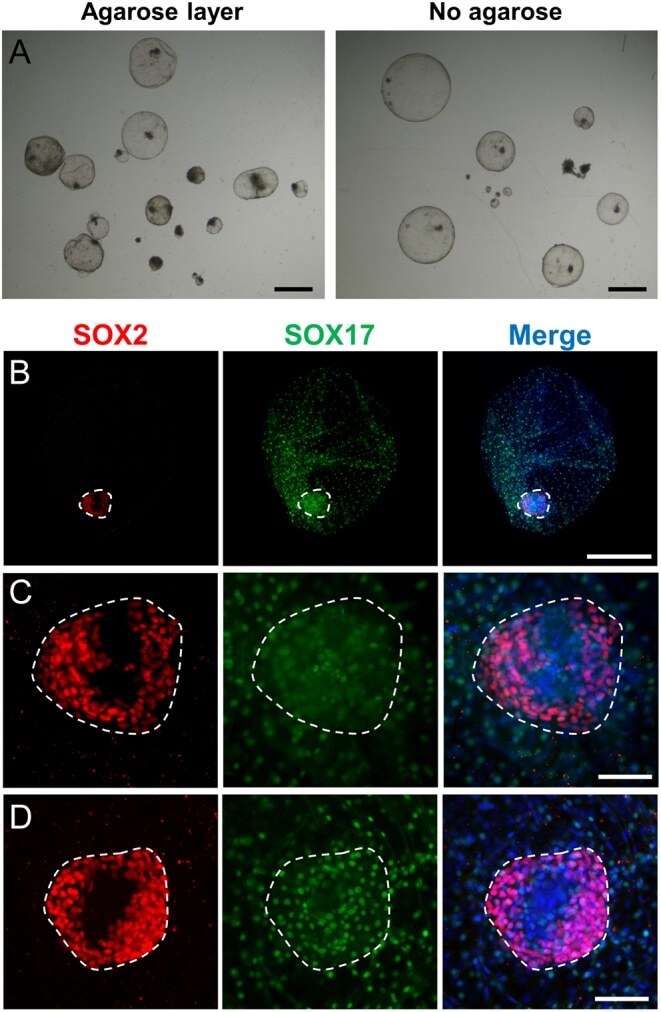
- Figure 4 Hypoblast and epiblast development and relative mRNA abundance in embryos developed in PHD or N2B27 media. (A) Representative brightfield stereomicroscopic images of D15 embryos cultured in PHD or N2B27 media over agarose layer. (B) Epiblast and hypoblast development on the only D15 embryo developed in PHD system showing complete hypoblast migration following culture. Notice the reduced density of hypoblast cells compared with C. (C) Epiblast and hypoblast development on a D15 embryo developed in N2B27 medium over agarose layer. Lower row is a magnification of the compact SOX2+ structure resembling an embryonic disc. Immunofluorescence staining for SOX2 (epiblast) and SOX17 (hypoblast); nuclei were counterstained with DAPI (merge). Scale bars = 1 mm for A; 200 um for B and C upper row; 100 um for magnification in C (lower row). (D) Relative mRNA abundance in D15 embryos cultured in PHD or N2B27 media. Asterisk indicates significant differences based on t -test ( P < 0.05).

- Submitted by
- Invitrogen Antibodies (provider)
- Main image

- Experimental details
- Figure 5 Epiblast development in N2B27 medium. (A) Representative brightfield stereomicroscopic images of D15 embryos developed in N2B27 medium in agarose-coated or agarose-free wells. (B) Epiblast and hypoblast development of a D15 representative embryo cultured in N2B27 in agarose-free well. (C) Magnification of the compact structure resembling an embryonic disc in B. (D) Representative embryonic disc-like structure from a D13 embryo cultured in N2B27 in agarose-free well. Immunofluorescence staining for SOX2 and SOX17; nuclei were counterstained with DAPI (merge). Scale bars = 1 mm for A, 500 um for B; 100 um for magnification in C and D.
- Submitted by
- Invitrogen Antibodies (provider)
- Main image
- Experimental details
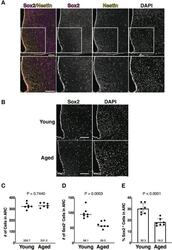
- Figure 1 Aging-associated reduction of Sox2-positive cells in number in the arcuate nucleus (ARC). (A) Representative images of the immunofluorescence labeling of Sox2 and Nestin and nuclear labeling with 4'',6-diamidino-2-phenylindole (DAPI) on the coronal sections of the hypothalamus obtained from 3-month-old male mice. Insets of upper images are shown in bottom images. Scale bars, 100 mum. (B) Representative images of the immunofluorescence labeling of Sox2 and nuclear labeling with DAPI on the coronal sections of the hypothalamus obtained from 3-month-old (young) and 25-month-old (aged) male mice. Scale bars, 100 mum. (C,D) Dot plots represent the number of all cells and Sox2-positive cells: (C) total number of cells counted by DAPI and (D) the number of Sox2-positive cells. (E) Bar graph represents the ratio of Sox2-positive cells to all cells. The mean of each condition is indicated on graph and shown as horizontal lines. Error bars, SEM. Young mice were 3-month-old. Aged mice were 24 to 26-month-old.

- Submitted by
- Invitrogen Antibodies (provider)
- Main image
- Experimental details
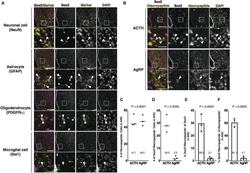
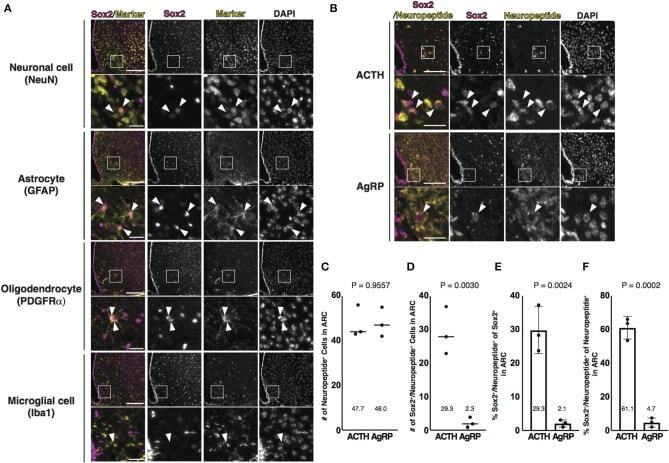
- Figure 2 Identification of Sox2 and NeuN double-positive cells in the ARC. (A,B) Representative images of the immunofluorescence labeling of indicated Abs and nuclear labeling with DAPI on the coronal sections of the ARC from 3-month-old male mice: (A) Arrowheads indicate cells labeled with each marker; (B) Arrowheads indicate Sox2 and neuropeptide double-positive cells. Scale bars in low magnification images, 100 mum. Scale bars in high magnification images, 20 mum. (C,D) Dot plots represent the number of neuropeptide-positive cells and Sox2 and neuropeptide double-positive cells: (C) neuropeptide-positive cells and (D) Sox2 and neuropeptide double-positive cells. The mean of each condition is indicated on graphs and shown as horizontal lines. (E,F) Bar graphs represent the ratio of Sox2 and neuropeptide double-positive cells to Sox2-positive and neuropeptide-positive cells: (E) Sox2-positive cells and (F) neuropeptide-positive cells. Error bars, SEM.
- Submitted by
- Invitrogen Antibodies (provider)
- Main image
- Experimental details
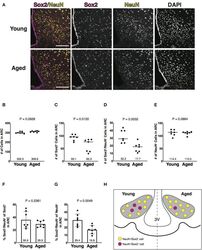
- Figure 3 Aging-associated reduction of Sox2 and NeuN double-positive cells in number in the ARC. (A) Representative images of the immunofluorescence labeling of Sox2 and NeuN and nuclear labeling with DAPI on the coronal sections of the ARC from 3-month-old (young) and 25-month-old (aged) male mice. Scale bars, 100 mum. (B-E) Reduction of Sox2 and NeuN double-positive, but not NeuN-positive cells, in number in aged ARC. Dot plots represent the number of all, Sox2-positive, Sox2 and NeuN double-positive, and NeuN-positive cells: (B) total number of cells counted by DAPI, (C) Sox2-positive cells, (D) Sox2 and NeuN double-positive cells, and (E) NeuN-positive cells. The mean of each condition is indicated on graphs and shown as horizontal lines. (F,G) Reduction of the ratio of Sox2 and NeuN double-positive cells to NeuN-positive cells, but not to Sox2-positive cells, in number in aged ARC. Bar graphs represent the ratio of Sox2 and NeuN double-positive cells to Sox2-positive and NeuN-positive cells: (F) Sox2-positive cells; and (G) NeuN-positive cells. Error bars, SEM. Young mice were 3-month-old. Aged mice were 24 to 26-month-old. (H) Schematic representation of the aging-associated reduction of Sox2 and NeuN double-positive cells in number. Gray areas represent the ARC. 3V, the third ventricle.

- Submitted by
- Invitrogen Antibodies (provider)
- Main image
- Experimental details
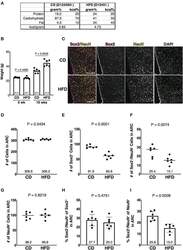
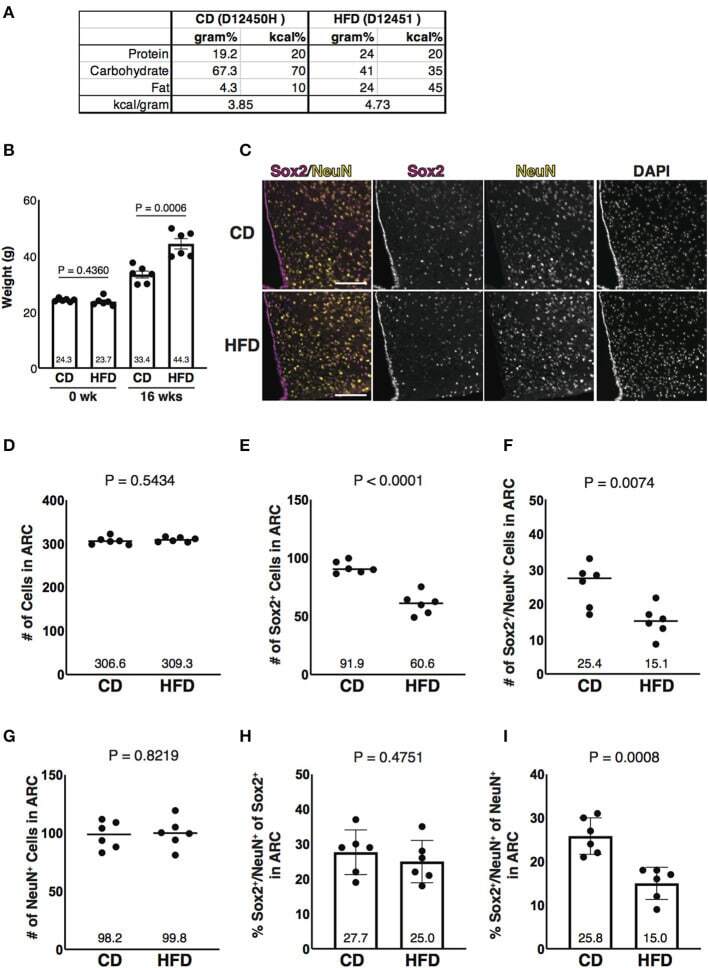
- Figure 4 Diet-induced obesity-associated reduction of Sox2 and NeuN double-positive cells in number in the ARC. (A) Formula of diets used in this study. CD, control diet; HFD, high-fat diet. Both diets, as indicated in the catalog number, were purchased from Research Diets. (B) Bar graph represents the weight of animals before feeding CD or HFD (0 week) and after 16 weeks of CD or HFD feeding (16 weeks). The mean of each condition is indicated on graph. Error bars, SEM. (C) Representative images of the immunofluorescence labeling of Sox2 and NeuN and nuclear labeling with DAPI on the coronal sections of the ARC from mice fed with CD and HFD. Scale bars, 100 mum. (D-G) Reduction of Sox2 and NeuN double-positive cells, but not NeuN-positive cells, in number in HFD sample. Dot plots represent the number of all, Sox2-positive, Sox2 and NeuN double-positive, and NeuN-positive cells: (D) total number of cells counted by DAPI, (E) Sox2-positive cells, (F) Sox2 and NeuN double-positive cells, and (G) NeuN-positive cells. The mean of each condition is indicated on graphs and shown as horizontal lines. (H,I) Reduction of the ratio of Sox2 and NeuN double-positive cells to NeuN-positive cells, but not to Sox2-positive cells, in number in HFD sample. Bar graphs represent the ratio of Sox2 and NeuN double-positive cells to Sox2-positive and NeuN-positive cells: (H) Sox2-positive cells and (I) NeuN-positive cells. Error bars, SEM.
- Submitted by
- Invitrogen Antibodies (provider)
- Main image

- Experimental details
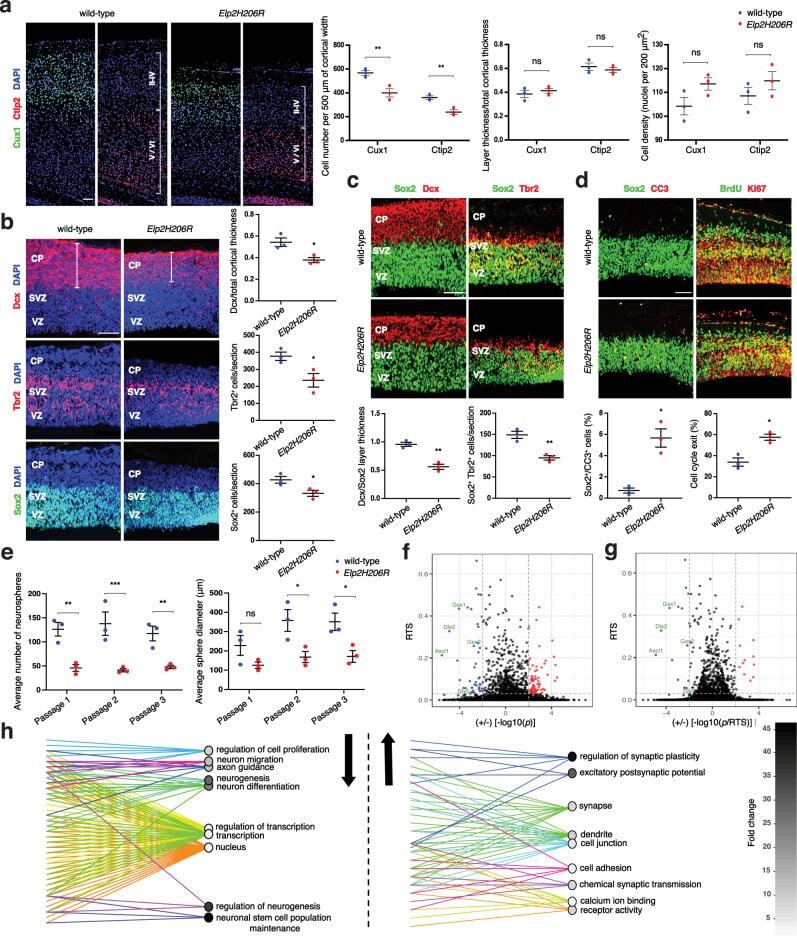
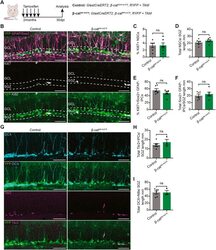
- Fig. 7 Elp2H206R impairs neurogenesis in mice. a Immunostaining of sagittal brain sections of adult wild-type and Elp2H206R mice, for layer-specific markers Cux1 (upper layers, II-IV) and Ctip2 (lower layers, V and VI). Cux1 + and Ctip2 + cell number, thickness (white lines), and cell density are shown. b - d Immunofluorescence staining of coronal cortical sections of 14.5 days post-coitum (dpc) wild-type and Elp2H206R embryos using Dcx (differentiating neurons), Tbr2 (intermediate progenitors) and Sox2 (apical progenitors) markers. Sections were counterstained with DAPI. b Dcx thickness (white lines) and Tbr2 + and Sox2 + cell number. c Dcx to Sox2 layer ratio and number of newborn intermediate progenitors (Sox2 + Tbr2 + ). d Apoptosis (cleaved caspase-3, CC3) of Sox2 + cells and cell cycle exit (percentage of BrdU + Ki67 - cells out of total BrdU + cells). e Neurosphere assay of progenitor cells derived from cortices of 14.5 dpc embryos. Average number of neurospheres and sphere diameter are shown in three consecutive passages. For ( a - e ) n = 3 animals per genotype and 3 sections per animal ( a - d ); representative images are shown. f Differential expression (DE) of genes in the forebrain extracts of Elp2H206R vs. wild-type 14.5 dpc embryos ( n = 6 per genotype). g Transformation of the DE data from ( f ) using TRIAGE. Top downregulated transcripts of genes involved in early neurogenesis are depicted. The vertical dotted lines demarcate p = 0.01 in ( f ), and p -value d
- Submitted by
- Invitrogen Antibodies (provider)
- Main image
- Experimental details
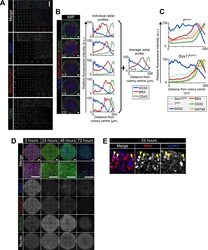
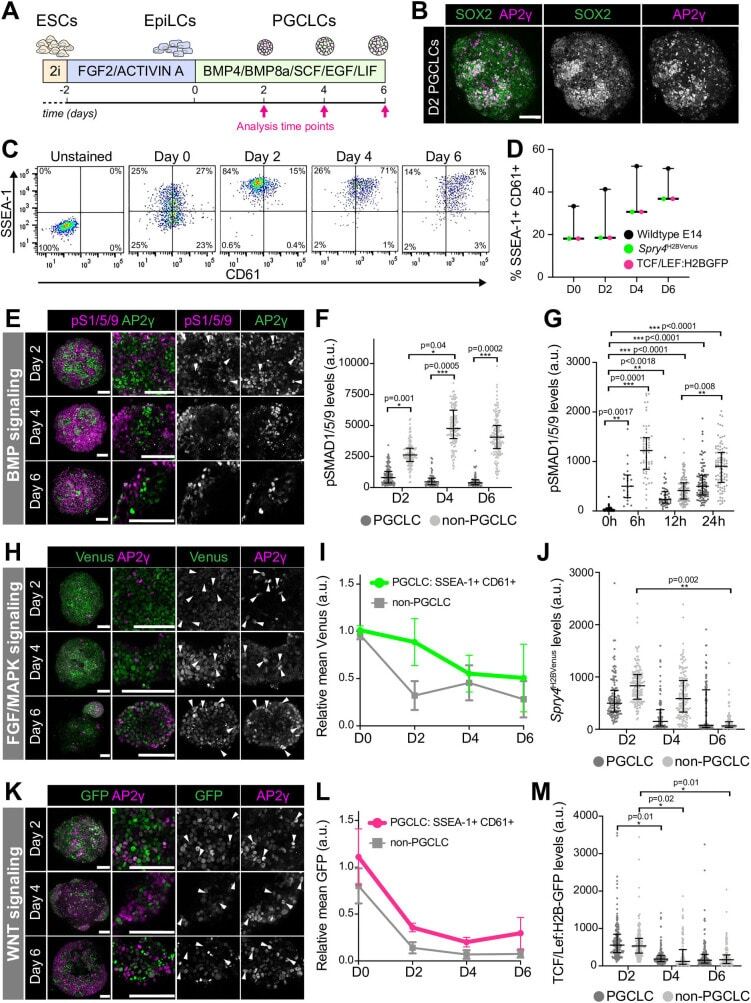
- Fig. 1. Quantitative analysis PGCLC signaling responses. (A) Diagram depicting PGCLC differentiation protocol (). (B) Confocal maximum intensity projection (MIP) of a Day 2 (D2) PGCLC aggregate. Scale bars: 100 mum. (C) Flow cytometry data from PGCLC differentiation. SSEA-1+ CD61+ cells represent PGCLCs. (D) Percentage of SSEA-1+ CD61+ PGCLCs over time. Each point represents an independent experiment ( n =6) performed with four cell lines, represented as median and interquartile range. (E,H,K) Confocal MIPs of PGCLC aggregates at day 2, 4, and 6. Sb, 100 mum. (E) Aggregates immunostained for AP2gamma (PGCLCs) and phosphorylated SMAD1/5/9 (pS1/5/9), a readout of BMP signaling response. (H) PGCLC differentiation of Spry4 H2BVenus reporter ESCs, that read out FGF/MAPK signaling activity. (K) PGCLC differentiation of TCF/Lef:H2B-GFP reporter ESCs, which read out WNT signaling activity. (F,J,M) Quantitative immunofluorescence of signaling responses in PGCLCs (AP2gamma+) and non-PGCLCs (AP2gamma-) in three cell aggregates/time point/cell line. Each point represents a single cell. Data shown as median and interquartile range. Student's t -test was performed on average fluorescence level per aggregate. (G) Quantitative immunofluorescence of signaling responses in PGCLCs (AP2gamma+) and non-PGCLCs (AP2gamma-) at early differentiation time points. Each point represents a single cell. Data shown as median and interquartile range. Student's t -test was performed on average fluorescence l
- Submitted by
- Invitrogen Antibodies (provider)
- Main image
- Experimental details
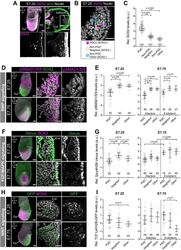
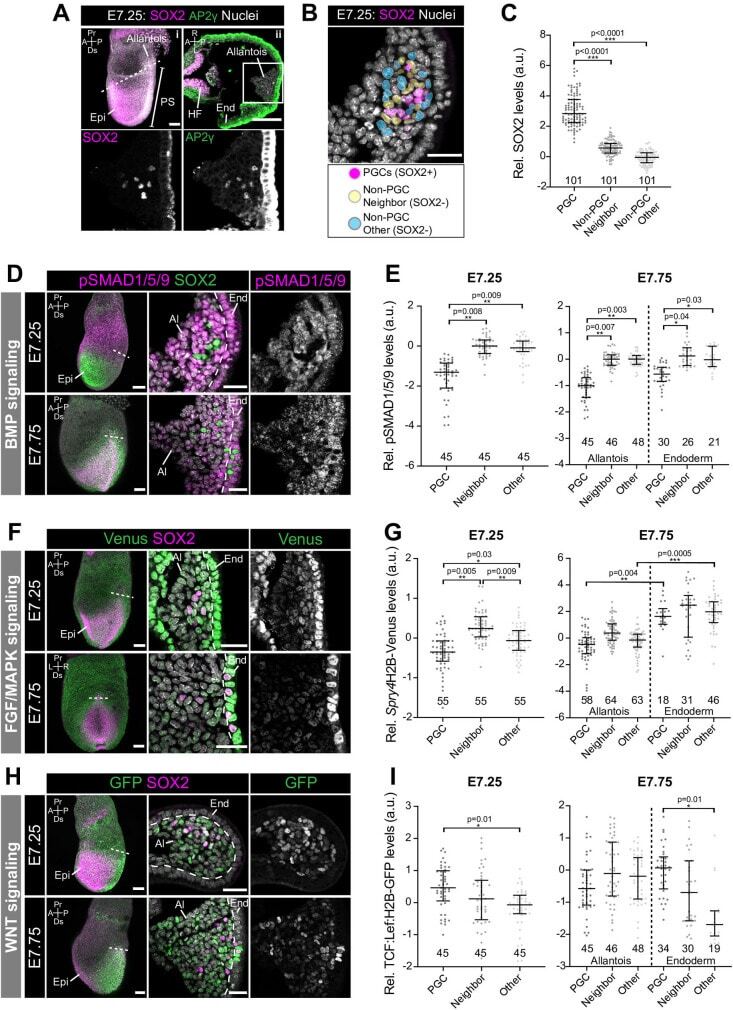
- Fig. 2. Quantitative analysis of signaling responses during PGC specification in vivo . (A) (i) Sagittal confocal optical section of an immunostained E7.25 embryo. Scale bar: 100 mum. Dashed line indicates plane of transverse section in adjacent panel. (ii) Confocal optical section of a transverse cryosection through the E7.25 allantois. Scale bar: 25 mum. Box demarcates region in higher magnification in lower panels. (B) Confocal image of a transverse section of the allantois indicating the different cell populations analyzed. Cells adjacent to PGCs (yellow) were categorized as PGC 'Neighbors' and non-adjacent cells within the allantois (blue) as 'Other' (cell populations were manually selected and pseudocolored for illustrative purposes). (C) Quantification of SOX2 levels in PGCs, Neighbors and Others within the E7.25 allantois. SOX2+ levels were used to define the PGC population. Student's t -test was performed on average fluorescence level in each embryo ( n =3 embryos, number of cells indicated on graph). Each point represents a single cell. Data shown relative to average mean fluorescence in 'Other', non-PGCs and represented as median and interquartile range. (D,F,H) Sagittal confocal MIPs (left panels, Scale bar: 100 mum) and confocal optical sections of transverse cryosection through E7.25 and E7.75 allantois' (Scale bar: 25 mum). Dashed line demarcates boundary between allantois and endoderm. (D) Embryos immunostained for pSMAD1/5/9. (F) Spry4 H2BVenus reporter embry
- Submitted by
- Invitrogen Antibodies (provider)
- Main image
- Experimental details
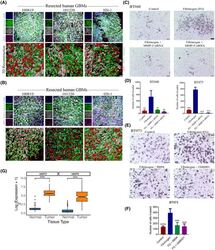
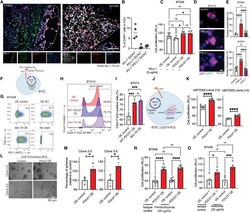
- FIGURE 7 Fibrinogen promotes BTIC invasiveness through matrix metalloproteinase-2 and -9. Immunofluorescence staining of three human GBM specimens (100819, 101220, and 026-1) for fibrinogen, SOX2, and (A) MMP-2 or (B) MMP-9. Scale bar 50 um. (C) Bright-field microscopy images of control, MMP-2, and -9 knock-down cells in presence or absence of fibrinogen (BT048) Cells were cultured in the Boyden Chamber membrane using transwell insert, where dark purple indicates individual BTIC nuclei that have invaded through the 3D matrix of type I collagen to the other side of the membrane. Scale bars 100 um. (D) Quantification of invasion in MMP-2 or MMP-9 knock-down BTIC (BT048 and BT073) following treatment with fibrinogen. (E) Bright-field microscopy images of invasion assay of BT073 in the presence or absence of fibrinogen and MMP-2 and -9 inhibitors Batimastat (BB94; 500 nM) or Ilomastat (GM6001; 10 muM). Scale bars 50 um. (F) Quantification of invasion of BT073 following treatment with BB94 or GM6001. (G) Box plots visualizes the expression of MMP2 and MMP9 genes in GBM tissues versus normal brains in TCGA-GBM and GTEx normal brain databases. ** p < 0.01, *** p < 0.001, **** p < 0.0001 compared to fibrinogen (one-way ANOVA with Tukey's multiple comparisons); n = 4 for all groups

- Submitted by
- Invitrogen Antibodies (provider)
- Main image
- Experimental details
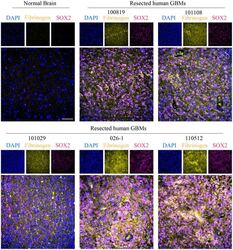
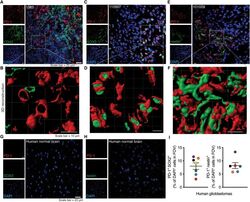
- FIGURE 3 Expression of fibrinogen in the proximity of BTICs in the GBM microenvironment. Immunofluorescence staining of fibrinogen and SOX2 in normal human brain tissue (AF12) and five human GBM tissue specimens (100819, 101108, 101029, 026-1, and 110510). The cell nuclei were stained with DAPI. Scale bas 50 um

- Submitted by
- Invitrogen Antibodies (provider)
- Main image
- Experimental details
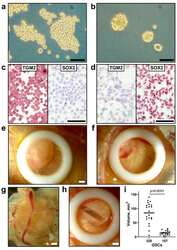
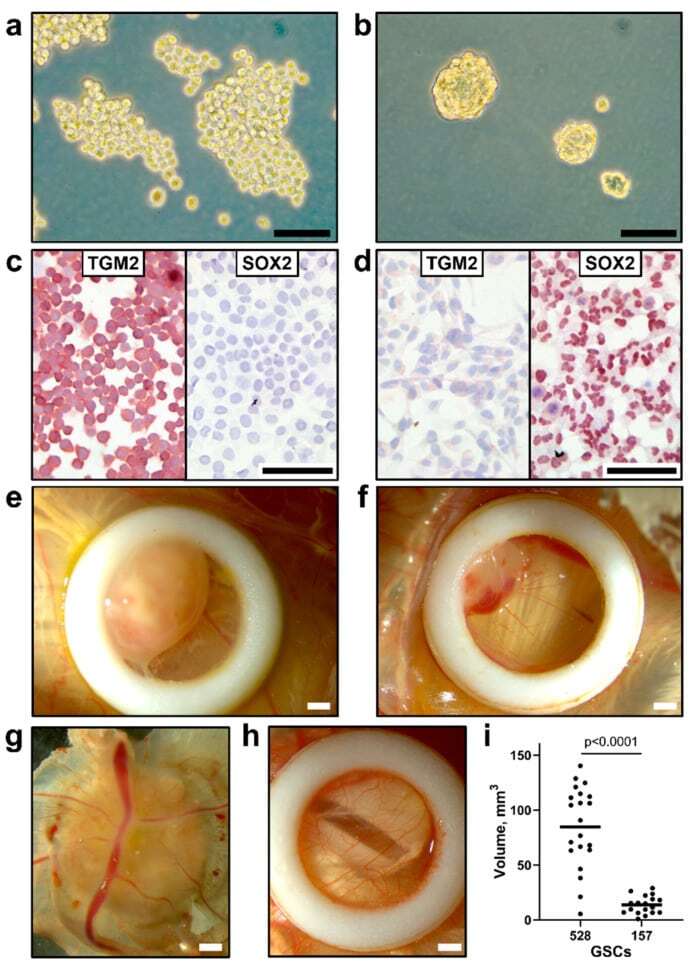
- Figure 3 Morphology of glioblastoma stem cells ( a : GSC 528; b : GSC 157) in vitro; phase-contrast microscopy. ( c ) Positive TGM2 and negative SOX2 staining in GSC 528. ( d ) Negative TGM2 and positive SOX2 staining in GSC 157. Morphology of GSC tumors ( e: GSC 528; f : GSC 157) in in ovo cultures by bright-field microscopy. ( g ) Vascularization of a GSC tumor. ( h ) Intact chorioallantoic membrane in a control egg. ( i ) The volume of tumors formed at sampling (day 19 of embryonic development (ED); Mann-Whitney test). Scale bars are 0.1 ( a - d ) and 1 mm ( e - h ). Implantation efficiency of GSC cell cultures (GSC 528: n = 27, GSC 157: n = 26) on chicken embryo CAM (GSC 528: 96%, GSC 157: 88%) and egg viability at ED 19 (GSC 528: 92%, GSC 157: 93%) were comparable in both GSC models.
- Submitted by
- Invitrogen Antibodies (provider)
- Main image
- Experimental details
- Fig. 1. The expression of PD-1 on BTICs in resected clinical GBM specimens in situ. Representative images of immunofluorescence staining and corresponding 3D reconstruction of images of ( A and B ) CD45 and PD-1, ( C and D ) PD-1 and BTIC marker SOX2, and ( E and F ) PD-1 and BTIC marker nestin in sections of human GBM specimens resected from three patients (1085, 110907, and 101029). Representative immunofluorescence images of human normal brains stained for ( G ) PD-1 and SOX2 or ( H ) PD-1 and nestin. ( I ) Quantification of immunofluorescence staining of PD-1 + SOX2 + or PD-1 + nestin + cells within the tumor microenvironment. Quantification was performed in three to four fields of view (FOVs) of each patient. Each circle is of a different patient with GBM, and the color of the dots in both panels match to the same subject. Green, 026-1; purple, 101220; orange, 110907; blue, 100819; red, 110512; black, 101029; yellow, 1085. Nuclei were counterstained with 4',6-diamidino-2-phenylindole (DAPI). Data are represented as means +- SEM. See also fig. S1 and table S1.

- Submitted by
- Invitrogen Antibodies (provider)
- Main image

- Experimental details
- Fig. 5. Coexpression of PD-1, NFkappaB activation, and proliferation marker in BTICs in GBM specimens. ( A ) Representative immunofluorescence laser confocal microscopy images and quantification of PD-1, SOX2, and p65 in sections of human GBM specimens resected from three patients (110907, 101220, and 100819). Quantification was performed in three to four FOVs of each patient. Nuclear translocation (yellow arrows) of p65 in BTICs is shown on the magnified images. Each dot in the bar graphs corresponds to the number of cells per FOV. ( B ) Representative images of immunofluorescence staining of PD-1, SOX2, and proliferative marker Ki67 in sections of human GBM specimens from three patients, with some triple-positive cells indicated by yellow arrowheads. Nuclei were counterstained with DAPI. Means were compared by unpaired (one-tailed) t test when comparing two groups. * P < 0.05, ** P < 0.01, and *** P < 0.001.

- Submitted by
- Invitrogen Antibodies (provider)
- Main image
- Experimental details
- Fig. 6. Tumor-intrinsic PD-1 does not require PD-L1 ligation to promote BTIC growth. ( A and B ) Representative immunofluorescence images and quantification of GBM specimens stained for PD-1, PD-L1, and SOX2. Dashed outlines correspond to areas where there is minimum PD-L1 around PD-1-positive BTICs. Quantification was performed in three to four FOVs of each patient. Each circle is of a different patient with GBM. Green, 026-1; purple, 101220; orange, 110907; blue, 100819. ( C ) Proliferation of BT048-OE PD-1 and control in the presence or absence of PD-L1. ( D and E ) Representative immunofluorescence and quantification of p65 translocation in BTICs after treatment with PD-L1 (5 mug/ml) for 1 hour. For each well of cells, four FOVs were quantified. TNF-alpha (100 ng/ml) was used as a control to activate p65 translocation. ( F ) Schematic of human PD-1 K78A version with defective PD-L1 binding. ( G ) Flow cytometry plots of BTICs OE wild-type or K78A PD-1. ( H and I ) Representative flow cytometry and bar plots of EdU assay. ( J ) Schematic of knocking out of mouse PD-L1 ( Cd274 ) gene by CRISPR-Cas9 and overexpressing Pdcd1 in mBT0309. ( K ) Proliferation assay of Cd274 knockout (KO) clones 2-5 and 3-5 of mBT0309-OE PD-1 compared to control. ( L and M ) Representative images of 72- to 96-hour outcomes of tumor spheres and quantification in clones 2-5 and 3-5. Proliferation of human BTICs overexpressing PD-1 and control after exposure to ( N ) PD-1 (pembrolizumab) or ( O ) PD

- Submitted by
- Invitrogen Antibodies (provider)
- Main image
- Experimental details
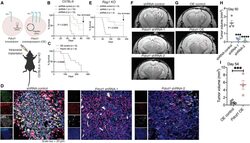
- Fig. 7. PD-1 on BTICs promotes intracranial tumor growth in mice. ( A ) Schematic diagram depicts implantation of Pdcd1 -knockdown or OE cells into the striatum of mice. Kaplan-Meier analysis to assess the survival of wild-type mice i4mplanted with ( B ) Pdcd1 knockdown or ( C ) overexpressing murine BT0309. Cells transduced with lentiviral vectors coding nontarget shRNA or transfected with empty PiggyBac vector were considered as controls for knockdown (shRNA control) or OE (OE control) BTICs, respectively. ( D ) Representative images of immunofluorescence staining of PD-1, SOX2, and p65 in sections collected from C57BL/6 wild-type mice implanted with Pdcd1 -knockdown or shRNA controls. Nuclear translocation (yellow arrowheads) and cytoplasmic localization (blue arrowheads) of p65 in BTICs are shown on the images. ( E ) Kaplan-Meier analysis of Rag1 KO mice implanted with Pdcd1 -knockdown or shRNA controls of mBT0309. Representative T2-weighted MRI images ( F ) at day 50 of Rag1 KO mice implanted with Pdcd1 -knockdown or ( G ) at day 54 of Rag1 KO mice implanted with Pdcd1 OE mBT0309 (tumor demarcated with red outlines). Quantitation of tumor volume from MRI images of mice implanted with ( H ) Pdcd1 knockdown or ( I ) OE BTICs versus respective vector controls. Results are representative of n = 2 to 3 independent experiments. Unpaired (two-tailed) t test was used to assess significance between two groups in (I). For more than two groups in (H), one-way ANOVA with Tukey's pos

- Submitted by
- Invitrogen Antibodies (provider)
- Main image
- Experimental details
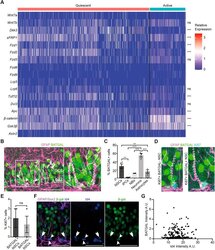
- Fig. 1. NSCs in vivo respond to Wnt/beta-catenin signalling independently of their activation state. (A) Heatmap of publicly available (GSE159768) single-cell RNA-sequencing data showing the expression of Wnt/beta-catenin pathway components from in vivo hippocampal quiescent and active NSCs (). (B) BATGAL and GFAP immunolabelling in the DG of a 2-month-old BATGAL Wnt/beta-catenin reporter mouse (). Arrows indicate BATGAL+ NSCs (SGZ cell body and GFAP+ radial process). The white-boxed area is enlarged in the adjacent panel to show three BATGAL+ NSCs. White-dashed lines denote the SGZ. (C) Quantification of the proportion of BATGAL+ cells in the DG of 2-month-old BATGAL mice, showing NSCs (GFAP+ NSCs, 29+-5.44%; n =4), IPCs (GFAP- SOX2+, 1.5+-0.6%; n =4), neuroblasts (NBs, DCX+, 11.5+-0.5; n =2), neurons (NeuN+, 55.67+-4.44%, n =3) and astrocytes (GFAP+ SOX2-, 16+-4.44%, n =3). (D) BATGAL immunolabelling in Ki67+ NSCs in 2-month-old BATGAL mice. White-dashed lines denote Ki67+ BATGAL+ NSCs and Ki67+ BATGAL- NSCs. (E) Quantification of the proportion of Ki67+ immunolabelling in BATGAL+ (2+-1%) and BATGAL- NSCs (1.33+-0.99%) shown in D. n =3. (F) BATGAL, GFAP/SOX2 and Id4 immunolabelling in the DG of 2-month-old BATGAL mice. Single arrowheads indicate Id4-positive BATGAL-positive NSCs. Double arrowheads indicate Id4-positive, BATGAL-negative NSCs. (G) Quantification of the data shown in F. n =3. Data were analysed as follows: Student's t -test (A), ordinary one-way ANOVA with Tuk

- Submitted by
- Invitrogen Antibodies (provider)
- Main image
- Experimental details
- Fig. 2. NSCs and adult hippocampal neurogenesis are unaffected by the NSC-specific deletion of beta-catenin and inhibition of Wnt/beta-catenin signalling. (A) Two-month-old control and beta-cat del ex2-6 mice were administered tamoxifen for 5 consecutive days and sacrificed 30 days after the first tamoxifen injection. (B) YFP, GFAP, SOX2 and Ki67 immunolabelling in the DG of control and beta-cat del ex2-6 mice 30 days after tamoxifen administration. White-dashed lines denote the SGZ. (C-F) Quantification of the data shown in B. C: proportion of Ki67+ NSCs (control versus beta-cat del ex2-6 : 3.33+-0.61% versus 3.333+-0.76%). D: total number of NSCs (YFP+ GFAP+ SOX2+ radial cells in the SGZ) normalised to the length of the SGZ (mm) (control versus beta-cat del ex2-6 : 21.2+-1.73 versus 23.56+-1.52). E: proportion of proliferating (Ki67+) IPCs (SOX2+ YFP+ GFAP- cells in the SGZ; control versus beta-cat del ex2-6 : 56+-4.56% versus 47.67+-4.03%). F: total number of IPCs normalised to the length of the SGZ (mm) (SOX2+ YFP+ GFAP- cells in the SGZ; control versus beta-cat del ex2-6 : 20.18+-2.31 versus 22.43+-2.62). n =6. (G) YFP, TBR2 and DCX immunolabelling in the DG of control and beta-cat del ex2-6 mice 30 days after tamoxifen administration. (H,I) Quantification of the data shown in G. H: total number of TBR2+ IPCs normalised to the SGZ length (mm) (TBR2+ YFP+ cells in the SGZ; control versus beta-cat del ex2-6 : 14.29+-1.51 versus 17.16+-3.09). I: total number of neuroblasts

- Submitted by
- Invitrogen Antibodies (provider)
- Main image

- Experimental details
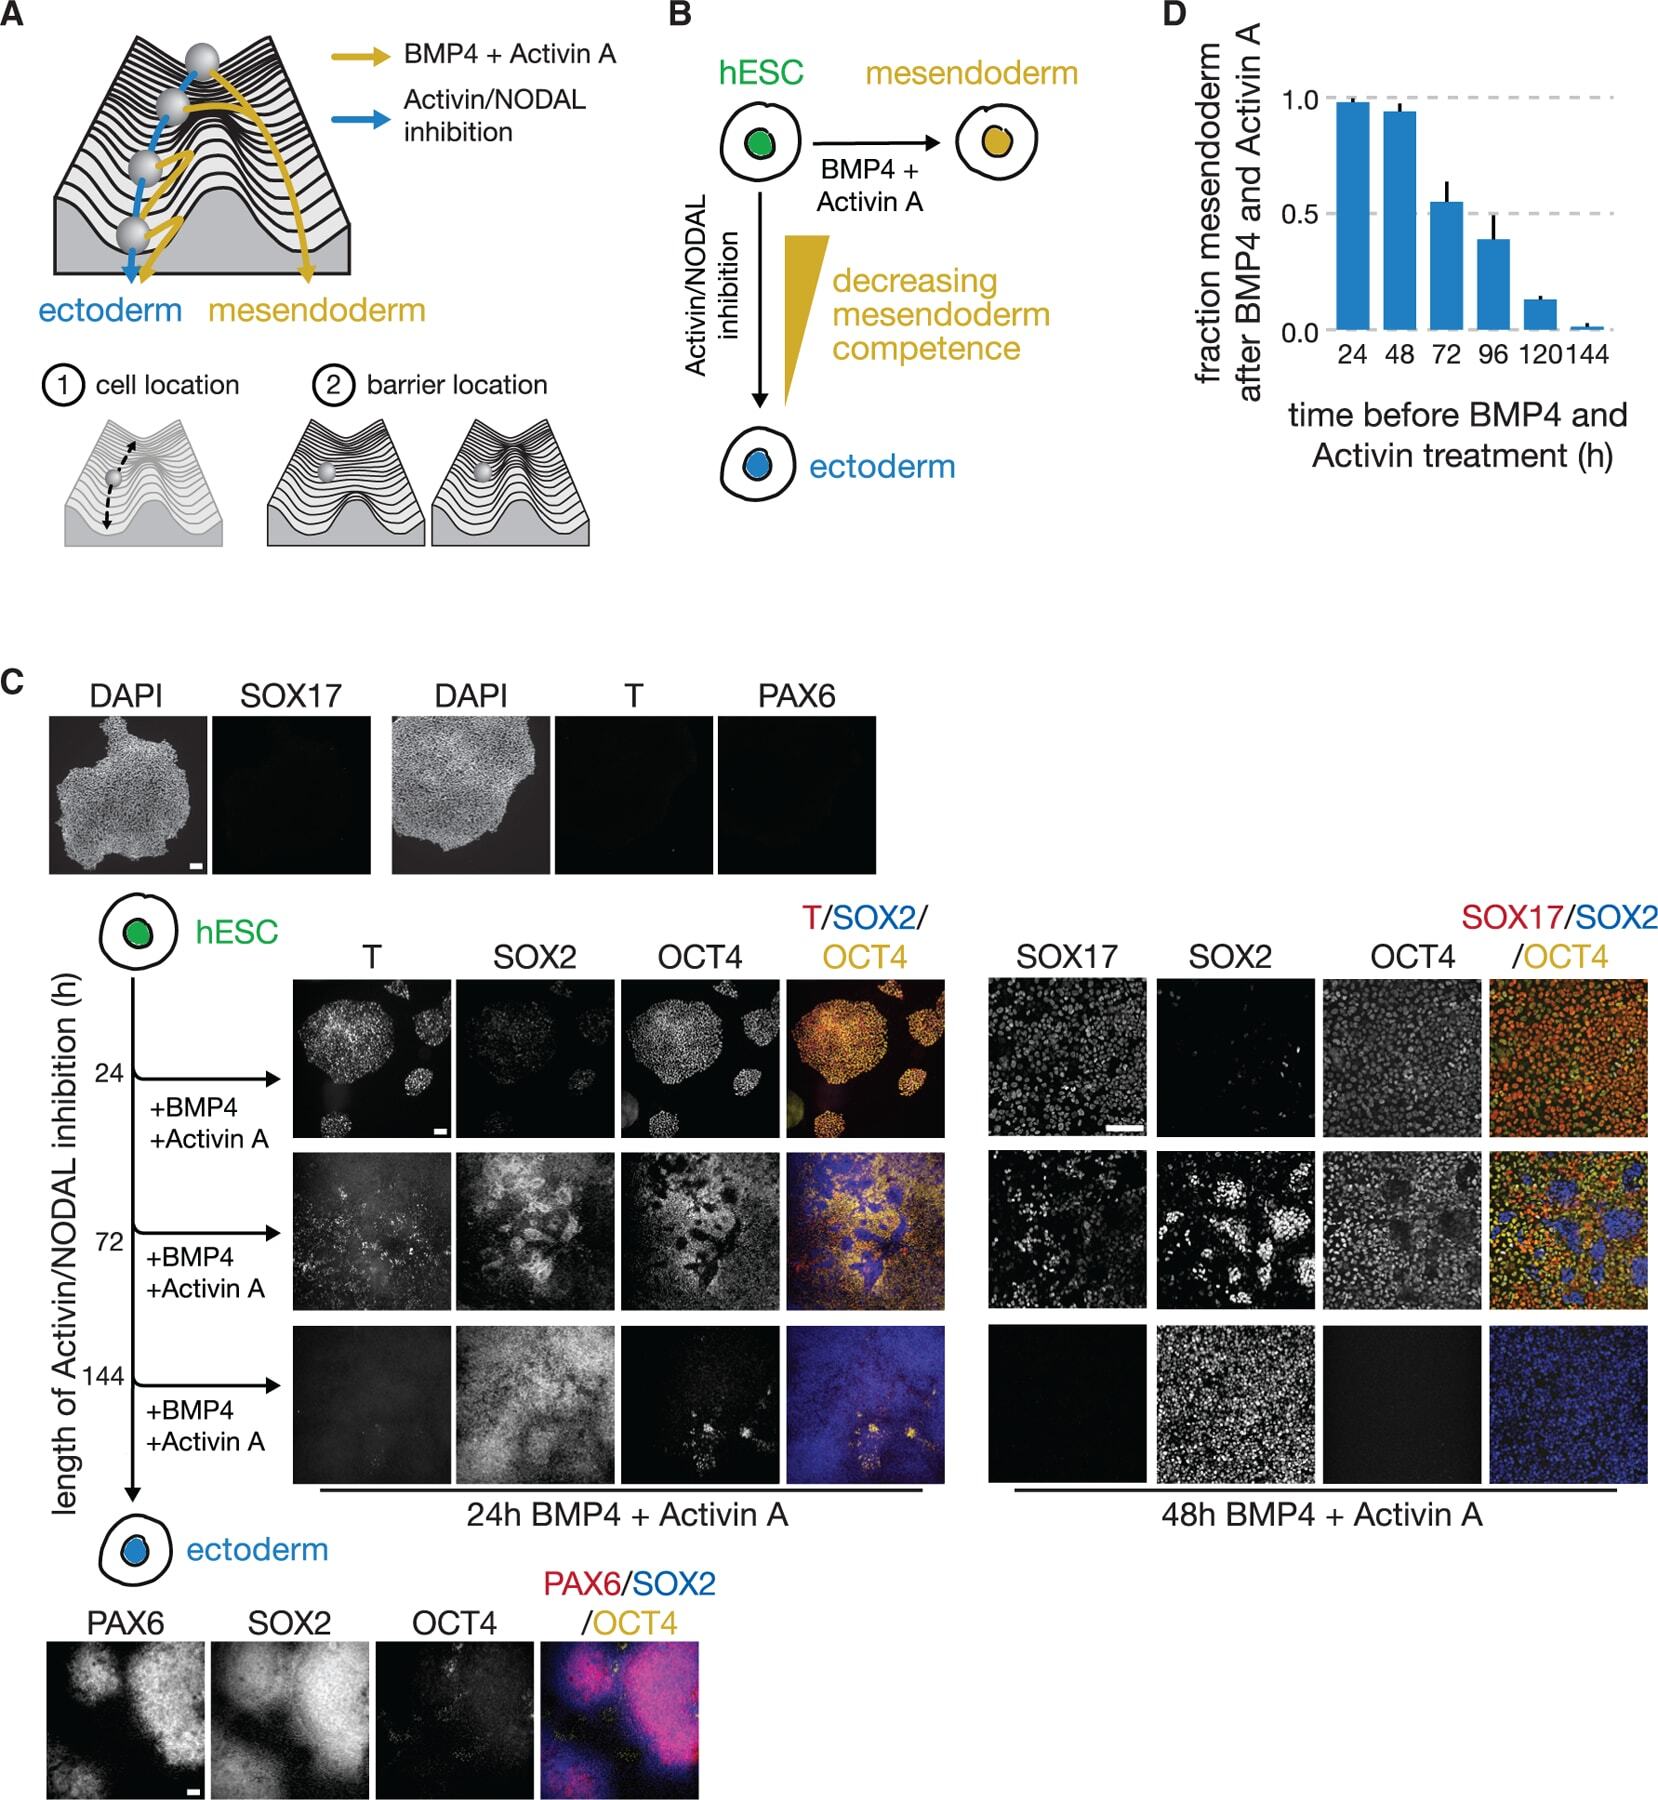
- Figure 1. Stem cells lose competence to adopt mesendodermal fates upon BMP4 and Activin A signal exposure with increasing duration of activin/NODAL inhibition (A) Schematic of a Waddington landscape illustrating the ectoderm (blue) or mesendoderm (yellow) fate choice. In this picture, the competence of a cell to produce mesendoderm depends both on the cell's location along the ectodermal developmental trajectory and on the position of the barrier between the two fates. (B) hESCs choose the ectodermal lineage in response to activin/NODAL inhibition and mesendodermal lineages in response to BMP4 + Activin A. (C) Fluorescence images of immunostained hESCs that were exposed to a pretreatment of activin/NODAL inhibition for 24, 72, or 144 h and then treated with 24 or 48 h of BMP4 + Activin A treatment. Increasing duration of activin/NODAL inhibition reduced the population's competence to produce BRACHYURY(T) + mesendoderm and SOX17 + endoderm and, more broadly, OCT4 + (yellow) SOX2 - (blue) mesendoderm-derived cell types. The spatial structures seen here largely appear after BMP4 and Activin A signal induction and are likely due to a combination of local density impacts on ectoderm-directed differentiation rate and homophilic interactions between cells. After 144 h of activin/NODAL inhibition, cells become SOX2 + , PAX6 + neuroectoderm (bottom). Cells in pluripotent state do not express T, SOX17, or PAX6. Scale bar represents 100 mum. (D) Bar graph of the fraction of cells adopti
- Submitted by
- Invitrogen Antibodies (provider)
- Main image

- Experimental details
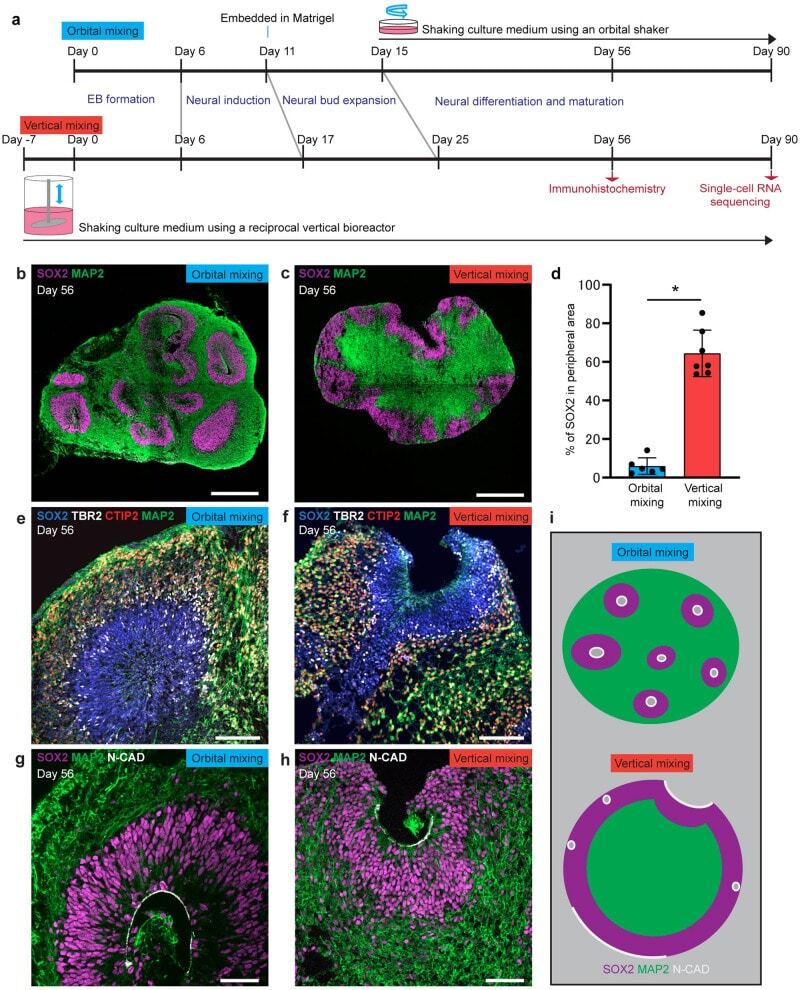
- Brain organoid generated by vertical mixing showed inverted structure in comparison with brain organoid generated by orbital mixing. a Schematic diagram of conditions used to induce brain organoid by orbital mixing (upper schema) and by vertical mixing (lower schema). b , c Immunostaining for neural progenitor (SOX2, magenta) and neuron (MAP2, green) in brain organoid generated by orbital mixing ( b ) or vertical mixing ( c ) on Day 56. d Quantification of SOX2-positive area in the peripheral region of brain organoid on Day 56. The peripheral region was defined as 100 um inside from the edge of brain organoid. Brain organoid from vertical mixing showed higher percentage of SOX2-positive area in peripheral region in comparison with brain organoid from orbital mixing. Data represent mean +- SD ( n = 6 for brain organoids by orbital mixing, n = 7 for brain organoids by vertical mixing). Difference between the two conditions was analyzed by Student's two-tailed t -test (* p < 0.0001). e , f Immunostaining for markers of neural progenitors (SOX2, blue), intermediate neural progenitors (TBR2, gray), and cortical neurons (CTIP2, red; MAP2, green) in brain organoids by orbital mixing ( e ) or vertical mixing ( f ) on Day 56. g , h Immunostaining for markers of ventricular neuroepithelial cells (N-CADHERIN: N-CAD, gray), neural progenitors (SOX2, magenta), and cortical neurons (MAP2, green) in brain organoids by orbital mixing ( g ) or vertical mixing ( h ) on Day 56. Note the apical
- Submitted by
- Invitrogen Antibodies (provider)
- Main image
- Experimental details
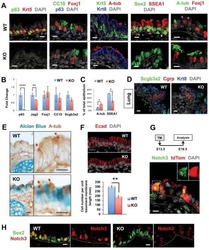
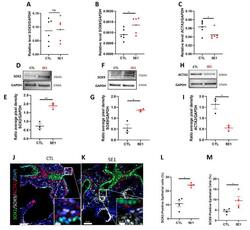
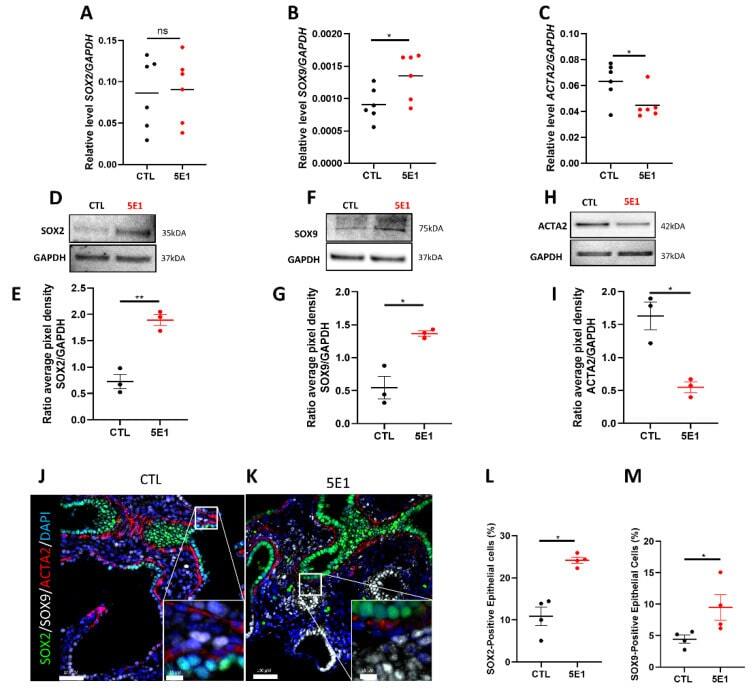
- Compartmental cell identity is altered upon Hedgehog pathway inhibition. RT-qPCR for SOX2 ( A ), SOX9 ( B ), and ACTA2 ( C ) in fetal lung explants treated with 5E1 compared to control. Results are shown as mean +- SEM, * p < 0.05, n = 6 for each group. ( D - H ) Western blot analysis of protein expression of SOX2 ( D , E ), SOX9 ( F , G ), and ACTA2 ( H , I ) in 5E1 treated explants compared to control ( n = 3 for each condition). Western blot densitometry ratios are shown in ( E , G , I ) ( n = 3 for each condition). Results are shown as mean +- SEM. IF staining of fetal lung explants treated ( K ) or not ( J ) with 5E1 for SOX2 (green), SOX9 (white), and ACTA2 (red). Quantification of the number of epithelial positive SOX2 cells ( L ) and SOX9 ( M ) ( n = 4 for each group). * p < 0.05, ** p < 0.01; ns = no stress.
- Submitted by
- Invitrogen Antibodies (provider)
- Main image
- Experimental details
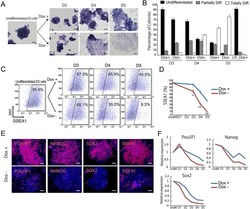
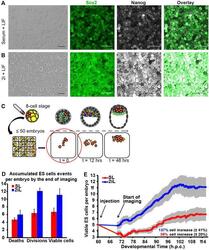
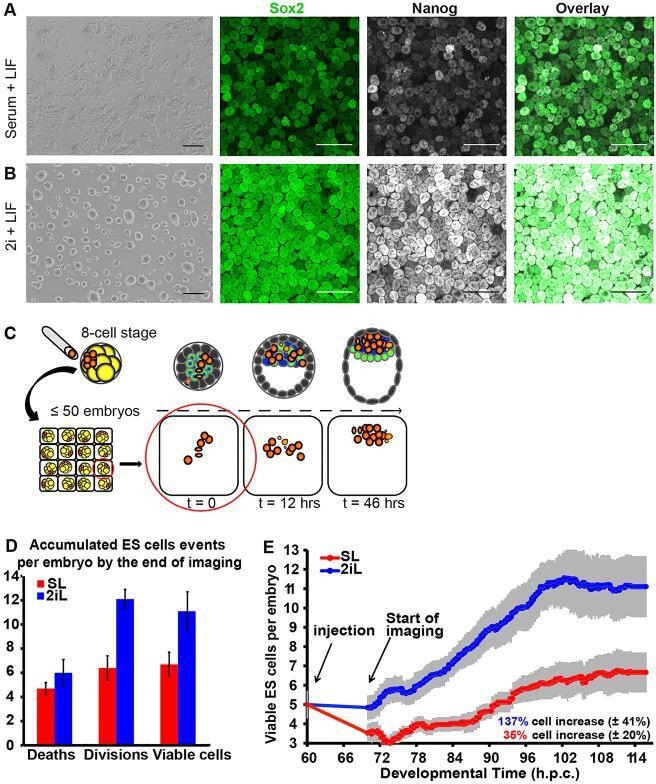
- Fig. 1. Comparison of ESCs cultured in conventional versus ground-state conditions. Morphology and immunohistochemistry of ESCs cultured for 2 days in (A) conventional, serum/LIF (SL) or (B) ground-state, 2i/LIF (2iL) conditions. Left panels: bright field; second and third panels: immunoreactivity to Sox2 (green) and Nanog (white), respectively; right panels: overlay of Sox2 and Nanog. (C) Scheme for the experimental strategy: 8-cell embryos were injected with fluorescently labelled ESCs and chimaeras transferred to an immobilising grid for live imaging for 2 days. (D) Bar plot of the average numbers of ESC deaths, divisions and resulting viable ESCs by the end of captured development. (E) Plot of the average numbers of viable ESCs per embryo over time (hpc). Grey bars reflect s.e.m. between the curves of the five embryo groups (profiles per embryo injected with 3-7 ESCs). See Table S1 for full data. Scale bars: 100 um in A,B.
- Submitted by
- Invitrogen Antibodies (provider)
- Main image

- Experimental details
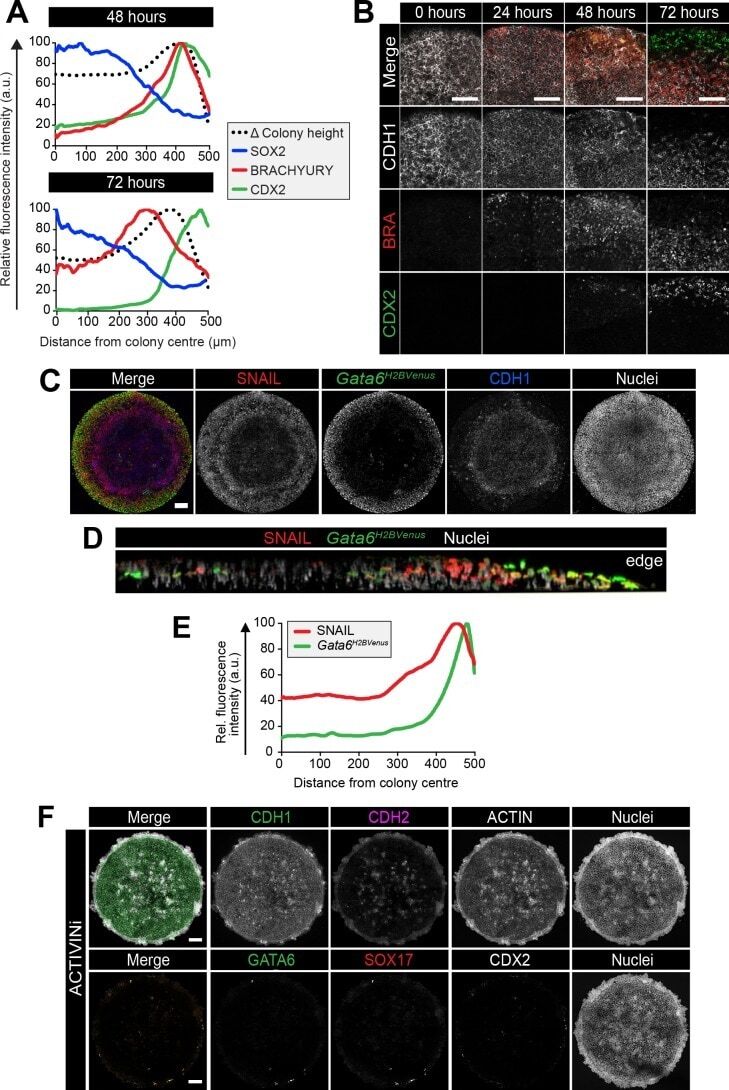
- Figure 4--figure supplement 1. Cells undergo an epithelial to mesenchymal transition during gastrulation and in vitro differentiation. ( A ) Quantification of immunostaining voxel fluorescence intensity (in arbitrary units, a.u.) of SOX2, BRACHYURY and CDX2 from colony center (0) to edge (500) as well as relative colony height. Data represents average voxel intensity or change in colony height across multiple colonies relative to the maximum value for each marker. ( B ) Confocal optical sections of the outer colony edge. Scale bars, 100 mum. ( C ) MIPs of immunostained 72 hr colonies. Scale bars, 100 mum. ( D ) Images of z-axis profile from colony center (left) to edge (right). ( E ) Quantification of immunostaining. Voxel fluorescence intensity was measured from colony center (0) to edge (500). Data represents average voxel intensity across multiple colonies (n = 9) relative to maximum voxel intensity for each marker. ( F ) EpiLCs were plated onto micropatterns overnight in N2B27 with 12 ng/ml FGF2 and 20 ng/ml ACTIVIN A (F/A). The following day medium was changed to 12 ng/ml FGF2, 50 ng/ml BMP4, 200 ng/ml WNT3A and 10 muM SB431542 (ACTIVINi). Confocal maximum intensity projections of immunostained colonies after 72 hr of differentiation. Scale bars, 100 mum. BRA, BRACHYURY.
- Submitted by
- Invitrogen Antibodies (provider)
- Main image
- Experimental details
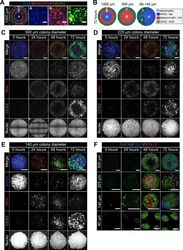
- Figure 5. Smaller diameter colonies pattern in the same order of events but lose central populations. ( A ) EpiLCs were differentiated with FGF2 and ACTIVIN A (F/A), BMP4 and WNT3A as described in Figure 2E . Confocal optical section of a representative 1000 mum diameter colony after differentiation. Dashed circles define 3 regions of distinct marker expression, shown at higher magnification in adjacent panels. While SOX2 is expressed quite broadly, regions were defined based on the marker that was predominantly expressed. Region A (central) = SOX2 (blue), Region B (intermediate) = BRACHYURY (red), Region C (outer) = CDX2 (green). Scale bars, 25 mum. ( B ) Schematic diagram showing the changing marker expression in colonies of different diameters. ( C-F ) Representative confocal maximum intensity projections of colonies at 0, 24, 48 and 72 hr after addition of BMP4 and WNT3A to F/A medium. Images show colonies of 500 mum, 225 mum, 140 mum and 80 mum diameter. Scale bars, 100 mum. Figure 5--figure supplement 1. Patterning of cell fates is altered at different colony diameters. EpiLCs were differentiated as previously described in Figure 2E on different diameter micropatterns. Images show confocal maximum intensity projections of immunostained colonies after 72 hr of differentiation. Three representative examples are shown for each colony diameter. Scale bars, 100 mum.