 Explore
 Validate
 Learn
Learn Western blot
Antibody data
- Antibody Data
- Antigen structure
- References [16]
- Comments [0]
- Validations
- Western blot [2]
- Immunohistochemistry [2]
- Flow cytometry [1]
- Other assay [16]
Submit
Validation data
Reference
Comment
Report error
- Product number
- PA1-16968 - Provider product page

- Provider
- Invitrogen Antibodies
- Product name
- SOX2 Polyclonal Antibody
- Antibody type
- Polyclonal
- Antigen
- Synthetic peptide
- Description
- The target sequence has 92% sequence homology with chicken, 86% sequence homology with xenopus, and 71% sequence homology with zebrafish. Suggested positive control: antigen standard for SOX2 (transient overexpression lysate), mouse brain lysate, mouse brain protein, uterual endometrial glands.
- Reactivity
- Human, Mouse, Rat, Canine
- Host
- Rabbit
- Isotype
- IgG
- Vial size
- 100 µL
- Concentration
- 1.0 mg/mL
- Storage
- -20° C, Avoid Freeze/Thaw Cycles
Submitted references Aberrant Expression of Circulating MicroRNA Leads to the Dysregulation of Alpha-Synuclein and Other Pathogenic Genes in Parkinson's Disease.
Gelatin methacrylate hydrogels culture model for glioblastoma cells enriches for mesenchymal-like state and models interactions with immune cells.
Impaired stem cell differentiation and somatic cell reprogramming in DIDO3 mutants with altered RNA processing and increased R-loop levels.
Cell-type-specific profiling of human cellular models of fragile X syndrome reveal PI3K-dependent defects in translation and neurogenesis.
Differentiation of Human Mesenchymal Stem Cells from Wharton's Jelly Towards Neural Stem Cells Using A Feasible and Repeatable Protocol.
miR-590-3p and Its Downstream Target Genes in HCC Cell Lines.
Generation and characterization of a human iPSC line (UAMi004-A) from a patient with propionic acidemia due to defects in the PCCB gene.
Altered transcriptional regulatory proteins in glioblastoma and YBX1 as a potential regulator of tumor invasion.
Generation of two transgene-free human iPSC lines from CD133(+) cord blood cells.
Dynamic intercellular transport modulates the spatial patterning of differentiation during early neural commitment.
Comprehensive characterization of chorionic villi-derived mesenchymal stromal cells from human placenta.
bFGF-mediated pluripotency maintenance in human induced pluripotent stem cells is associated with NRAS-MAPK signaling.
SETD7 Regulates the Differentiation of Human Embryonic Stem Cells.
Expansion and differentiation of germline-derived pluripotent stem cells on biomaterials.
Characterization of pluripotent stem cells.
Human stem/progenitor cells from bone marrow enhance glial differentiation of rat neural stem cells: a role for transforming growth factor β and Notch signaling.
Cai M, Chai S, Xiong T, Wei J, Mao W, Zhu Y, Li X, Wei W, Dai X, Yang B, Liu W, Shu B, Wang M, Lu T, Cai Y, Zheng Z, Mei Z, Zhou Y, Yang J, Zhao J, Shen L, Ho JWK, Chen J, Xiong N
Frontiers in cell and developmental biology 2021;9:695007
Frontiers in cell and developmental biology 2021;9:695007
Gelatin methacrylate hydrogels culture model for glioblastoma cells enriches for mesenchymal-like state and models interactions with immune cells.
Shah N, Hallur PM, Ganesh RA, Sonpatki P, Naik D, Chandrachari KP, Puchalski RB, Chaubey A
Scientific reports 2021 Sep 6;11(1):17727
Scientific reports 2021 Sep 6;11(1):17727
Impaired stem cell differentiation and somatic cell reprogramming in DIDO3 mutants with altered RNA processing and increased R-loop levels.
Fütterer A, Talavera-Gutiérrez A, Pons T, de Celis J, Gutiérrez J, Domínguez Plaza V, Martínez-A C
Cell death & disease 2021 Jun 21;12(7):637
Cell death & disease 2021 Jun 21;12(7):637
Cell-type-specific profiling of human cellular models of fragile X syndrome reveal PI3K-dependent defects in translation and neurogenesis.
Raj N, McEachin ZT, Harousseau W, Zhou Y, Zhang F, Merritt-Garza ME, Taliaferro JM, Kalinowska M, Marro SG, Hales CM, Berry-Kravis E, Wolf-Ochoa MW, Martinez-Cerdeño V, Wernig M, Chen L, Klann E, Warren ST, Jin P, Wen Z, Bassell GJ
Cell reports 2021 Apr 13;35(2):108991
Cell reports 2021 Apr 13;35(2):108991
Differentiation of Human Mesenchymal Stem Cells from Wharton's Jelly Towards Neural Stem Cells Using A Feasible and Repeatable Protocol.
Kruminis-Kaszkiel E, Osowski A, Bejer-Oleńska E, Dziekoński M, Wojtkiewicz J
Cells 2020 Mar 17;9(3)
Cells 2020 Mar 17;9(3)
miR-590-3p and Its Downstream Target Genes in HCC Cell Lines.
Elfar M, Amleh A
Analytical cellular pathology (Amsterdam) 2019;2019:3234812
Analytical cellular pathology (Amsterdam) 2019;2019:3234812
Generation and characterization of a human iPSC line (UAMi004-A) from a patient with propionic acidemia due to defects in the PCCB gene.
López-Márquez A, Alonso-Barroso E, Cerro-Tello G, Bravo-Alonso I, Arribas-Carreira L, Briso-Montiano Á, Navarrete R, Pérez-Cerdá C, Ugarte M, Pérez B, Desviat LR, Richard E
Stem cell research 2019 Jul;38:101469
Stem cell research 2019 Jul;38:101469
Altered transcriptional regulatory proteins in glioblastoma and YBX1 as a potential regulator of tumor invasion.
Gupta MK, Polisetty RV, Sharma R, Ganesh RA, Gowda H, Purohit AK, Ankathi P, Prasad K, Mariswamappa K, Lakshmikantha A, Uppin MS, Sundaram C, Gautam P, Sirdeshmukh R
Scientific reports 2019 Jul 29;9(1):10986
Scientific reports 2019 Jul 29;9(1):10986
Generation of two transgene-free human iPSC lines from CD133(+) cord blood cells.
Arellano-Viera E, Zabaleta L, Castaño J, Azkona G, Carvajal-Vergara X, Giorgetti A
Stem cell research 2019 Apr;36:101410
Stem cell research 2019 Apr;36:101410
Dynamic intercellular transport modulates the spatial patterning of differentiation during early neural commitment.
Glen CM, McDevitt TC, Kemp ML
Nature communications 2018 Oct 5;9(1):4111
Nature communications 2018 Oct 5;9(1):4111
Comprehensive characterization of chorionic villi-derived mesenchymal stromal cells from human placenta.
Ventura Ferreira MS, Bienert M, Müller K, Rath B, Goecke T, Opländer C, Braunschweig T, Mela P, Brümmendorf TH, Beier F, Neuss S
Stem cell research & therapy 2018 Feb 5;9(1):28
Stem cell research & therapy 2018 Feb 5;9(1):28
bFGF-mediated pluripotency maintenance in human induced pluripotent stem cells is associated with NRAS-MAPK signaling.
Haghighi F, Dahlmann J, Nakhaei-Rad S, Lang A, Kutschka I, Zenker M, Kensah G, Piekorz RP, Ahmadian MR
Cell communication and signaling : CCS 2018 Dec 5;16(1):96
Cell communication and signaling : CCS 2018 Dec 5;16(1):96
SETD7 Regulates the Differentiation of Human Embryonic Stem Cells.
Castaño J, Morera C, Sesé B, Boue S, Bonet-Costa C, Martí M, Roque A, Jordan A, Barrero MJ
PloS one 2016;11(2):e0149502
PloS one 2016;11(2):e0149502
Expansion and differentiation of germline-derived pluripotent stem cells on biomaterials.
Hoss M, Šarić T, Denecke B, Peinkofer G, Bovi M, Groll J, Ko K, Salber J, Halbach M, Schöler HR, Zenke M, Neuss S
Tissue engineering. Part A 2013 May;19(9-10):1067-80
Tissue engineering. Part A 2013 May;19(9-10):1067-80
Characterization of pluripotent stem cells.
Martí M, Mulero L, Pardo C, Morera C, Carrió M, Laricchia-Robbio L, Esteban CR, Izpisua Belmonte JC
Nature protocols 2013 Feb;8(2):223-53
Nature protocols 2013 Feb;8(2):223-53
Human stem/progenitor cells from bone marrow enhance glial differentiation of rat neural stem cells: a role for transforming growth factor β and Notch signaling.
Robinson AP, Foraker JE, Ylostalo J, Prockop DJ
Stem cells and development 2011 Feb;20(2):289-300
Stem cells and development 2011 Feb;20(2):289-300
No comments: Submit comment
Supportive validation
- Submitted by
- Invitrogen Antibodies (provider)
- Main image
- Experimental details
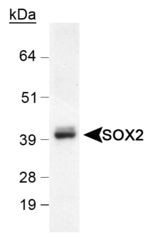
- Western Blot detection of SOX2 in mouse brain lysate using Product # PA1-16968 (0.5 µg/mL).

- Submitted by
- Invitrogen Antibodies (provider)
- Main image

- Experimental details
- Western blot analysis of SOX2 in mouse brain lysate. Samples were incubated in SOX2 polyclonal antibody (Product # PA1-16968) using a dilution of 0.5 µg/mL.

Supportive validation
- Submitted by
- Invitrogen Antibodies (provider)
- Main image

- Experimental details
- ICC staining of NTera2 cells using Product # PA1-16968 for SOX2 (Green) at a 1:50 dilution and an anti-alpha-Tubulin (Red) at a 1:1000 dilution. Nuclei (Blue) were counterstained using Hoechst 33258.

- Submitted by
- Invitrogen Antibodies (provider)
- Main image
- Experimental details
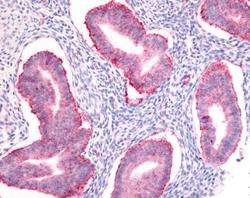
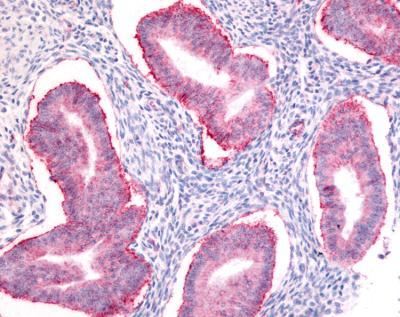
- Immunohistochemical analysis of SOX2 in human uterus, endometrial glands. Samples were incubated in SOX2 polyclonal antibody (Product # PA1-16968).
Supportive validation
- Submitted by
- Invitrogen Antibodies (provider)
- Main image

- Experimental details
- FACS staining of NTERA-2 cells using Product # PA1-16968 at a 1:50 dilution detected using Dylight-488 conjugated goat anti-rabbit IgG secondary antibody.

Supportive validation
- Submitted by
- Invitrogen Antibodies (provider)
- Main image

- Experimental details
- NULL

- Submitted by
- Invitrogen Antibodies (provider)
- Main image

- Experimental details
- NULL

- Submitted by
- Invitrogen Antibodies (provider)
- Main image

- Experimental details
- NULL

- Submitted by
- Invitrogen Antibodies (provider)
- Main image

- Experimental details
- Fig. 1 Loss of Oct4 and maintenance of Sox2 expression during retinoic acid-induced differentiation. Oct4 expression begins to decline after 24-hour exposure to retinoic acid (1 muM), with the main transition to an Oct4- state occurring between 24 and 48 h of RA treatment. After 72 h, ~ 70% of the population retain an Oct4-Sox2 + phenotype ( a , c ). A schematic depicting the change in gene expression in ESC populations towards the predominant progenitor state during two differentiation protocols: LIF-withdrawal in serum-containing media and retinoic acid addition ( b ). Quantification of flow cytometry data in a demonstrates the maintenance of the Oct4-Sox2 + state between 48 and 72 h of RA treatment ( c ), n = 9 (three biological replicates, three technical replicates for each biological replicate). Scale bar: 50 um

- Submitted by
- Invitrogen Antibodies (provider)
- Main image

- Experimental details
- Fig 1 SETD7 is expressed at very low levels in pluripotent human cells and induced during differentiation. (A) Average rank of the top 700 most differentially expressed genes between pluripotent (iPSCs or ESCs) and fibroblasts, including those upregulated in pluripotent cells (left panel) and upregulated in fibroblasts (right panel). (B) SETD7 mRNA levels in human ESCs grown under self-renewal conditions (UndES[4]), in vitro differentiated human ESCs (DifES[4]), human fibroblasts (HFF), two lines of human keratinocytes (HEK1 and HEK2) and two lines of iPSCs generated from keratinocytes ([H]KiPS4F and KiPS4F1). Mean and standard deviation of three technical replicates is shown. Induction of SETD7 mRNA levels during ES[4] differentiation was confirmed in more than four independent differentiation experiments. (C) Western blot showing SETD7 protein levels in pluripotent and somatic cells. Loading control beta actin (ACTB) is also shown. (D) Western blot showing protein levels of SETD7, AFP, OCT4 and SOX2 in under self-renewing conditions and in vitro differentiated human ESCs. Loading control alpha tubulin (TUBA) is also shown. One representative experiment out of three is shown. (E) Genomic visualization of the levels of H3K72me3, H3K4me3, H3K4me2, H3K36me3 and RNA polymerase II (Pol II) in the human embryonic stem cell line H1 around the SETD7 gene according to ENCODE. A non-methylated CpG island is depicted in green. (F) Levels of H3K4me2 and H3K27me3 at SETD7 gene promoter r

- Submitted by
- Invitrogen Antibodies (provider)
- Main image

- Experimental details
- Fig 3 The SETD7 knock-down causes defects in the silencing of pluripotency genes. (A) Western blot showing the levels of OCT4 at different days during the in vitro differentiation of ES[4] transduced with a non target shRNA (shSCR) and a shRNA that targets SETD7 (shSETD7) (B) Immunolocalization of SOX2 (green) and OCT4 (red) expression at day 4 and day 15 of in vitro differentiation of ES[4] transduced with a non target shRNA (shSCR) and a shRNA that targets SETD7 (shSETD7) (C) Quantification of the percentage of embryoid bodies negative or positive for OCT4 staining at day 4 and day 7 of differentiation of cells treated with vehicle (DMSO), 1muM or 5muM PFI-2. (D) Immunolocalization of OCT4 (red) in embryoid bodies at day 4 and day 7 of in vitro differentiation of ES[4] treated with vehicle (DMSO) or 5muM PFI-2.

- Submitted by
- Invitrogen Antibodies (provider)
- Main image

- Experimental details
- Fig. 1 Long-term maintenance of undifferentiated hiPSCs. a Confocal imaging showed the expression of pluripotency markers (OCT4, SOX2, NANOG and SSEA4) and the absence of differentiation markers GFAP and alpha-SMA as ectodermal and mesodermal markers, respectively. Cell nuclei were stained with DAPI (blue). Scale bars, 10 mum. b Flow cytometry confirmed expression of OCT4, SSEA4 and SOX2 in hiPSCs with more than 98% of positive cells. c qPCR analysis for undifferentiated stem cell markers ( POU5F1 , SOX2 and NANOG ) and early commitment to differentiation markers ( BRACHYURY , PAX6 and AFP ). GAPDH was used as an internal control. d Immunoblot analysis showing the specificity of antibodies and expression of markers. HeLa cells were used as negative control, HFF and astrocytes were used as positive control for alpha-SMA and GFAP, respectively

- Submitted by
- Invitrogen Antibodies (provider)
- Main image

- Experimental details
- Figure 3. Abnormal proliferation and altered cell-cycle distribution in FXS patient NPCs (A) Representative images of CTR and FXS NPCs stained for Ki67, pHH3, and DAPI. Scale bar, 50 mum. (B and C) High-content image analysis showed FXS patient NPCs have higher mitotic activity as evidenced by more pH3 and Ki67-positive cells normalized to total cells (Mann-Whitney test, **p < 0.01, ***p < 0.001, n = 4 CTR, 4 FXS NPCs, ~3,500 cells imaged per line). (D and E) Colorimetric ELISA shows greater BrdU incorporation in FXS patient NPCs and a FXS isogenic NPC line compared with controls (Mann-Whitney test, **p < 0.01, n = 3 CTR, 3 FXS NPCs, each data point represents an average of two replicates; unpaired t test, *p < 0.05, n = 3 experiments in isogenic control-disease NPC pair. (E) Representative bivariate dot plot for DNA content (FxCycle) and DNA synthesis (EdU). Gates for cells in G0/G1, S, and G2/M phases are indicated. (F) Cell cycle distribution of CTR and FXS NPCs after a 30-min EdU pulse demonstrates significant reduction of cells in G0/G1 and an increase of cells in the S phase. (Two-way ANOVA corrected for multiple comparisons using Holm-Sidak method, *adjusted p < 0.05, **adjusted p < 0.01, n = 3 CTR, 3 FXS NPCs.) (G) Representative images of CTR and FXS 3D organoids stained for proliferative markers Ki67 and SOX2. Scale bar, 50 mum. (H) Quantification of the proportion of Ki67 + SOX2 + cells in CTR and FXS organoids at day 28 shows increased actively proliferating cells

- Submitted by
- Invitrogen Antibodies (provider)
- Main image

- Experimental details
- Figure 1 Study design, characterization, and phenotypic properties of glioma cells. ( A ) Schematic diagram of the experimental approach ( B ) Immunofluorescence analysis of patient-derived glioma cells for stem cell markers Nestin and SOX-2, and lineage marker GFAP. ( C ) Bright-field microscopy images depicting the morphology of patient-derived glioma cells grown in 2D, GSCs, and 3D-GMH. ( D ) Quantification of spheroid formation efficiency of patient-derived cells on 3D-GMH (ANOVA, p-val = 7.6e-13) Scale bar--100 um.

- Submitted by
- Invitrogen Antibodies (provider)
- Main image

- Experimental details
- Figure 8 SOX2 mRNA and protein expression in HepG2 and SNU449 using RT-PCR and western blotting, respectively. (a) Graphical representation of SOX2 mRNA expression in HepG2 and SNU449 using RT-PCR. (b) Graphical representation of SOX2 protein expression using western blotting. RT-PCR and western blotting band intensities were measured using ImageJ and normalized against GAPDH and beta -tubulin, respectively, and statistically analyzed using Prism GraphPad. P values were computed using one-way ANOVA (with a Bonferroni posttest). P values less than 0.05 are considered significant ( * P value < 0.05, ** P value < 0.01, and *** P value < 0.001). Negatives were carried out for RT-PCR experiments. Results are a representation of three independent experiments.

- Submitted by
- Invitrogen Antibodies (provider)
- Main image

- Experimental details
- Figure 10 Expression and localization of hsa-miR-590-3p and SOX2 in SNU449 cells. (a) hsa-miR-590-3p signal in SNU449 cells under 20x magnification using ISH (red circle). (b) SOX2 fluorescent signal in SNU449 cells under 20x magnification using ICC (white circle). (c) DAPI staining of the nucleus. (d) Merged image of (b) and (c). (e) U6 signal SNU449 cells under 20x magnification using ISH as a positive control (red circles). (f) Negative control in SNU449 cells under 20x magnification using ISH using scrambled probes. Scale for (a)-(f): 20 mu m.

- Submitted by
- Invitrogen Antibodies (provider)
- Main image

- Experimental details
- Figure 11 Graphical representation of the expression of hsa-miR-590-3p and SOX2 in SNU449 cells. The cell fluorescence of SOX2 and the signal intensity of hsa-miR-590-3p were assessed using ImageJ and compared using Prism GraphPad. Low-expressing hsa-miR-590-3p cells show increased SOX2-corrected total cell fluorescence (CTCF) compared to high-expressing has-miR-590-3p cells, which show low SOX2 CTCF. Results are a representation of three independent experiments.

- Submitted by
- Invitrogen Antibodies (provider)
- Main image

- Experimental details
- Figure 7 Immunohistochemistry on tissue microarrays of GBM for YBX1 and its interacting proteins - EGFR, MAPK1, CD44, TNC, MMP13 and SOX2. IHC analysis of the proteins tested using in-house prepared tissue microarrays, confirmed overexpression of YBX1 and its interacting proteins in multiple tumor specimens. The details of tissue microarrays used and IHC procedure are described in the Methods and the staining scoring details are shown in Supplementary Table S11 .

- Submitted by
- Invitrogen Antibodies (provider)
- Main image

- Experimental details
- Figure 3 Immunophenotype characterization of the representative hWJ-NSCs sample. ( a ) Expression of Nestin and SOX1. P1 gated on the plot represents the cell population of neural stem and progenitor cells (Nestin+/SOX1+) comprising 96.1% of the total cells; ( b ) expression of Ki67 and SOX1. P2 gated on the plot represents the Ki67+/SOX1+ cell population comprising 93.3% of the total cells; ( c ) expression of DCX and nestin. P3 gated on the plot represents glia and neural stem and progenitor cells (Nestin+/DCX-) comprising 93.7% of the total cells; ( d ) expression of Ki67 and SOX2. P4 gated on the plot represents Ki67+/SOX1+ cells comprising 93.3% of the total cells; ( e ) expression of DCX and nestin. P3 gated on the plot represents glia and neural stem and progenitor cells (Nestin+/DCX-) comprising 94.8% of the total cells; ( f ) expression of CD44 and SOX1. P5 gated on the plot represents glial cells (CD44+/SOX1+) comprising 96% of the total cells; ( g ) expression of DCX and GFAP. P6 gated on the plot represents astrocytes (GFAP+/DCX-) comprising 32.9% of the total cells. P7 gated on the plot represents DCX+/GFAP- cell population comprising 1.67% of the total cells; ( h ) expression of CD44 and SOX1. P5 gated on the plot represents glial cells (CD44+/SOX1+) comprising 99% of the total cells; U--unstained cell population gated on all plots. SOX1--sex-determining region Y (SRY) box 1; SOX2--sex-determining region Y (SRY) box 2; GFAP--glial fibrillary acidic protein; DCX-

- Submitted by
- Invitrogen Antibodies (provider)
- Main image

- Experimental details
- Figure 4 Immunofluorescence analysis of hWJ-MSCs vs. hWJ-NSCs. Comparison of expression of several markers: ( a ') expression of CD45 (red) in hWJ-NSCs compared to ( a ) expression of CD45 (red) in hWJ-MSCs; ( b ') expression of CD90 (red) in hWJ-NSCs compared to ( b ) expression of CD90 (red) in hWJ-MSCs; ( c ') expression of Ki67 (green) in hWJ-NSCs compared to ( c ) expression of Ki67 (green) in hWJ-MSCs; ( d ') expression of nestin (green) in hWJ-NSCs compared to ( d ) expression of nestin (green) in hWJ-MSCs; ( e ') expression of SOX2 (red) in hWJ-NSCs compared to ( e ) expression of SOX2 (red) in hWJ-MSCs; ( f ') expression of GFAP (red) in hWJ-NSCs compared to ( f ) expression of GFAP (red) in hWJ-MSCs; ( g ') expression of MAP2 (green) in hWJ-NSCs compared to ( g ) expression of MAP2 (green) in hWJ-MSCs; ( h ') expression of S100beta (green) in hWJ-NSCs compared to ( h ) expression of S100beta (green) in hWJ-MSCs; Cell nuclei counterstained with Hoechst (blue); Scale bar = 100 µm. hWJ-MSCs--human Wharton's jelly derived mesenchymal stem cells; hWJ-NSCs--human Wharton's jelly derived neural stem cells; SOX2--sex-determining region Y (SRY) box 2; GFAP--glial fibrillary acidic protein; MAP2--microtubule-associated protein 2; S100beta--S100 calcium-binding protein beta; Ki67--proliferation marker.

- Submitted by
- Invitrogen Antibodies (provider)
- Main image

- Experimental details
- Figure 5 Immunofluorescence analysis of differentiated cells (hWJ-NSCs). ( a ) Co-expression of SOX2 (red) and nestin (green); ( b ) co-expression of GFAP (red) and nestin (green), neurosphere-like structure (white arrow); ( c ) co-expression of GFAP (red) and S100beta (green); ( d ) co-expression of SOX2 (red) and MAP2 (green). Cell nuclei counterstained with Hoechst (blue). Scale bar = 100 µm. hWJ-MSCs--human Wharton's jelly derived mesenchymal stem cells; hWJ-NSCs--human Wharton's jelly derived neural stem cells; SOX2--sex-determining region Y (SRY) box 2; GFAP--glial fibrillary acidic protein; MAP2--microtubule-associated protein 2; S100beta--S100 calcium-binding protein beta.
