 Explore
 Validate
 Learn
LearnMA5-15880
antibody from Invitrogen Antibodies
Targeting: AIFM1
AIF, AUNX1, CMTX4, DFNX5, NAMSD, PDCD8
 Western blot
 Immunocytochemistry
Antibody data
- Antibody Data
- Antigen structure
- References [5]
- Comments [0]
- Validations
- Immunocytochemistry [5]
- Flow cytometry [1]
- Other assay [8]
Submit
Validation data
Reference
Comment
Report error
- Product number
- MA5-15880 - Provider product page

- Provider
- Invitrogen Antibodies
- Product name
- AIF Monoclonal Antibody (4E7E11)
- Antibody type
- Monoclonal
- Antigen
- Purifed from natural sources
- Description
- MA5-15880 targets AIF in FACS, IF, IHC, and WB applications and shows reactivity with Human, mouse, Non-human primate, and Rat samples. The MA5-15880 immunogen is purified recombinant fragment of human AIF expressed in E. Coli. . MA5-15880 detects AIF which has a predicted molecular weight of approximately 67kDa.
- Reactivity
- Human, Mouse, Rat
- Host
- Mouse
- Isotype
- IgG
- Antibody clone number
- 4E7E11
- Vial size
- 100 μg
- Concentration
- 1 mg/mL
- Storage
- Store at 4°C short term. For long term storage, store at -20°C, avoiding freeze/thaw cycles.
Submitted references Apoptosis-Inducing Factor, Protein Expression, and Apoptosis Changes with Glutamine in Podocytes Cells Exposed with Cisplatin.
Utility and Mechanism of SHetA2 and Paclitaxel for Treatment of Endometrial Cancer.
Decreased expression of apoptosis-inducing factor in renal cell carcinoma is associated with poor prognosis and reduced postoperative survival.
New protein-protein interactions of mitochondrial connexin 43 in mouse heart.
From ventriculomegaly to severe muscular atrophy: expansion of the clinical spectrum related to mutations in AIFM1.
Susilo I, Maulida H, Alimsardjono L, Fauziah D, Pertiwi H
Veterinary medicine international 2021;2021:5599452
Veterinary medicine international 2021;2021:5599452
Utility and Mechanism of SHetA2 and Paclitaxel for Treatment of Endometrial Cancer.
Chandra V, Rai R, Benbrook DM
Cancers 2021 May 12;13(10)
Cancers 2021 May 12;13(10)
Decreased expression of apoptosis-inducing factor in renal cell carcinoma is associated with poor prognosis and reduced postoperative survival.
Wang Z, Yuan C, Huang Y, Liu Z, Yu X, Lv C, Su Z
Oncology letters 2019 Sep;18(3):2805-2812
Oncology letters 2019 Sep;18(3):2805-2812
New protein-protein interactions of mitochondrial connexin 43 in mouse heart.
Denuc A, Núñez E, Calvo E, Loureiro M, Miro-Casas E, Guarás A, Vázquez J, Garcia-Dorado D
Journal of cellular and molecular medicine 2016 May;20(5):794-803
Journal of cellular and molecular medicine 2016 May;20(5):794-803
From ventriculomegaly to severe muscular atrophy: expansion of the clinical spectrum related to mutations in AIFM1.
Kettwig M, Schubach M, Zimmermann FA, Klinge L, Mayr JA, Biskup S, Sperl W, Gärtner J, Huppke P
Mitochondrion 2015 Mar;21:12-8
Mitochondrion 2015 Mar;21:12-8
No comments: Submit comment
Supportive validation
- Submitted by
- Invitrogen Antibodies (provider)
- Main image
- Experimental details
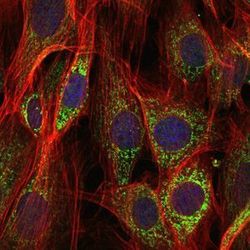
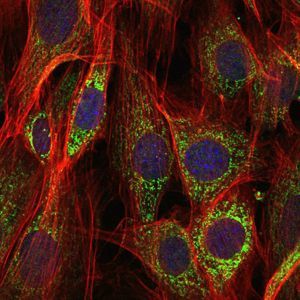
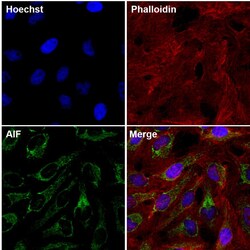
- Immunofluorescence analysis of NIH/3T3 cells using AIF monoclonal antibody (Product # MA5-15880) (Green). Blue: DRAQ5 fluorescent DNA dye. Red: actin filaments have been labeled with phalloidin.
- Submitted by
- Invitrogen Antibodies (provider)
- Main image

- Experimental details
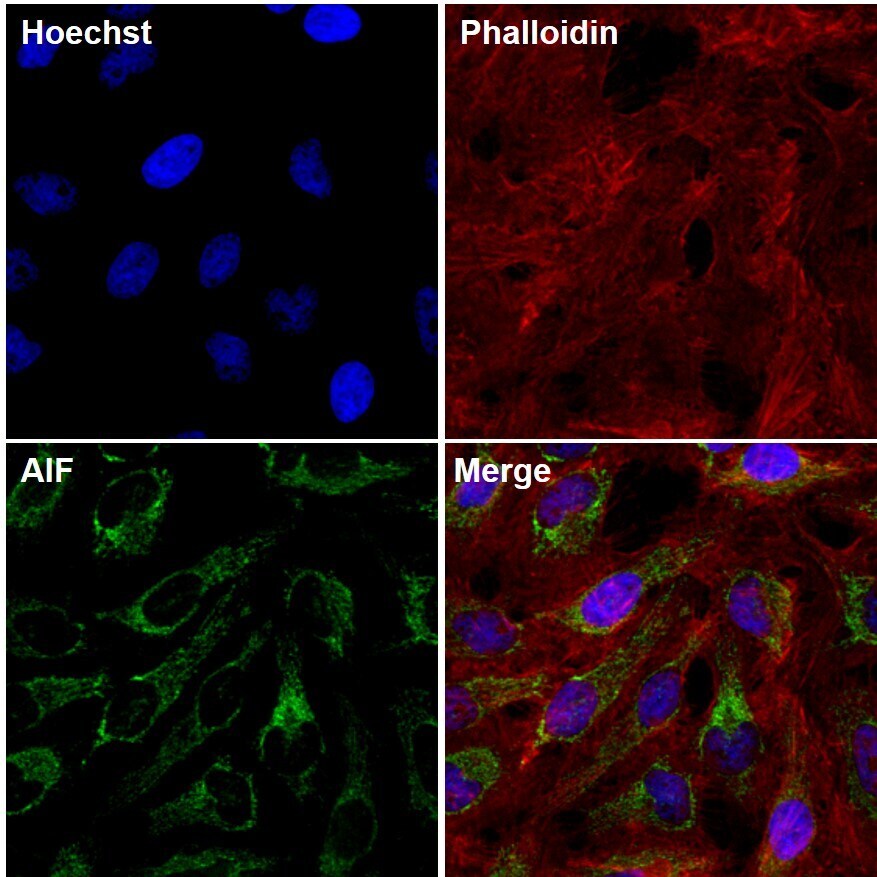
- Immunofluorescent analysis of AIF (green) in HeLa cells. The cells were fixed with 4% paraformaldehyde for 15 minutes at -20°C, permeabilized with 0.1% Triton X-100 for 15 minutes, and blocked with 3% BSA for 30 minutes at room temperature. Cells were stained with a AIF mouse monoclonal antibody (Product # MA5-15880) at a concentration of 20 µg/mL in blocking buffer overnight at 4°C , and then incubated with a Goat anti-Mouse IgG (H+L) Secondary Antibody, Alexa Fluor Plus 488 conjugate (Product # A32723) at a dilution of 1:500 for at least 30 minutes at a room temperature in the dark (green). F-actin (red) was stained with Dylight 554 Phalloidin. Nuclei (blue) were stained with Hoechst 33342 (Product # 62249). Images were taken on a Thermo Scientific ToxInsight Instrument at 20X magnification.
- Submitted by
- Invitrogen Antibodies (provider)
- Main image

- Experimental details
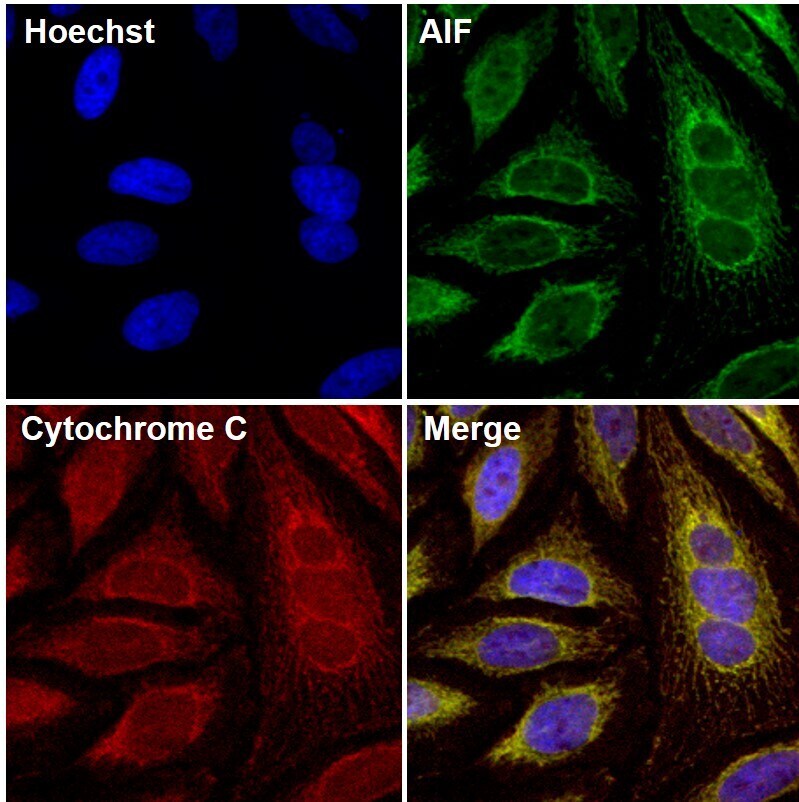
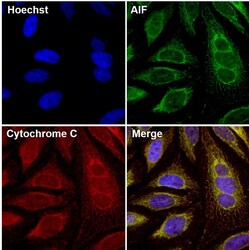
- Immunofluorescent analysis of Cytochrome C (red) in HeLa cells. The cells were fixed with 4% paraformaldehyde for 15 minutes at -20°C, permeabilized with 0.1% Triton X-100 for 15 minutes, and blocked with 3% BSA for 30 minutes at room temperature. Cells were stained with a Cytochrome C monoclonal antibody, Alexa Fluor 647 conjugate (Product # MA3-38200-A647) at a dilution of 10 µg/mL in blocking buffer for 1 hour at room temperature protected from light. Cells were then stained with a AIF mouse monoclonal antibody (Product # MA5-15880) at a concentration of 20 µg/mL in blocking buffer overnight at 4°C, then incubated with Goat anti-Mouse IgG (H+L) Secondary Antibody, Alexa Fluor Plus 488 conjugate (Product # A32723) at a dilution of 1:500 for at least 30 minutes at a room temperature in the dark (green). Nuclei (blue) were stained with Hoechst 33342 (Product # 62249). Images were taken on a Thermo Scientific ToxInsight Instrument at 20X magnification.
- Submitted by
- Invitrogen Antibodies (provider)
- Main image
- Experimental details
- Immunofluorescent analysis of AIF (green) in HeLa cells. The cells were fixed with 4% paraformaldehyde for 15 minutes at -20°C, permeabilized with 0.1% Triton X-100 for 15 minutes, and blocked with 3% BSA for 30 minutes at room temperature. Cells were stained with a AIF mouse monoclonal antibody (Product # MA5-15880) at a concentration of 20 µg/mL in blocking buffer overnight at 4°C , and then incubated with a Goat anti-Mouse IgG (H+L) Secondary Antibody, Alexa Fluor Plus 488 conjugate (Product # A32723) at a dilution of 1:500 for at least 30 minutes at a room temperature in the dark (green). F-actin (red) was stained with Dylight 554 Phalloidin. Nuclei (blue) were stained with Hoechst 33342 (Product # 62249). Images were taken on a Thermo Scientific ToxInsight Instrument at 20X magnification.

- Submitted by
- Invitrogen Antibodies (provider)
- Main image
- Experimental details
- Immunofluorescent analysis of Cytochrome C (red) in HeLa cells. The cells were fixed with 4% paraformaldehyde for 15 minutes at -20°C, permeabilized with 0.1% Triton X-100 for 15 minutes, and blocked with 3% BSA for 30 minutes at room temperature. Cells were stained with a Cytochrome C monoclonal antibody, Alexa Fluor 647 conjugate (Product # MA3-38200-A647) at a dilution of 10 µg/mL in blocking buffer for 1 hour at room temperature protected from light. Cells were then stained with a AIF mouse monoclonal antibody (Product # MA5-15880) at a concentration of 20 µg/mL in blocking buffer overnight at 4°C, then incubated with Goat anti-Mouse IgG (H+L) Secondary Antibody, Alexa Fluor Plus 488 conjugate (Product # A32723) at a dilution of 1:500 for at least 30 minutes at a room temperature in the dark (green). Nuclei (blue) were stained with Hoechst 33342 (Product # 62249). Images were taken on a Thermo Scientific ToxInsight Instrument at 20X magnification.

Supportive validation
- Submitted by
- Invitrogen Antibodies (provider)
- Main image
- Experimental details
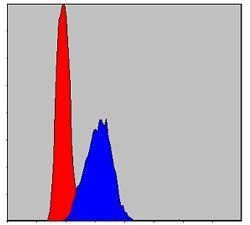
- Flow cytometric analysis of HepG2 cells using AIF monoclonal antibody (Product # MA5-15880) (blue) and negative control (red).

Supportive validation
- Submitted by
- Invitrogen Antibodies (provider)
- Main image

- Experimental details
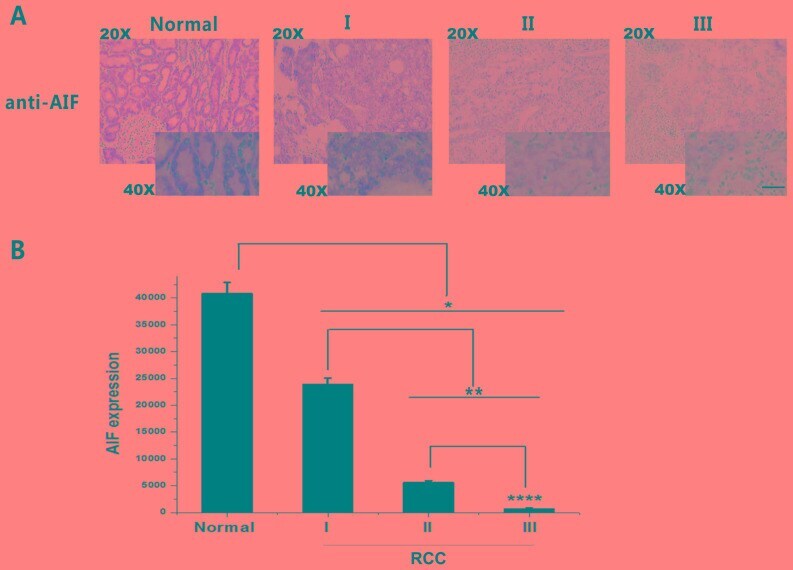
- Figure 3. AIF expression in RCC grades I, II and III and adjacent normal tissue. (A) IHC staining of AIF (brown) revealed a decrease in AIF expression with tumor grade. (B) Quantification of AIF expression in RCC grades I, II and III. AIF expression was significantly decreased in RCC tissues compared with that in adjacent normal tissues. *P

- Submitted by
- Invitrogen Antibodies (provider)
- Main image
- Experimental details
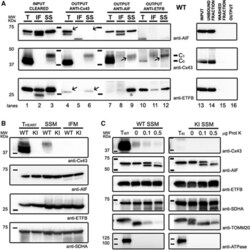
- Figure 1 Western Blot analysis of protein co-immunoprecipitation and mitochondrial distribution of Cx43, ETFB and AIF in WT and Cx43 KIC x32 mice. ( A ) A total amount of 1 mg of heart mitochondrial protein extracts from WT mice was immunoprecipitated using anti-Cx43, anti- AIF and anti- ETFB antibodies. In left panels, lanes from 1 to 3 correspond to the input sample, the initial total (T), subsarcolemmal ( SSM ) or interfibrillar ( IFM ) protein extracts. Lanes from 4 to 12 correspond to the output sample--the immunoprecipitated fraction--analysed for the presence of each protein. A representative IgG control of Cx43- IP protocol is shown in right panels using the total protein extract as a sample. Of note, the Cx43 antibody used recognizes also the phosphorylated protein forms (C 0 unmodified, C 1 phosphorylated). Also, due to proteinase treatment to obtain the IFM fraction, AIF is partially truncated and noted as a double lower molecular weight band. ( B ) Protein content of Cx43, AIF and ETFB . Anti- SDHA was used as a mitochondrial loading control. ( C ) Sub-mitochondrial distribution of Cx43, AIF and ETFB proteins was examined after partial digestion of the outer mitochondrial membrane with 0.1 and 0.5 mug of proteinase K, as indicated. Na + /K + ATP ase reactivity was assessed to rule out any potential contamination from gap-junctional membranes, and SDHA and TOMM 20 were used as an inner and outer mitochondrial membrane protein control, respectively. A representative

- Submitted by
- Invitrogen Antibodies (provider)
- Main image
- Experimental details
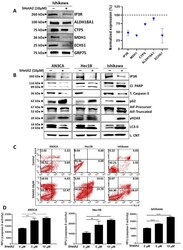
- Figure 4 Molecular mechanism of SHetA2: ( A ) Ishikawa cells were treated with SHetA2 (10 uM) for 4 h and co-immunoprecipitation was performed with mortalin antibody (Grp75)-tagged beads. Western blots (left panel) and densitometry analyses (right panel) was performed for IP3R, ALDH18A1, CTPS, MDH1, and ECHS1 to confirm the reduction of client protein co-immunoprecipitation. ( B ) Western blot analysis for the protein expression of IP3R, Cl. PARP, total caspase-3, P62, AIF, DNA damage marker (gammaH2AX) and LC3-II proteins in endometrial cancer cells treated with, or without, SHetA2 (10 uM) for 24 h. ( C ) Cell apoptosis was detected by Annexin-V/PI combined labeling with flow cytometry in endometrial cancer cells 24 h after treatment with SHetA2 (10 uM) or vehicle. ( D ) Caspase-3 activity assay for endometrial cancer cells treated with indicated dose of SHetA2 for 24 h. ** p

- Submitted by
- Invitrogen Antibodies (provider)
- Main image
- Experimental details
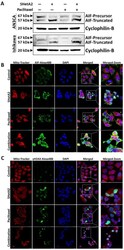
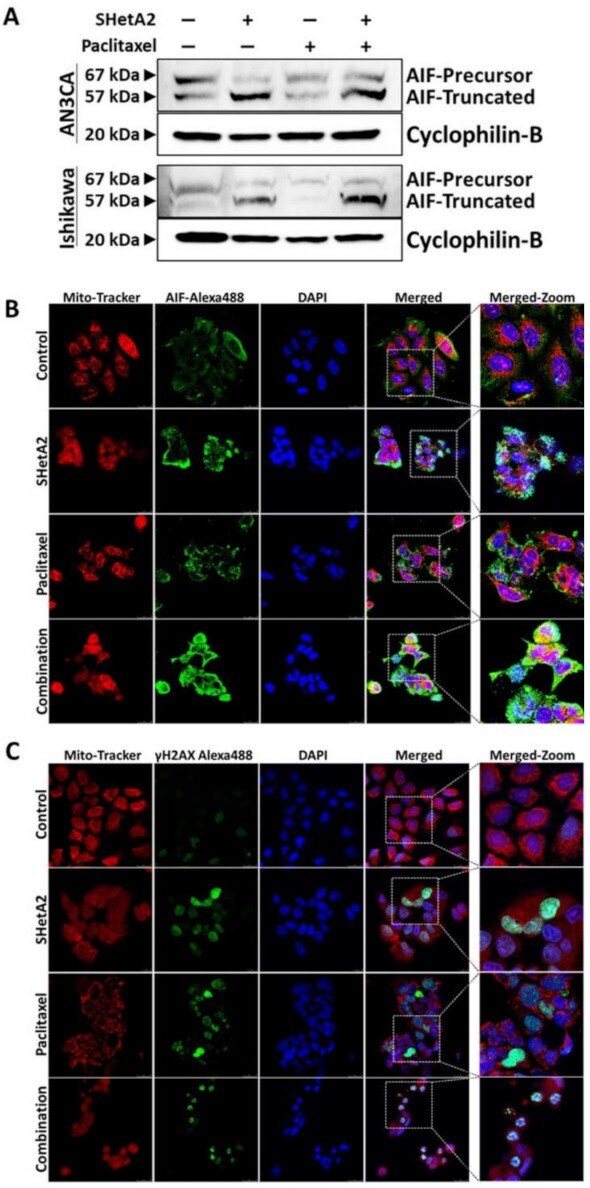
- Figure 6 SHetA2 induces nuclear translocation of AIF, while both SHetA2 and paclitaxel induce DNA damage: ( A ) Western blot analysis for AIF expression in AN3CA and Ishikawa cells treated with SHetA2 or paclitaxel or their combination. ( B , C ) Representative immunofluorescence images for Mitotracker (red) and AIF (Green, B ), or gammaH2AX ( C ) show their localization in AN3CA and Ishikawa cells treated with SHetA2 or paclitaxel or their combination. DAPI (Blue) staining was used as nuclear stain. Representative images taken at 63x magnification are shown. The left-most panels represent enlarged pictures of the square boxes shown in merged image.
- Submitted by
- Invitrogen Antibodies (provider)
- Main image
- Experimental details
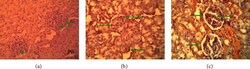
- Figure 2 Morphology of the glomerular epithelial cells given anti-AIF antibodies. (a) P0 is the control, in which the mouse's kidney is not treated. (b) P1 is the kidney of mouse given cisplatin i.p on the 7th day. (c) P2 is the kidney of mouse injected with glutamine i.v 7 days in a row before being injected with cisplatin i.p on the 7th day. Positive if the cytoplasm and nucleus are colored brown.

- Submitted by
- Invitrogen Antibodies (provider)
- Main image
- Experimental details
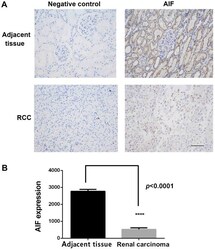
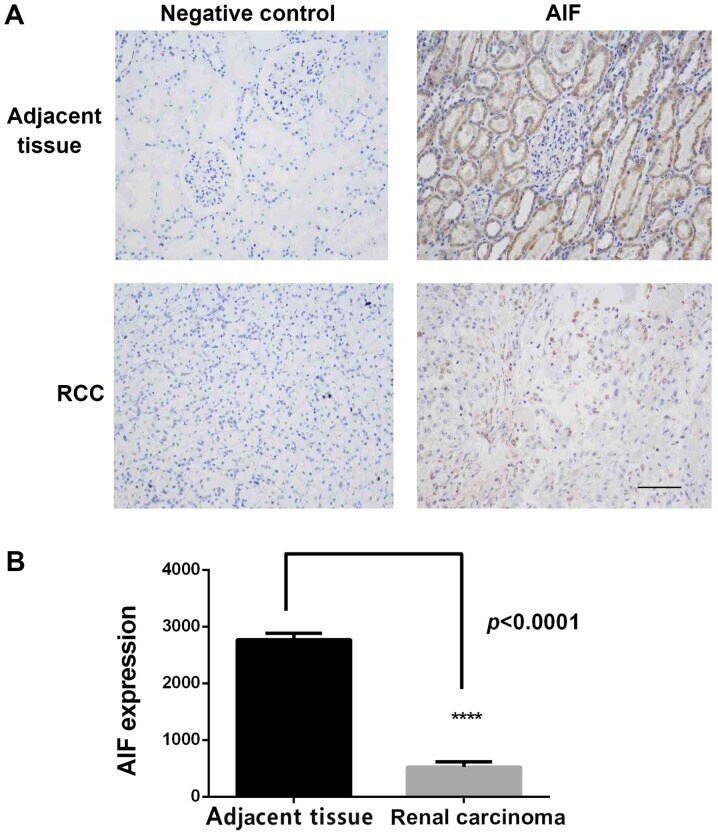
- Figure 1. AIF expression in RCC and adjacent normal tissues. (A) IHC staining of AIF expression in RCC and adjacent tissues. Strong staining of AIF was observed in normal kidney sections compared with weak staining in the adjacent tissues. (B) Quantification of AIF staining in IHC images of RCC and adjacent normal tissues. AIF expression was significantly decreased in RCC tissues. ****P
- Submitted by
- Invitrogen Antibodies (provider)
- Main image

- Experimental details
- Figure 3. AIF expression in RCC grades I, II and III and adjacent normal tissue. (A) IHC staining of AIF (brown) revealed a decrease in AIF expression with tumor grade. (B) Quantification of AIF expression in RCC grades I, II and III. AIF expression was significantly decreased in RCC tissues compared with that in adjacent normal tissues. *P
- Submitted by
- Invitrogen Antibodies (provider)
- Main image
- Experimental details
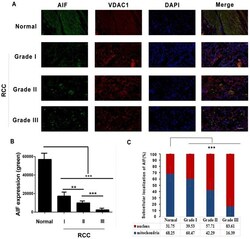
- Figure 4. Subcellular localization of AIF in RCC cells. (A) Immunofluorescence staining of RCC grades I, II and III and adjacent normal tissue with antibodies against AIF (green), VDAC1 (red; mitochondrial marker) and with DAPI (blue; nuclear stain). (B) Quantification of AIF expression in RCC and adjacent normal tissue. (C) Quantification of AIF staining in mitochondrial and nuclear subcellular compartments in RCC grades I, II and III and adjacent normal tissue. **P
