Explore
 Validate
 Learn
Learn Western blot
 Immunocytochemistry
Antibody data
- Antibody Data
- Antigen structure
- References [14]
- Comments [0]
- Validations
- Immunocytochemistry [2]
- Immunoprecipitation [1]
- Flow cytometry [1]
- Other assay [9]
Submit
Validation data
Reference
Comment
Report error
- Product number
- PA1-064 - Provider product page

- Provider
- Invitrogen Antibodies
- Product name
- Caveolin 1 Polyclonal Antibody
- Antibody type
- Polyclonal
- Antigen
- Synthetic peptide
- Description
- PA1-064 detects caveolin 1 from human, canine, hamster, mouse, and rat tissues and cells. PA1-064 has been successfully used in Western blot and immunoprecipitation procedures. By Western blot, this antibody detects an ~22 kDa protein representing caveolin 1 from rat heart protein extract. The PA1-064 immunogen is a synthetic peptide corresponding to residues M(1) S G G K Y V D S E G H L Y T V P(17) C of human CAV1. This sequence is completely conserved between human, mouse, canine, bovine, and rat. The PA1-064 immunizing peptide (Cat. # PEP-146) is available for use in neutralization and control experiments.
- Reactivity
- Human, Mouse, Rat, Canine, Hamster
- Host
- Rabbit
- Isotype
- IgG
- Vial size
- 100 μg
- Concentration
- 1 mg/mL
- Storage
- -20°C, Avoid Freeze/Thaw Cycles
Submitted references Compression enhances invasive phenotype and matrix degradation of breast Cancer cells via Piezo1 activation.
Involvement of the TGF-β1 pathway in caveolin-1-associated regulation of head and neck tumor cell metastasis.
Occludin, caveolin-1, and Alix form a multi-protein complex and regulate HIV-1 infection of brain pericytes.
Energetic costs regulated by cell mechanics and confinement are predictive of migration path during decision-making.
Aroclor1254 disrupts the blood-testis barrier by promoting endocytosis and degradation of junction proteins via p38 MAPK pathway.
Colocalization of androgen binding protein, oxytocin receptor, caveolin 1 and proliferation marker p21 in benign prostate hyperplasia.
Expression of sex hormone-binding globulin, oxytocin receptor, caveolin-1 and p21 in leiomyoma.
Changing caveolin-1 and oxytocin receptor distribution in the ageing human prostate.
Signaling proteins in raft-like microdomains are essential for Ca2+ wave propagation in glial cells.
Isolation of lipid droplets from cells by density gradient centrifugation.
A high-fat, refined-carbohydrate diet induces endothelial dysfunction and oxidant/antioxidant imbalance and depresses NOS protein expression.
Effects of chronic renal failure on caveolin-1, guanylate cyclase and AKT protein expression.
Decreased liver fatty acid binding capacity and altered liver lipid distribution in mice lacking the liver fatty acid-binding protein gene.
Cell-specific targeting of caveolin-1 to caveolae, secretory vesicles, cytoplasm or mitochondria.
Luo M, Cai G, Ho KKY, Wen K, Tong Z, Deng L, Liu AP
BMC molecular and cell biology 2022 Jan 3;23(1):1
BMC molecular and cell biology 2022 Jan 3;23(1):1
Involvement of the TGF-β1 pathway in caveolin-1-associated regulation of head and neck tumor cell metastasis.
Sun J, Lu Y, Yu C, Xu T, Nie G, Miao B, Zhang X
Oncology letters 2020 Feb;19(2):1298-1304
Oncology letters 2020 Feb;19(2):1298-1304
Occludin, caveolin-1, and Alix form a multi-protein complex and regulate HIV-1 infection of brain pericytes.
Torices S, Roberts SA, Park M, Malhotra A, Toborek M
FASEB journal : official publication of the Federation of American Societies for Experimental Biology 2020 Dec;34(12):16319-16332
FASEB journal : official publication of the Federation of American Societies for Experimental Biology 2020 Dec;34(12):16319-16332
Energetic costs regulated by cell mechanics and confinement are predictive of migration path during decision-making.
Zanotelli MR, Rahman-Zaman A, VanderBurgh JA, Taufalele PV, Jain A, Erickson D, Bordeleau F, Reinhart-King CA
Nature communications 2019 Sep 13;10(1):4185
Nature communications 2019 Sep 13;10(1):4185
Aroclor1254 disrupts the blood-testis barrier by promoting endocytosis and degradation of junction proteins via p38 MAPK pathway.
Jia X, Xu Y, Wu W, Fan Y, Wang G, Zhang T, Su W
Cell death & disease 2017 May 25;8(5):e2823
Cell death & disease 2017 May 25;8(5):e2823
Colocalization of androgen binding protein, oxytocin receptor, caveolin 1 and proliferation marker p21 in benign prostate hyperplasia.
Sendemir E, Herbert Z, Sivukhina E, Zermann DH, Arnold R, Jirikowski GF
Anatomia, histologia, embryologia 2008 Oct;37(5):325-31
Anatomia, histologia, embryologia 2008 Oct;37(5):325-31
Expression of sex hormone-binding globulin, oxytocin receptor, caveolin-1 and p21 in leiomyoma.
Sendemir A, Sendemir E, Kosmehl H, Jirikowski GF
Gynecological endocrinology : the official journal of the International Society of Gynecological Endocrinology 2008 Feb;24(2):105-12
Gynecological endocrinology : the official journal of the International Society of Gynecological Endocrinology 2008 Feb;24(2):105-12
Changing caveolin-1 and oxytocin receptor distribution in the ageing human prostate.
Herbert Z, Bötticher G, Aschoff A, Sendemir E, Zermann DH, Arnold R, Mall G, Jirikowski GF
Anatomia, histologia, embryologia 2007 Oct;36(5):361-5
Anatomia, histologia, embryologia 2007 Oct;36(5):361-5
Signaling proteins in raft-like microdomains are essential for Ca2+ wave propagation in glial cells.
Weerth SH, Holtzclaw LA, Russell JT
Cell calcium 2007 Feb;41(2):155-67
Cell calcium 2007 Feb;41(2):155-67
Isolation of lipid droplets from cells by density gradient centrifugation.
Brasaemle DL, Wolins NE
Current protocols in cell biology 2006 Jan;Chapter 3:Unit 3.15
Current protocols in cell biology 2006 Jan;Chapter 3:Unit 3.15
A high-fat, refined-carbohydrate diet induces endothelial dysfunction and oxidant/antioxidant imbalance and depresses NOS protein expression.
Roberts CK, Barnard RJ, Sindhu RK, Jurczak M, Ehdaie A, Vaziri ND
Journal of applied physiology (Bethesda, Md. : 1985) 2005 Jan;98(1):203-10
Journal of applied physiology (Bethesda, Md. : 1985) 2005 Jan;98(1):203-10
Effects of chronic renal failure on caveolin-1, guanylate cyclase and AKT protein expression.
Sindhu RK, Ehdaie A, Vaziri ND, Roberts CK
Biochimica et biophysica acta 2004 Nov 5;1690(3):231-7
Biochimica et biophysica acta 2004 Nov 5;1690(3):231-7
Decreased liver fatty acid binding capacity and altered liver lipid distribution in mice lacking the liver fatty acid-binding protein gene.
Martin GG, Danneberg H, Kumar LS, Atshaves BP, Erol E, Bader M, Schroeder F, Binas B
The Journal of biological chemistry 2003 Jun 13;278(24):21429-38
The Journal of biological chemistry 2003 Jun 13;278(24):21429-38
Cell-specific targeting of caveolin-1 to caveolae, secretory vesicles, cytoplasm or mitochondria.
Li WP, Liu P, Pilcher BK, Anderson RG
Journal of cell science 2001 Apr;114(Pt 7):1397-408
Journal of cell science 2001 Apr;114(Pt 7):1397-408
No comments: Submit comment
Supportive validation
- Submitted by
- Invitrogen Antibodies (provider)
- Main image

- Experimental details
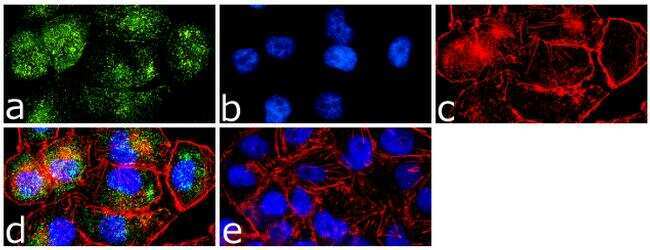
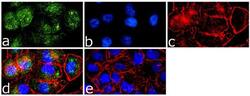
- Immunofluorescence analysis of Caveolin 1 was done on 70% confluent log phase A-375 cells. The cells were fixed with 4% paraformaldehyde for 15 minutes, permeabilized with 0.25% Triton™ X-100 for 10 minutes, and blocked with 5% BSA for 1 hour at room temperature. The cells were labeled with Caveolin 1 Rabbit Polyclonal Antibody (Product # PA1-064) at 1 µg/mL in 1% BSA and incubated for 3 hours at room temperature and then labeled with Goat anti-Rabbit IgG (H+L) Superclonal™ Secondary Antibody, Alexa Fluor® 488 conjugate (Product # A27034) at a dilution of 1:2000 for 45 minutes at room temperature (Panel a: green). Nuclei (Panel b: blue) were stained with SlowFade® Gold Antifade Mountant with DAPI (Product # S36938). F-actin (Panel c: red) was stained with Alexa Fluor® 555 Rhodamine Phalloidin (Product # R415, 1:300). Panel d is a merged image showing cytoplasmic localization. Panel e is a no primary antibody control. The images were captured at 60X magnification.
- Submitted by
- Invitrogen Antibodies (provider)
- Main image
- Experimental details
- Immunofluorescence analysis of Caveolin 1 was done on 70% confluent log phase A-375 cells. The cells were fixed with 4% paraformaldehyde for 15 minutes, permeabilized with 0.25% Triton™ X-100 for 10 minutes, and blocked with 5% BSA for 1 hour at room temperature. The cells were labeled with Caveolin 1 Rabbit Polyclonal Antibody (Product # PA1-064) at 1 µg/mL in 1% BSA and incubated for 3 hours at room temperature and then labeled with Goat anti-Rabbit IgG (Heavy Chain) Superclonal™ Secondary Antibody, Alexa Fluor® 488 conjugate (Product # A27034) at a dilution of 1:2000 for 45 minutes at room temperature (Panel a: green). Nuclei (Panel b: blue) were stained with SlowFade® Gold Antifade Mountant with DAPI (Product # S36938). F-actin (Panel c: red) was stained with Alexa Fluor® 555 Rhodamine Phalloidin (Product # R415, 1:300). Panel d is a merged image showing cytoplasmic localization. Panel e is a no primary antibody control. The images were captured at 60X magnification.

Supportive validation
- Submitted by
- Invitrogen Antibodies (provider)
- Main image

- Experimental details
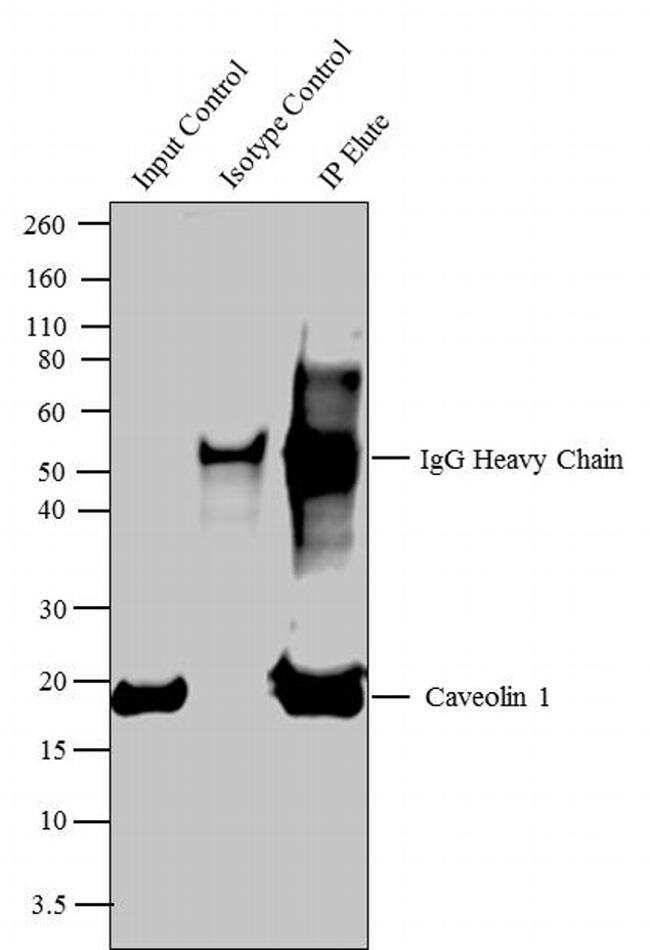
- Caveolin 1 was immunoprecipitated using 5 µg of the Caveolin 1 Rabbit Polyclonal Antibody (Product # PA1-064) from lysate of Mouse Heart (Lane 3) using the Dynabeads® Protein A Immunoprecipitation Kit (Product # 10006D). Normal Rabbit IgG was used as a Isotype control (Lane 2). 10 % input represents the cell extract used for immunoprecipitation (Lane 1). Western blot analysis was performed using Caveolin 1 Rabbit Polyclonal Antibody (Product # PA1-064) and Goat anti-Rabbit IgG (Heavy Chain) Superclonal™ Secondary Antibody, HRP conjugate (Product # A27036, 0.4 µg/mL, 1:2500 dilution). Chemiluminescent detection was performed using Pierce™ ECL Western Blotting Substrate (Product # 32106).

Supportive validation
- Submitted by
- Invitrogen Antibodies (provider)
- Main image
- Experimental details
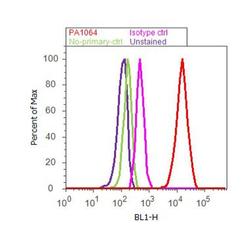
- Flow cytometry analysis of Caveolin 1 was done on U-87 MG cells. Cells were fixed with 70% ethanol for 10 minutes, permeabilized with 0.25% Triton™ X-100 for 20 minutes, and blocked with 5% BSA for 30 minutes at room temperature. Cells were labeled with Caveolin 1 Rabbit Polyclonal Antibody (PA1064, red histogram) or with rabbit isotype control (pink histogram) at 3-5 ug/million cells in 2.5% BSA. After incubation at room temperature for 2 hours, the cells were labeled with Alexa Fluor® 488 Goat Anti-Rabbit Secondary Antibody (A11008) at a dilution of 1:400 for 30 minutes at room temperature. The representative 10,000 cells were acquired and analyzed for each sample using an Attune® Acoustic Focusing Cytometer. The purple histogram represents unstained control cells and the green histogram represents no-primary-antibody control.

Supportive validation
- Submitted by
- Invitrogen Antibodies (provider)
- Main image

- Experimental details
- Caveolin 1 was immunoprecipitated using 5 µg of the Caveolin 1 Rabbit Polyclonal Antibody (Product # PA1-064) from lysate of Mouse Heart (Lane 3) using the Dynabeads® Protein A Immunoprecipitation Kit (Product # 10006D). Normal Rabbit IgG was used as a Isotype control (Lane 2). 10 % input represents the cell extract used for immunoprecipitation (Lane 1). Western blot analysis was performed using Caveolin 1 Rabbit Polyclonal Antibody (Product # PA1-064) and Goat anti-Rabbit IgG (H+L) Superclonal™ Secondary Antibody, HRP conjugate (Product # A27036, 0.4 µg/mL, 1:2500 dilution). Chemiluminescent detection was performed using Pierce™ ECL Western Blotting Substrate (Product # 32106).

- Submitted by
- Invitrogen Antibodies (provider)
- Main image

- Experimental details
- Caveolin 1 was immunoprecipitated using 5 æg of the Caveolin 1 Rabbit Polyclonal Antibody (Product # PA1-064) from lysate of Mouse Heart (Lane 3) using the Dynabeads® Protein A Immunoprecipitation Kit (Product # 10006D). Normal Rabbit IgG was used as a Isotype control (Lane 2). 10 % input represents the cell extract used for immunoprecipitation (Lane 1). Western blot analysis was performed using Caveolin 1 Rabbit Polyclonal Antibody (Product # PA1-064) and Goat anti-Rabbit IgG (H+L) Superclonal™ Secondary Antibody, HRP conjugate (Product # A27036, 0.4 æg/mL, 1:2500 dilution). Chemiluminescent detection was performed using Pierce™ ECL Western Blotting Substrate (Product # 32106).
- Submitted by
- Invitrogen Antibodies (provider)
- Main image
- Experimental details
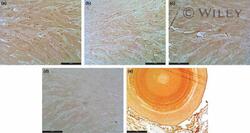
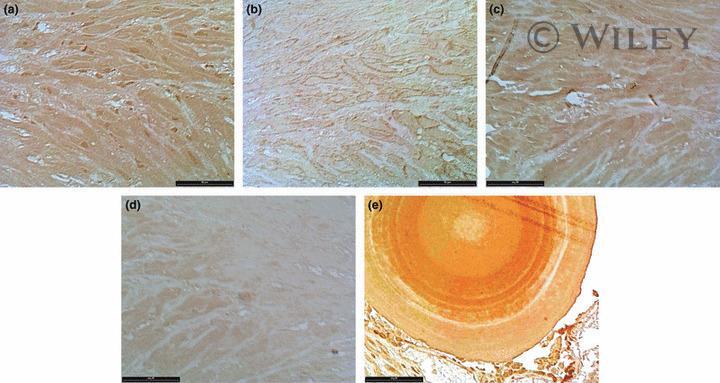
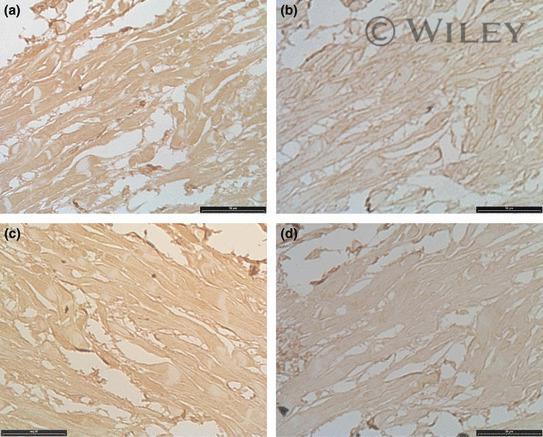
- 1 Prostate stroma of a BPH patient. Staining with anti-ABP (a), anti-Caveolin-1 (b), anti-Oxytocin receptor (c) or anti-p21 (d) antibodies, developed by DAB. Note the ABP immunoreactivity in a prostate stone (e). Serial semithin sections (1 mu m thick) of the prostate tissue. Scale bar indicates 10 mu m (a-d) and 100 mu m for (e).
- Submitted by
- Invitrogen Antibodies (provider)
- Main image
- Experimental details
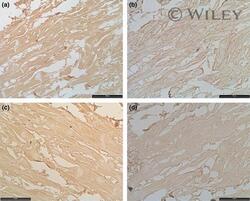
- 2 Serial semithin sections of a prostate control sample. Immunohistochemical staining with anti-ABP (a), anti-Caveolin-1 (b), anti-Oxytocin receptor (c) or anti-p21 (d) antibodies, developed by DAB. Scale bar indicates 10 mu m (a-d).
- Submitted by
- Invitrogen Antibodies (provider)
- Main image
- Experimental details
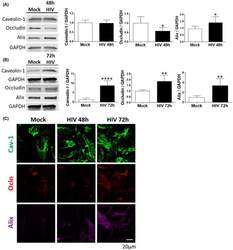
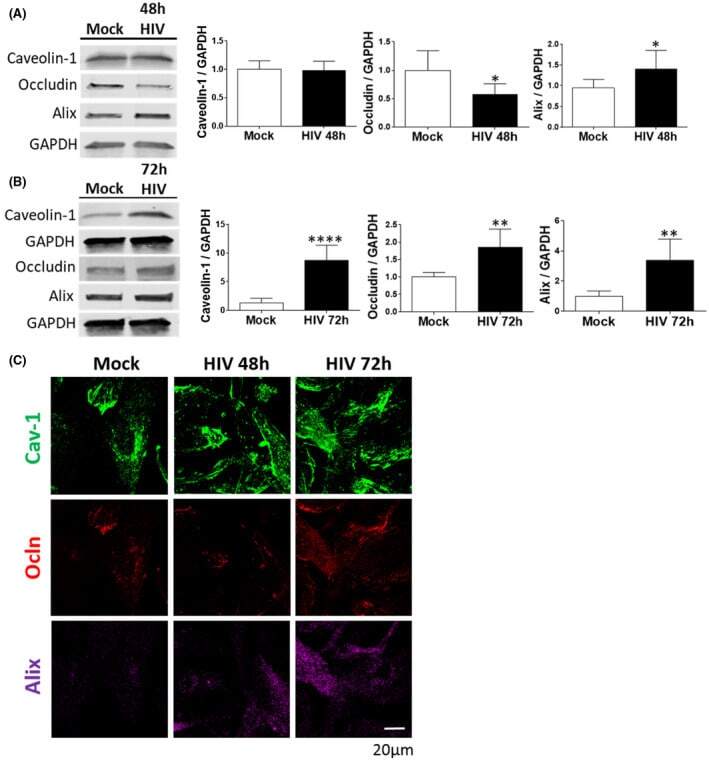
- FIGURE 1 HIV-1 infection alters cav-1, ocln, and Alix expression in brain pericytes. Pericytes were either mock-infected or infected with 60 ng/mL HIV-1 p24 for 48 h (A) or 72 h (B). The expression of cav-1, ocln, and Alix was evaluated by immunoblotting. GAPDH was used as a loading control. C, Representative immunostaining images of cav-1 (green), ocln (red), and Alix (purple) in mock-infected or HIV-1-infected for 48 or 72 h. Alix expression intensity was increased by the same factors in all groups to allow for better visualization. Graphs show the mean +- SD from three independent experiments. **** P < .0001, ** P = .003, * P < .0449, n = 4-9 per group; scale bars, 20 um
- Submitted by
- Invitrogen Antibodies (provider)
- Main image
- Experimental details
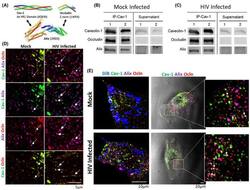
- FIGURE 2 Cav-1, ocln, and Alix form a stable complex in mock-infected and HIV-1-infected pericytes. A, Diagram illustrating Alix and its binding partners identified in this study in a structural ribbon representation. The ESCRT-associated protein Alix binds tyrosine motifs via its C-terminal Proline Rich Domain (PRD). Caveolae are made up of oligomers of cav-1 and cavin proteins, and the figure shows a trimeric coiled coil for Cavin4a HR1 domain. For ocln, the region shown is the cytoplasmic C-terminal region that is known to bind scaffolding proteins. Figure was prepared using PyMol with the listed PDB accession numbers. B-E, Pericytes were either mock-infected (B) or infected with HIV-1 (C) for 48 h as in Figure 1 . A total of 600 ug of cell lysate protein was incubated with cav-1 antibody for 24 h, followed by incubation with protein A/G PLUS-Agarose beads. Both immunoprecipitates and supernatants were analyzed by immunoblotting for the presence of cav-1, ocln, and Alix. D, Immunostaining of cav-1 (green), ocln (red), and Alix (purple) in mock-infected or HIV-1-infected for 48 h. E, Cellular localization of the cav-1, ocln, and Alix complex in mock-infected or HIV-1-infected for 48 h. Cell membranes are visualized by blue fluorescent dye DiB (left panel). Middle panel, the cav-1, ocln, and Alix complexes merged with a bright field image of a single pericyte. The images were analyzed as in Figure 1 ; n = 4 per group; scale bar 5, 10, or 20 um

- Submitted by
- Invitrogen Antibodies (provider)
- Main image

- Experimental details
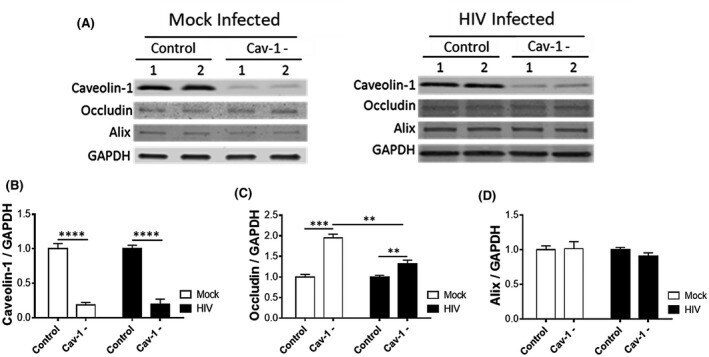
- FIGURE 3 HIV-1 infection attenuates cav-1-mediated regulation of ocln expression. Pericytes were transfected with 1 ug cav-1 siRNA per 10 6 cells and either mock-infected or HIV-1-infected with 60 ng/mL HIV-1 p24 for 48 h. The expression of cav-1, ocln, and Alix was evaluated by immunoblotting (A), quantified, and compared among groups. GAPDH was used as a loading control. Cav-1 silencing (B) resulted in upregulation of occludin levels in mock-infected pericytes and this effect was attenuated in HIV-1-infected pericytes (C). Cav-1 silencing did not affect Alix levels (D). Graphs indicate the mean +- SD from three independent experiments. **** P < .0001, *** P = .0002, ** P = .003, n = 4-9 per group
- Submitted by
- Invitrogen Antibodies (provider)
- Main image
- Experimental details
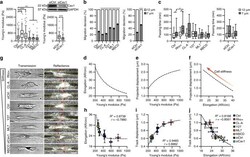
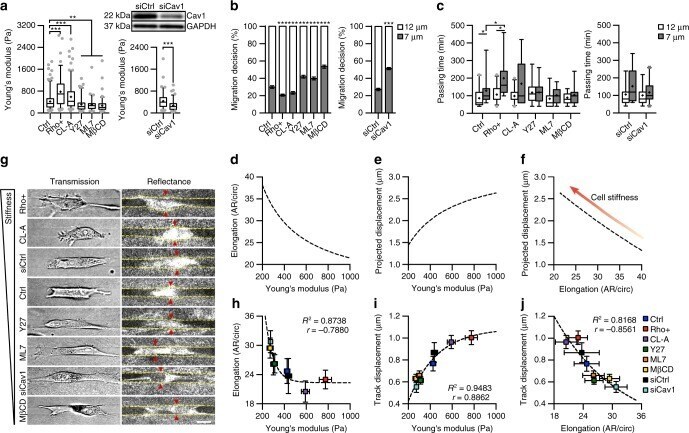
- Cell stiffness alters decision-making and cell mechanics during confined migration. a AFM measurements of cell stiffness following pharmacological treatments and siCav1 knockdown (n= 164, 95, 167, 91, 75, 85, 92, and 97 cells for Ctrl, Rho+, CL-A, Y27, ML7, MßCD, siCtrl, and siCav1) and western blot for Caveolin-1 following treatment with 25 nM Caveolin-1 siRNA. b, c Migration decision-making (b) and passing time into each branch (c) following treatments to alter cell stiffness (n= 30, 34, 30, 31, 30, 28, 33, and 39 cells for Ctrl, Rho+, CL-A, Y27, ML7, MßCD, siCtrl, and siCav1). d-f Model predictions for cell deformation (d), track displacement (e), and the inverse relationship between cell elongation and track displacement (f) in 7 µm tracks. g Transmitted light images showing cell morphology and confocal reflectance images of microtrack structure as well as cell-induced track displacement in 7 µm microtracks (yellow lines show microtrack walls; red arrowheads show areas of matrix displacement around the cell body). h-j Experimental averages of cell elongation (h), track displacement (i), and the relationship between cell remodeling and matrix displacement (j) in 7 µm microtracks as a function of cell stiffness (n= 118, 107, 100, 135, 109, 123, 53, and 58 cells for Ctrl, Rho+, CL-A, Y27, ML7, MßCD, siCtrl, and siCav1). Data shown as median interquartile range (box), 5th-95th percentiles (whiskers), and mean (+) (a, c), or mean s.e.m. (b, h-j); dashed lines show one-
- Submitted by
- Invitrogen Antibodies (provider)
- Main image
- Experimental details
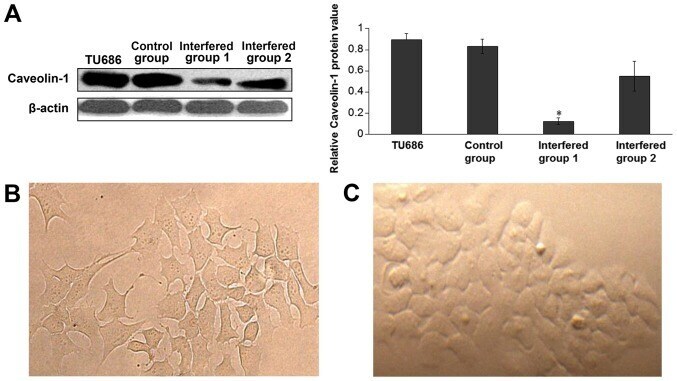
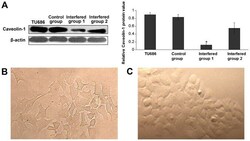
- Figure 1. Caveolin-1 knockdown in Tu686 cells by shRNA. (A) Western blot analysis depicting the reduced levels of caveolin-1 following knockdown by shRNA. The levels of caveolin-1 in the interfered group1 were significantly inhibited. Data were analyzed using the Student's t-test. *P