Explore
 Validate
 Learn
LearnMA3-600
antibody from Invitrogen Antibodies
Targeting: CAV1
CAV
 Western blot
 Immunocytochemistry
 Immunoprecipitation Immunohistochemistry Flow cytometry Other assay
Antibody data
- Antibody Data
- Antigen structure
- References [8]
- Comments [0]
- Validations
- Immunocytochemistry [5]
- Immunohistochemistry [2]
- Flow cytometry [5]
- Other assay [9]
Submit
Validation data
Reference
Comment
Report error
- Product number
- MA3-600 - Provider product page

- Provider
- Invitrogen Antibodies
- Product name
- Caveolin 1 Monoclonal Antibody (7C8)
- Antibody type
- Monoclonal
- Antigen
- Other
- Description
- MA3-600 detects caveolin from human, rat and hamster samples. MA3-600 has been successfully used in Western blot, immunofluorescence, and immunoprecipitation procedures. By Western blot, this antibody detects a 19-21 kDa band from transfected HEK293 (B8) cells, with a non-specific band appearing at 65-70 kDa. The MA3-600 immunogen is intercellular membrane protein-containing vesicles obtained from rat.
- Reactivity
- Human, Rat, Hamster
- Host
- Mouse
- Isotype
- IgG
- Antibody clone number
- 7C8
- Vial size
- 100 μL
- Concentration
- Conc. Not Determined
- Storage
- -20°C, Avoid Freeze/Thaw Cycles
Submitted references Vibropolyfection: coupling polymer-mediated gene delivery to mechanical stimulation to enhance transfection of adherent cells.
Establishment and Characterization of a Novel Multidrug Resistant Human Ovarian Cancer Cell Line With Heterogenous MRP7 Overexpression.
An iPSC-Derived Neuron Model of CLN3 Disease Facilitates Small Molecule Phenotypic Screening.
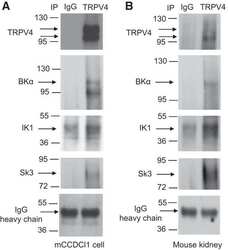
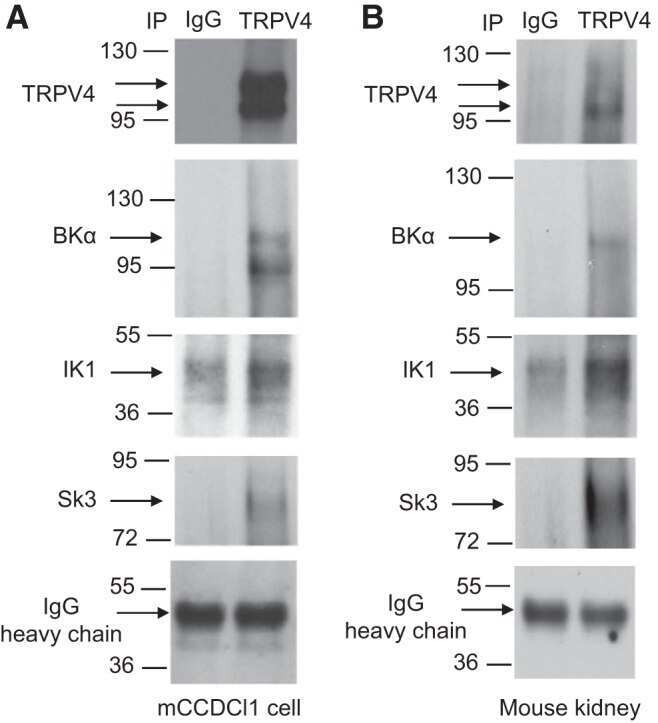
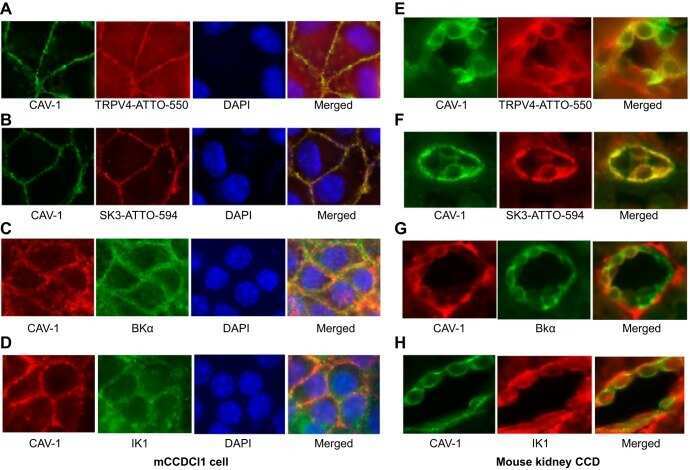
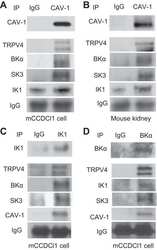
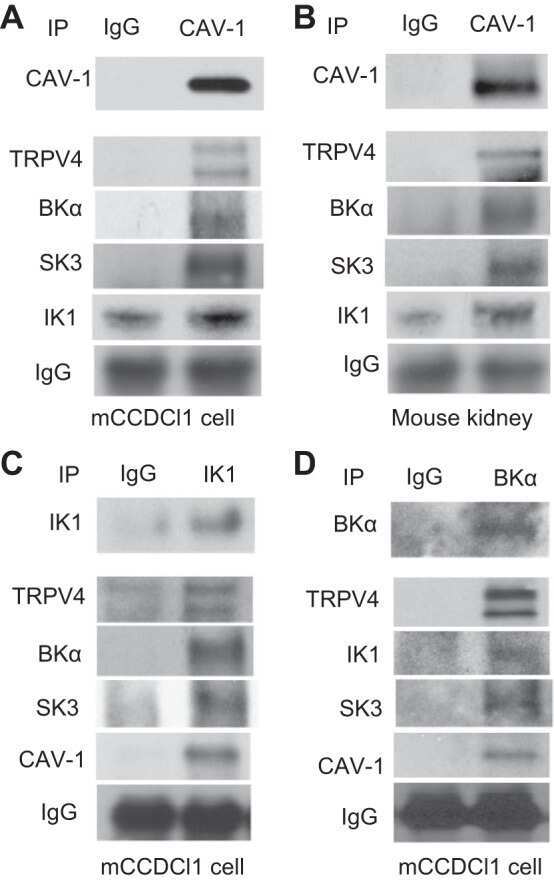
Caveolae facilitate TRPV4-mediated Ca(2+) signaling and the hierarchical activation of Ca(2+)-activated K(+) channels in K(+)-secreting renal collecting duct cells.
Self-Replicating RNA Vaccine Delivery to Dendritic Cells.
Rac1-mediated membrane raft localization of PI3K/p110β is required for its activation by GPCRs or PTEN loss.
Aquaporin-4 water channel oligomers are associated with the transverse tubules of skeletal myofibers.
Immunopurification and characterization of rat adipocyte caveolae suggest their dissociation from insulin signaling.
Ponti F, Bono N, Russo L, Bigini P, Mantovani D, Candiani G
Journal of nanobiotechnology 2022 Aug 6;20(1):363
Journal of nanobiotechnology 2022 Aug 6;20(1):363
Establishment and Characterization of a Novel Multidrug Resistant Human Ovarian Cancer Cell Line With Heterogenous MRP7 Overexpression.
Wang JQ, Wu ZX, Yang Y, Li JS, Yang DH, Fan YF, Chen ZS
Frontiers in oncology 2021;11:731260
Frontiers in oncology 2021;11:731260
An iPSC-Derived Neuron Model of CLN3 Disease Facilitates Small Molecule Phenotypic Screening.
Kinarivala N, Morsy A, Patel R, Carmona AV, Sajib MS, Raut S, Mikelis CM, Al-Ahmad A, Trippier PC
ACS pharmacology & translational science 2020 Oct 9;3(5):931-947
ACS pharmacology & translational science 2020 Oct 9;3(5):931-947
Caveolae facilitate TRPV4-mediated Ca(2+) signaling and the hierarchical activation of Ca(2+)-activated K(+) channels in K(+)-secreting renal collecting duct cells.
Li Y, Hu H, O'Neil RG
American journal of physiology. Renal physiology 2018 Dec 1;315(6):F1626-F1636
American journal of physiology. Renal physiology 2018 Dec 1;315(6):F1626-F1636
Self-Replicating RNA Vaccine Delivery to Dendritic Cells.
Démoulins T, Englezou PC, Milona P, Ruggli N, Tirelli N, Pichon C, Sapet C, Ebensen T, Guzmán CA, McCullough KC
Methods in molecular biology (Clifton, N.J.) 2017;1499:37-75
Methods in molecular biology (Clifton, N.J.) 2017;1499:37-75
Rac1-mediated membrane raft localization of PI3K/p110β is required for its activation by GPCRs or PTEN loss.
Cizmecioglu O, Ni J, Xie S, Zhao JJ, Roberts TM
eLife 2016 Oct 4;5
eLife 2016 Oct 4;5
Aquaporin-4 water channel oligomers are associated with the transverse tubules of skeletal myofibers.
Kaakinen M, Zelenin S, Metsikkö K
Experimental cell research 2011 Jan 1;317(1):20-8
Experimental cell research 2011 Jan 1;317(1):20-8
Immunopurification and characterization of rat adipocyte caveolae suggest their dissociation from insulin signaling.
Souto RP, Vallega G, Wharton J, Vinten J, Tranum-Jensen J, Pilch PF
The Journal of biological chemistry 2003 May 16;278(20):18321-9
The Journal of biological chemistry 2003 May 16;278(20):18321-9
No comments: Submit comment
Supportive validation
- Submitted by
- Invitrogen Antibodies (provider)
- Main image
- Experimental details
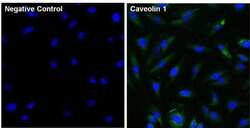
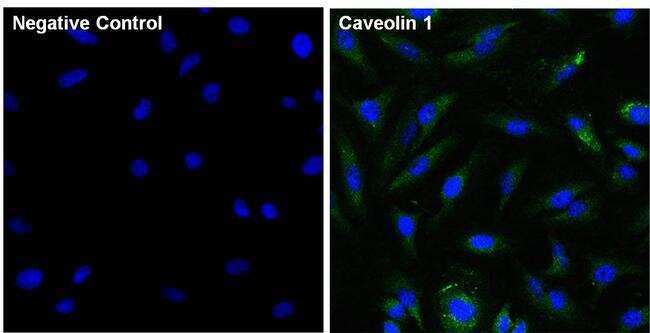
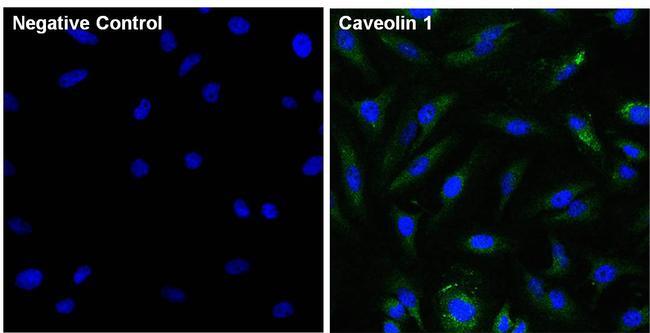
- Immunofluorescent analysis of Caveolin 1 (green) in HeLa cells. The cells were fixed with 4% paraformaldehyde for 15 minutes, permeabilized with 0.1% Triton X-100 in PBS for 15 minutes, and blocked with 3% Blocker BSA (Product # 37525) in PBS for 30 minutes at room temperature. Cells were stained with a Caveolin 1 monoclonal antibody (Product # MA3-600) at a dilution of 1:100 for 1 hour at room temperature, and then incubated with a Goat anti-Mouse IgG (H+L) Superclonal Secondary Antibody, Alexa Fluor® 488 conjugate (Product # A28175) at a dilution of 1:1000 for 1 hour at room temperature (green). Nuclei (blue) were stained with Hoechst 33342 dye (Product # 62249). Images were taken on a Thermo Scientific ToxInsight at 20X magnification.
- Submitted by
- Invitrogen Antibodies (provider)
- Main image
- Experimental details
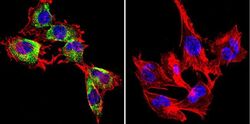
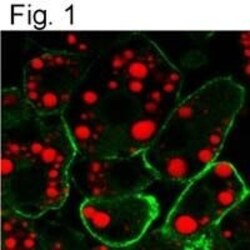
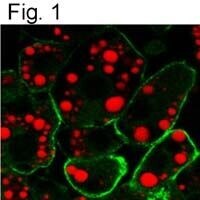
- Immunofluorescent analysis of Caveolin 1 in H-4-II-E Cells. Cells were grown on chamber slides and fixed with formaldehyde prior to staining. Cells were probed without (control) or with a Caveolin 1 monoclonal antibody (Product # MA3-600) at a dilution of 1:200 overnight at 4 C, washed with PBS and incubated with a DyLight-488 conjugated secondary antibody (Product # 35503). Caveolin 1 staining (green), F-Actin staining with Phalloidin (red) and nuclei with DAPI (blue) is shown. Images were taken at 60X magnification.

- Submitted by
- Invitrogen Antibodies (provider)
- Main image

- Experimental details
- Immunofluorescent analysis of Caveolin 1 using a monoclonal antibody (Product # MA3-600).

- Submitted by
- Invitrogen Antibodies (provider)
- Main image

- Experimental details
- Immunofluorescent analysis of Caveolin 1 (green) in HeLa cells. The cells were fixed with 4% paraformaldehyde for 15 minutes, permeabilized with 0.1% Triton X-100 in PBS for 15 minutes, and blocked with 3% Blocker BSA (Product # 37525) in PBS for 30 minutes at room temperature. Cells were stained with a Caveolin 1 monoclonal antibody (Product # MA3-600) at a dilution of 1:100 for 1 hour at room temperature, and then incubated with a Goat anti-Mouse IgG (H+L) Superclonal Secondary Antibody, Alexa Fluor® 488 conjugate (Product # A28175) at a dilution of 1:1000 for 1 hour at room temperature (green). Nuclei (blue) were stained with Hoechst 33342 dye (Product # 62249). Images were taken on a Thermo Scientific ToxInsight at 20X magnification.
- Submitted by
- Invitrogen Antibodies (provider)
- Main image
- Experimental details
- Immunofluorescent analysis of Caveolin 1 using a monoclonal antibody (Product # MA3-600).
Supportive validation
- Submitted by
- Invitrogen Antibodies (provider)
- Main image
- Experimental details
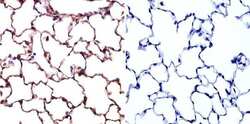
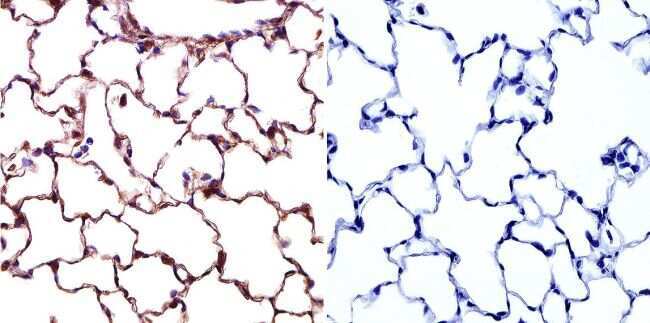
- Immunohistochemistry was performed on normal biopsies of deparaffinized Rat lung tissue. To expose target proteins, heat induced antigen retrieval was performed using 10mM sodium citrate (pH6.0) buffer, microwaved for 8-15 minutes. Following antigen retrieval tissues were blocked in 3% BSA-PBS for 30 minutes at room temperature. Tissues were then probed at a dilution of 1:20 with a Mouse Monoclonal Antibody recognizing Caveolin 1 (Product # MA3-600) or without primary antibody (negative control) overnight at 4°C in a humidified chamber. Tissues were washed extensively with PBST and endogenous peroxidase activity was quenched with a peroxidase suppressor. Detection was performed using a biotin-conjugated secondary antibody and SA-HRP, followed by colorimetric detection using DAB. Tissues were counterstained with hematoxylin and prepped for mounting.
- Submitted by
- Invitrogen Antibodies (provider)
- Main image
- Experimental details
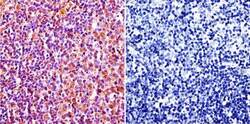
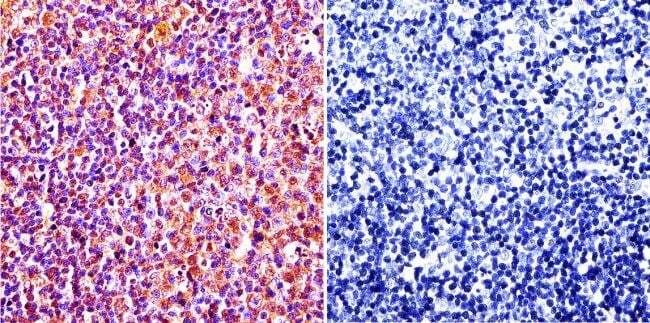
- Immunohistochemistry was performed on normal biopsies of deparaffinized Rat lymph node tissue. To expose target proteins, heat induced antigen retrieval was performed using 10mM sodium citrate (pH6.0) buffer, microwaved for 8-15 minutes. Following antigen retrieval tissues were blocked in 3% BSA-PBS for 30 minutes at room temperature. Tissues were then probed at a dilution of 1:20 with a Mouse Monoclonal Antibody recognizing Caveolin 1 (Product # MA3-600) or without primary antibody (negative control) overnight at 4°C in a humidified chamber. Tissues were washed extensively with PBST and endogenous peroxidase activity was quenched with a peroxidase suppressor. Detection was performed using a biotin-conjugated secondary antibody and SA-HRP, followed by colorimetric detection using DAB. Tissues were counterstained with hematoxylin and prepped for mounting.
Supportive validation
- Submitted by
- Invitrogen Antibodies (provider)
- Main image
- Experimental details
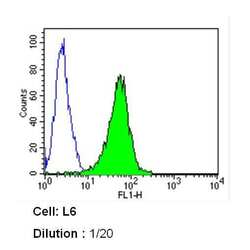
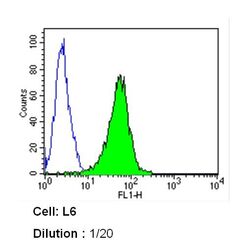
- Flow cytometry analysis of Caveolin 1 in L6 cells (green) compared to an isotype control (blue). Cells were harvested, adjusted to a concentration of 1-5x10^6 cells/mL, fixed with 2% paraformaldehyde and washed with PBS. Cells were blocked with a 2% solution of BSA-PBS for 30 min at room temperature and incubated with a Caveolin 1 monoclonal antibody (Product # MA3-600) at a dilution of 1:20 for 60 min at room temperature. Cells were then incubated for 40 min at room temperature in the dark using a Dylight 488-conjugated secondary antibody and re-suspended in PBS for FACS analysis.

- Submitted by
- Invitrogen Antibodies (provider)
- Main image

- Experimental details
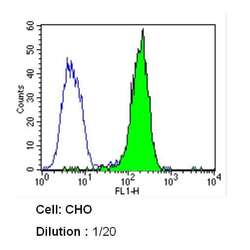
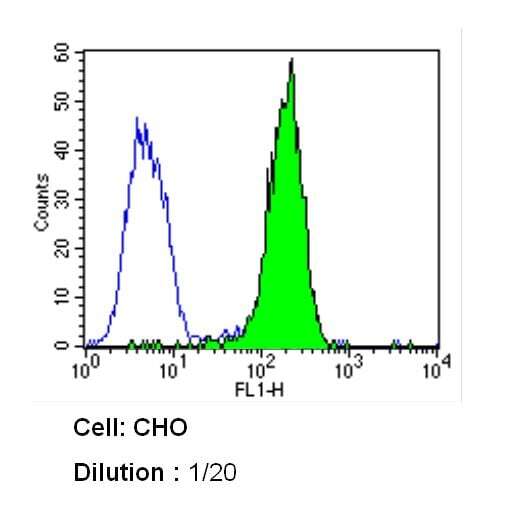
- Flow cytometry analysis of Caveolin 1 in CHO cells (green) compared to an isotype control (blue). Cells were harvested, adjusted to a concentration of 1-5x10^6 cells/mL, fixed with 2% paraformaldehyde and washed with PBS. Cells were blocked with a 2% solution of BSA-PBS for 30 min at room temperature and incubated with a Caveolin 1 monoclonal antibody (Product # MA3-600) at a dilution of 1:20 for 60 min at room temperature. Cells were then incubated for 40 min at room temperature in the dark using a Dylight 488-conjugated secondary antibody and re-suspended in PBS for FACS analysis.

- Submitted by
- Invitrogen Antibodies (provider)
- Main image
- Experimental details
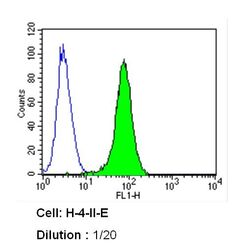
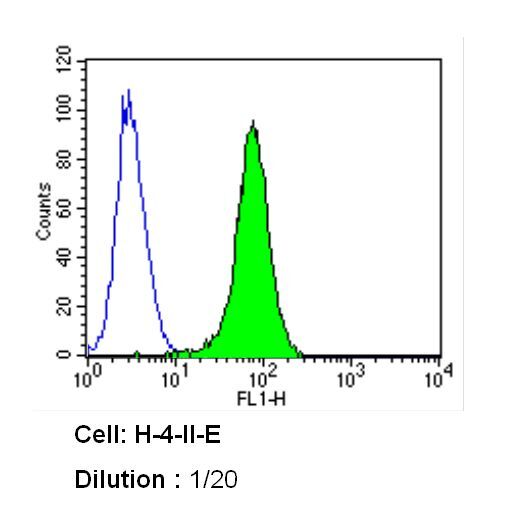
- Flow cytometry analysis of Caveolin 1 in H-4-II-E cells (green) compared to an isotype control (blue). Cells were harvested, adjusted to a concentration of 1-5x10^6 cells/mL, fixed with 2% paraformaldehyde and washed with PBS. Cells were blocked with a 2% solution of BSA-PBS for 30 min at room temperature and incubated with a Caveolin 1 monoclonal antibody (Product # MA3-600) at a dilution of 1:20 for 60 min at room temperature. Cells were then incubated for 40 min at room temperature in the dark using a Dylight 488-conjugated secondary antibody and re-suspended in PBS for FACS analysis.
- Submitted by
- Invitrogen Antibodies (provider)
- Main image
- Experimental details
- Flow cytometry analysis of Caveolin 1 in L6 cells (green) compared to an isotype control (blue). Cells were harvested, adjusted to a concentration of 1-5x10^6 cells/mL, fixed with 2% paraformaldehyde and washed with PBS. Cells were blocked with a 2% solution of BSA-PBS for 30 min at room temperature and incubated with a Caveolin 1 monoclonal antibody (Product # MA3-600) at a dilution of 1:20 for 60 min at room temperature. Cells were then incubated for 40 min at room temperature in the dark using a Dylight 488-conjugated secondary antibody and re-suspended in PBS for FACS analysis.

- Submitted by
- Invitrogen Antibodies (provider)
- Main image
- Experimental details
- Flow cytometry analysis of Caveolin 1 in CHO cells (green) compared to an isotype control (blue). Cells were harvested, adjusted to a concentration of 1-5x10^6 cells/mL, fixed with 2% paraformaldehyde and washed with PBS. Cells were blocked with a 2% solution of BSA-PBS for 30 min at room temperature and incubated with a Caveolin 1 monoclonal antibody (Product # MA3-600) at a dilution of 1:20 for 60 min at room temperature. Cells were then incubated for 40 min at room temperature in the dark using a Dylight 488-conjugated secondary antibody and re-suspended in PBS for FACS analysis.
Supportive validation
- Submitted by
- Invitrogen Antibodies (provider)
- Main image
- Experimental details
- NULL
- Submitted by
- Invitrogen Antibodies (provider)
- Main image
- Experimental details
- NULL
- Submitted by
- Invitrogen Antibodies (provider)
- Main image

- Experimental details
- NULL
- Submitted by
- Invitrogen Antibodies (provider)
- Main image
- Experimental details
- NULL
- Submitted by
- Invitrogen Antibodies (provider)
- Main image
- Experimental details
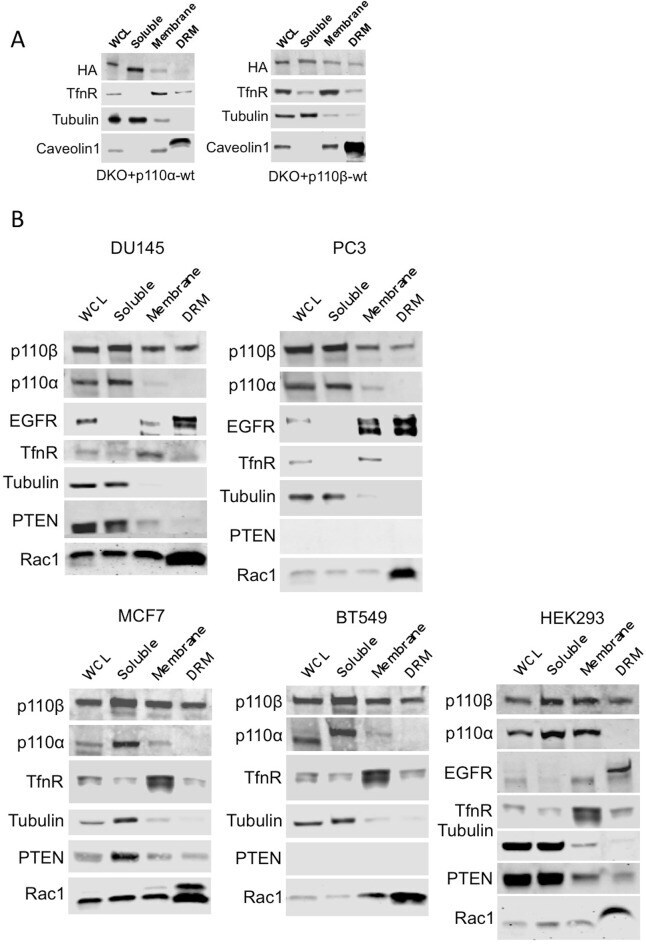
- Figure 2--figure supplement 1. Membrane raft localization of p110beta in different cell lines. ( A ) DKO+p110alpha-wt and DKO+p110beta-wt MEFs were lysed and fractionated into triton sensitive and triton resistant membrane fractions. Whole cell lysates (WCL) were analyzed to display overall levels of protein expression. Soluble, triton soluble (membrane) and triton resistant membrane fractions (DRM) were analyzed in immunoblots; anti-HA antibodies were used to visualize the abundance of the respective PI3K in fractions. Anti-Caveolin1 antibodies were used as markers for detergent resistant membranes (DRM), whereas anti-TfnR immunoblot depicts enrichment of nonraft membranes. Anti-tubulin immunoblot serves as a marker for soluble fractions. ( B ) HEK293, DU145, PC3, MCF7 and BT549 cells were lysed and fractionated into triton sensitive and triton resistant membrane fractions. Whole cell lysates (WCL) were analyzed to display overall levels of protein abundance. Soluble, triton sensitive (membrane) and resistant (DRM) membrane fractions were analyzed in immunoblots; anti-EGFR and anti-Rac1 immunoblots were used as markers for detergent resistant membrane (DRM) fractions, whereas anti-TfnR immunoblot depicts enrichment of nonraft plasma membranes. Anti-tubulin antibodies serve as a marker for soluble fractions. Anti-PTEN immunoblots depict PTEN status of the respective cell line. DOI: http://dx.doi.org/
- Submitted by
- Invitrogen Antibodies (provider)
- Main image

- Experimental details
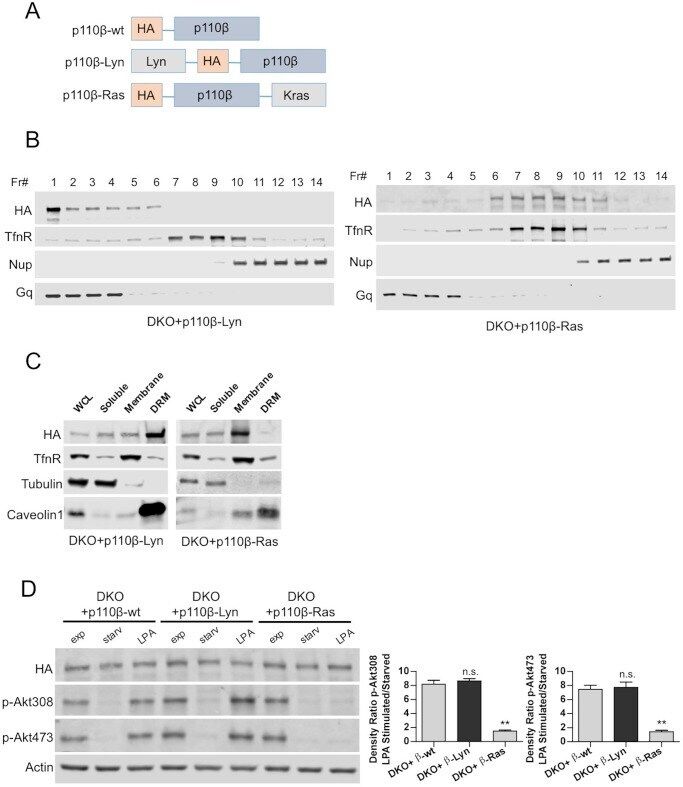
- Figure 3. Raft-excluded p110beta fails to induce Akt phosphorylation upon GPCR stimulation. ( A ) Schematic demonstration of p110beta membrane microdomain targeting vectors. ( B ) Detergent-free fractionation of DKO+p110beta-Lyn and DKO+p110beta-Ras MEFs on an Opti-prep gradient followed by western blots with the indicated antibodies. TfnR; a marker for nonraft plasma membrane. Nup; a marker for nuclear membranes. Gq; a marker for membrane rafts. ( C ) The indicated MEFs were lysed and fractionated. WCL were analyzed to display overall levels of protein expression. Soluble, triton soluble (membrane) and resistant membrane fractions (DRM) were analyzed in immunoblots; anti-Caveolin1 antibodies were used as marker for DRM fractions. Anti-tubulin immunoblot serves as a marker for soluble fractions. ( D ) The indicated add-back MEFs were starved and stimulated with LPA. Anti-HA immunoblot demonstrates levels of exogenous p110beta expression whereas anti-p-Akt antibodies (for T308 and S473) mark the activation state of Akt. Anti-actin antibodies were used as loading control. On the right, normalized anti-p-Akt T308 and S473 band intensity quantifications of the samples (mean of 3 independent experiments with standard deviation). Density ratio is the fold change between normalized band intensities of p-Akt signals in LPA stimulated over starved samples. ** p0.05. DOI: http://dx.doi.org/ Figure 3--figure supplement 1. Raft-excluded p110beta fails to induce activatory A
- Submitted by
- Invitrogen Antibodies (provider)
- Main image
- Experimental details
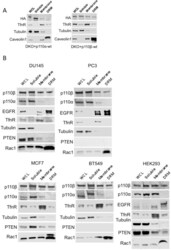
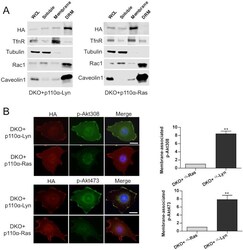
- Figure 6--figure supplement 1. Membrane targeting p110alpha vectors selectively enrich p110alpha in the desired microdomain. ( A ) DKO+p110alpha-Lyn and DKO+p110alpha-Ras MEFs were lysed and fractionated into triton sensitive and triton resistant membrane fractions. WCLs were analyzed to display overall levels of protein expression. Soluble, triton soluble (membrane) and resistant membrane fractions (DRM) were analyzed in immunoblots; anti-Rac1 and anti-Caveolin1 antibodies were used as markers for detergent resistant membrane (DRM) rafts, whereas anti-TfnR immunoblot depicts enrichment of nonraft membranes. Anti-tubulin immunoblot serves as a marker for soluble fractions. ( B ) The indicated DKO add-back MEFs were seeded on coverslips, starved and stimulated with LPA; membrane associated Akt phosphorylation at T308 and S473 was detected using anti-p-Akt T308 and p-Akt S473 antibodies (green). Anti-HA antibodies (red) depicted expression levels of the add-back vectors. DNA is shown in blue. Scale bar; 20 um. On the right, anti-p-Akt T308 and S473 signals on the cell membrane was quantified upon LPA stimulation and the relative corrected total membrane fluorescence was depicted. Results denote mean of 3 independent experiments with standard deviation. ** p

- Submitted by
- Invitrogen Antibodies (provider)
- Main image
- Experimental details
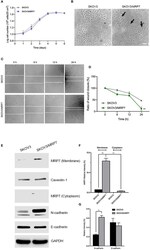
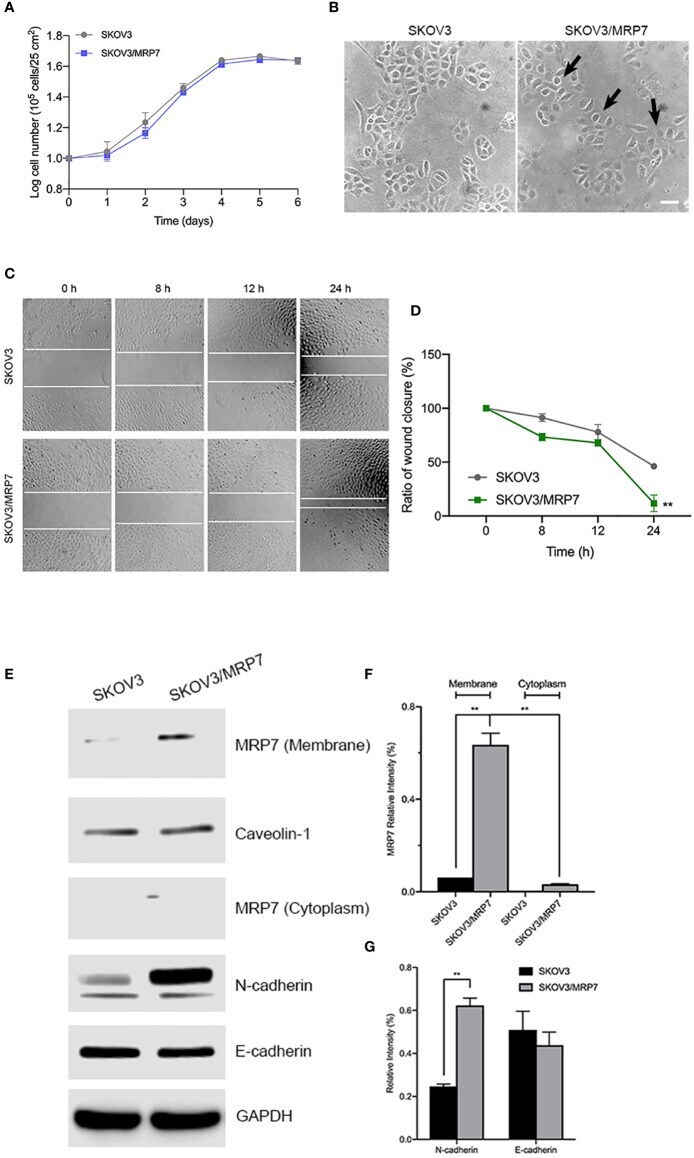
- Figure 2 Morphology, migration and EMT marker expression of SKOV3 and SKOV3/MRP7 cells. (A) Growth curve of SKOV3 and SKOV3/MRP7 cells. (B) Cell morphology of SKOV3 and SKOV3/MRP7 cells under optical microscope. Scale bar = 100 mum. Black arrows indicating reduced cell-cell contact. (C) Wound healing assay of SKOV3 and SKOV3/MRP7 cells. White solid line indicates the edges. (D) Semi-quantification of wound healing assay. Grey and green solid line represent the ratio of wound closure of SKOV3 and SKOV3/MRP7 cells, respectively. (E) Western blotting of membrane/cytoplasm protein and EMT markers. (F) Semi-quantification of membrane/cytoplasm protein. (G) Semi-quantification of EMT marker expression. ** p < 0.01 versus the negative control group. Data are expressed as mean +- SD derived from three independent experiments.
- Submitted by
- Invitrogen Antibodies (provider)
- Main image
- Experimental details
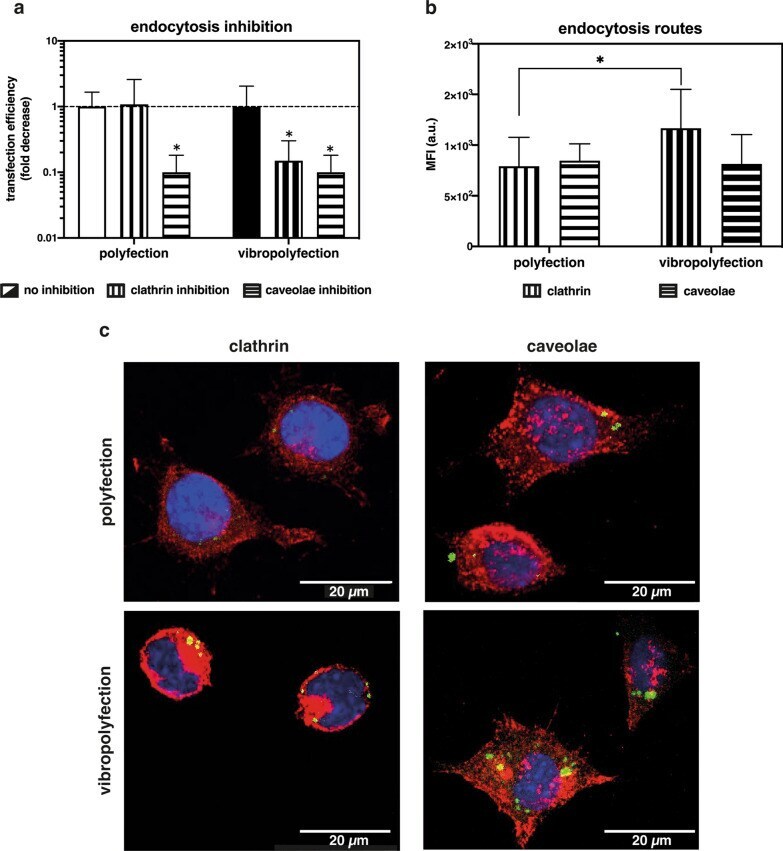
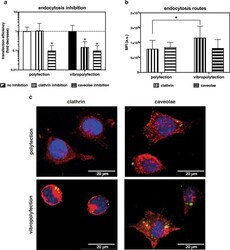
- Effect of vibrational loading on clathrin- and caveolae-mediated endocytosis and transfection. a Effect of clathrin- and caveolae-mediated endocytosis inhibitors on polyfected and vibropolyfected (5 min, f in = 1,000 Hz, post-delivery set-up) L929 cells. Briefly, cells were pre-treated for 30 min with chlorpromazine (10 ug/mL) or filipin (5 ug/mL) to inhibit clathrin- and caveolae-mediated endocytosis, respectively. Cells were next challenged with l PEI/pGL3 polyplexes for 3.5 hrs and cultured for a further 20 hrs. Data are expressed as a fold decrease in transfection efficiency in cells treated with inhibitors compared to cells transfected in the absence of inhibitors. Data are expressed as mean +- SD (n = 3, * p < 0.05 vs. cells transfected in the absence of inhibitors). b Effect of vibrational loading on clathrin and caveolae expression in polyfected and vibropolyfected L929 cells. Mean Fluorescence Intensity (MFI) of clathrin heavy chain and caveolin-1 proteins normalized to the cell area after transfection with l PEI/pDNA-FITC complexes upon static (polyfection) and vibropolyfection conditions (post-delivery set-up, f in = 1,000 Hz). Data are expressed as mean +- SD (n = 3, * p < 0.05). c Representative CLSM images of polyfected and vibropolyfected (post-delivery set-up, f in = 1,000 Hz) L929 cells. Briefly, cells were transfected for 1 hr, fixed, and clathrin heavy chain and caveolin-1 were immunostained. l PEI/pDNA-FITC polyplexes are in green, clathrin heavy chain and