Explore
 Validate
 Learn
Learn Flow cytometry
Antibody data
- Antibody Data
- Antigen structure
- References [21]
- Comments [0]
- Validations
- Flow cytometry [2]
- Other assay [10]
Submit
Validation data
Reference
Comment
Report error
- Product number
- 12-1979-42 - Provider product page

- Provider
- Invitrogen Antibodies
- Product name
- CD197 (CCR7) Monoclonal Antibody (3D12), PE, eBioscience™
- Antibody type
- Monoclonal
- Antigen
- Other
- Description
- Description: The 3D12 monoclonal antibody reacts with human CCR7, also known as EBI-1 and CD197. CCR7 is a member of the G-protein-coupled chemokine receptor family with seven membrane-spanning domains and functions as a receptor for 6Ckine/SLC (secondary lymphoid-tissue chemokine), CCL19 and CCL21. CCR7 has been shown to be internalized via clathrin-coated pits and the majority recycled back to the plasma membrane. CCR7 is expressed on T cells and can be used to distinguish populations of naive from central and effector memory T cells. CCR7 has been shown to play a role in migration of memory T cells to inflamed tissue. Expression of CCR7 is also found on DC's. During DC maturation CCR7 expression increases and is thought to be involved in a variety of functions: chemotaxis to the lymph node, cellular architecture, rate of endocytosis, survival and maturation. Expression of CCR7 on the cell surface can be down regulated upon ligand binding. Applications Reported: This 3D12 antibody has been reported for use in flow cytometric analysis. Applications Tested: This 3D12 antibody has been pre-titrated and tested by flow cytometric analysis of normal human peripheral blood cells. This can be used at 5 µL (0.125 µg) per test. A test is defined as the amount (µg) of antibody that will stain a cell sample in a final volume of 100 µL. Cell number should be determined empirically but can range from 10^5 to 10^8 cells/test. It is recommended that the staining incubation time be increased to at least 45 minutes at 2-8°C for optimal staining. Excitation: 488-561 nm; Emission: 578 nm; Laser: Blue Laser, Green Laser, Yellow-Green Laser. Filtration: 0.2 µm post-manufacturing filtered.
- Reactivity
- Human
- Host
- Rat
- Conjugate
- Yellow dye
- Isotype
- IgG
- Antibody clone number
- 3D12
- Vial size
- 100 Tests
- Concentration
- 5 μL/Test
- Storage
- 4°C, store in dark, DO NOT FREEZE!
Submitted references Alteration of the Immune Microenvironment in HBsAg and HBeAg Dual-Positive Pregnant Women Presenting a High HBV Viral Load.
Intestinal CD11b(+) B Cells Ameliorate Colitis by Secreting Immunoglobulin A.
Neuroimmune Consequences of eIF4E Phosphorylation on Chemotherapy-Induced Peripheral Neuropathy.
Development of CAR-T cell therapy for B-ALL using a point-of-care approach.
The TCR Repertoire Reconstitution in Multiple Sclerosis: Comparing One-Shot and Continuous Immunosuppressive Therapies.
Application of the chemokine-chemokine receptor axis increases the tumor-targeted migration ability of cytokine-induced killer cells in patients with colorectal cancer.
Single-Cell Profiling Defines Transcriptomic Signatures Specific to Tumor-Reactive versus Virus-Responsive CD4(+) T Cells.
Biochanin a Enhances the Defense Against Salmonella enterica Infection Through AMPK/ULK1/mTOR-Mediated Autophagy and Extracellular Traps and Reversing SPI-1-Dependent Macrophage (MΦ) M2 Polarization.
Characteristic patterns of HLA presentation and T cell differentiation in adult-onset Still's disease.
Oral Supplementation with Baker's Yeast Beta Glucan Is Associated with Altered Monocytes, T Cells and Cytokines following a Bout of Strenuous Exercise.
Selective Expression of CCR10 and CXCR3 by Circulating Human Herpes Simplex Virus-Specific CD8 T Cells.
Single-cell tracking of flavivirus RNA uncovers species-specific interactions with the immune system dictating disease outcome.
Resolving TYK2 locus genotype-to-phenotype differences in autoimmunity.
The APPEESFRS Peptide, Restricted by the HLA-B*35:01 Molecule, and the APPEESFRF Variant Derived from an Autologous HIV-1 Strain Induces Polyfunctional Responses in CD8+ T Cells.
Durable complete responses off all treatment in patients with metastatic malignant melanoma after sequential immunotherapy followed by a finite course of BRAF inhibitor therapy.
Calcineurin inhibitor treatment of intravenous immunoglobulin-resistant Kawasaki disease.
Human CD8⁺ and CD4⁺ T cell memory to lymphocytic choriomeningitis virus infection.
Memory T-cells and characterization of peripheral T-cell clones in acute Kawasaki disease.
Role of TLX1 in T-cell acute lymphoblastic leukaemia pathogenesis.
Proliferation and differentiation potential of human CD8+ memory T-cell subsets in response to antigen or homeostatic cytokines.
Two subsets of memory T lymphocytes with distinct homing potentials and effector functions.
Gao F, Wang H, Li X, Guo F, Yuan Y, Wang X, Zhang Y, Bai G
Journal of inflammation research 2021;14:5619-5632
Journal of inflammation research 2021;14:5619-5632
Intestinal CD11b(+) B Cells Ameliorate Colitis by Secreting Immunoglobulin A.
Fu Y, Wang Z, Yu B, Lin Y, Huang E, Liu R, Zhao C, Lu M, Xu W, Liu H, Liu Y, Wang L, Chu Y
Frontiers in immunology 2021;12:697725
Frontiers in immunology 2021;12:697725
Neuroimmune Consequences of eIF4E Phosphorylation on Chemotherapy-Induced Peripheral Neuropathy.
Agalave NM, Mody PH, Szabo-Pardi TA, Jeong HS, Burton MD
Frontiers in immunology 2021;12:642420
Frontiers in immunology 2021;12:642420
Development of CAR-T cell therapy for B-ALL using a point-of-care approach.
de Macedo Abdo L, Barros LRC, Saldanha Viegas M, Vieira Codeço Marques L, de Sousa Ferreira P, Chicaybam L, Bonamino MH
Oncoimmunology 2020;9(1):1752592
Oncoimmunology 2020;9(1):1752592
The TCR Repertoire Reconstitution in Multiple Sclerosis: Comparing One-Shot and Continuous Immunosuppressive Therapies.
Amoriello R, Greiff V, Aldinucci A, Bonechi E, Carnasciali A, Peruzzi B, Repice AM, Mariottini A, Saccardi R, Mazzanti B, Massacesi L, Ballerini C
Frontiers in immunology 2020;11:559
Frontiers in immunology 2020;11:559
Application of the chemokine-chemokine receptor axis increases the tumor-targeted migration ability of cytokine-induced killer cells in patients with colorectal cancer.
Zou Y, Liang J, Li D, Fang J, Wang L, Wang J, Zhang J, Guo Q, Yan X, Tang H
Oncology letters 2020 Jul;20(1):123-134
Oncology letters 2020 Jul;20(1):123-134
Single-Cell Profiling Defines Transcriptomic Signatures Specific to Tumor-Reactive versus Virus-Responsive CD4(+) T Cells.
Magen A, Nie J, Ciucci T, Tamoutounour S, Zhao Y, Mehta M, Tran B, McGavern DB, Hannenhalli S, Bosselut R
Cell reports 2019 Dec 3;29(10):3019-3032.e6
Cell reports 2019 Dec 3;29(10):3019-3032.e6
Biochanin a Enhances the Defense Against Salmonella enterica Infection Through AMPK/ULK1/mTOR-Mediated Autophagy and Extracellular Traps and Reversing SPI-1-Dependent Macrophage (MΦ) M2 Polarization.
Zhao X, Tang X, Guo N, An Y, Chen X, Shi C, Wang C, Li Y, Li S, Xu H, Liu M, Wang Y, Yu L
Frontiers in cellular and infection microbiology 2018;8:318
Frontiers in cellular and infection microbiology 2018;8:318
Characteristic patterns of HLA presentation and T cell differentiation in adult-onset Still's disease.
Jung JY, Choi B, Sayeed HM, Suh CH, Kim YW, Kim HA, Sohn S
International journal of immunopathology and pharmacology 2018 Jan-Dec;32:2058738418791284
International journal of immunopathology and pharmacology 2018 Jan-Dec;32:2058738418791284
Oral Supplementation with Baker's Yeast Beta Glucan Is Associated with Altered Monocytes, T Cells and Cytokines following a Bout of Strenuous Exercise.
McFarlin BK, Venable AS, Carpenter KC, Henning AL, Ogenstad S
Frontiers in physiology 2017;8:786
Frontiers in physiology 2017;8:786
Selective Expression of CCR10 and CXCR3 by Circulating Human Herpes Simplex Virus-Specific CD8 T Cells.
Hensel MT, Peng T, Cheng A, De Rosa SC, Wald A, Laing KJ, Jing L, Dong L, Magaret AS, Koelle DM
Journal of virology 2017 Oct 1;91(19)
Journal of virology 2017 Oct 1;91(19)
Single-cell tracking of flavivirus RNA uncovers species-specific interactions with the immune system dictating disease outcome.
Douam F, Hrebikova G, Albrecht YE, Sellau J, Sharon Y, Ding Q, Ploss A
Nature communications 2017 Mar 14;8:14781
Nature communications 2017 Mar 14;8:14781
Resolving TYK2 locus genotype-to-phenotype differences in autoimmunity.
Dendrou CA, Cortes A, Shipman L, Evans HG, Attfield KE, Jostins L, Barber T, Kaur G, Kuttikkatte SB, Leach OA, Desel C, Faergeman SL, Cheeseman J, Neville MJ, Sawcer S, Compston A, Johnson AR, Everett C, Bell JI, Karpe F, Ultsch M, Eigenbrot C, McVean G, Fugger L
Science translational medicine 2016 Nov 2;8(363):363ra149
Science translational medicine 2016 Nov 2;8(363):363ra149
The APPEESFRS Peptide, Restricted by the HLA-B*35:01 Molecule, and the APPEESFRF Variant Derived from an Autologous HIV-1 Strain Induces Polyfunctional Responses in CD8+ T Cells.
Acevedo-Sáenz L, Carmona-Pérez L, Velilla-Hernández PA, Delgado JC, Rugeles L MT
BioResearch open access 2015;4(1):115-20
BioResearch open access 2015;4(1):115-20
Durable complete responses off all treatment in patients with metastatic malignant melanoma after sequential immunotherapy followed by a finite course of BRAF inhibitor therapy.
Wyluda EJ, Cheng J, Schell TD, Haley JS, Mallon C, Neves RI, Robertson G, Sivik J, Mackley H, Talamo G, Drabick JJ
Cancer biology & therapy 2015;16(5):662-70
Cancer biology & therapy 2015;16(5):662-70
Calcineurin inhibitor treatment of intravenous immunoglobulin-resistant Kawasaki disease.
Tremoulet AH, Pancoast P, Franco A, Bujold M, Shimizu C, Onouchi Y, Tamamoto A, Erdem G, Dodd D, Burns JC
The Journal of pediatrics 2012 Sep;161(3):506-512.e1
The Journal of pediatrics 2012 Sep;161(3):506-512.e1
Human CD8⁺ and CD4⁺ T cell memory to lymphocytic choriomeningitis virus infection.
Kotturi MF, Swann JA, Peters B, Arlehamn CL, Sidney J, Kolla RV, James EA, Akondy RS, Ahmed R, Kwok WW, Buchmeier MJ, Sette A
Journal of virology 2011 Nov;85(22):11770-80
Journal of virology 2011 Nov;85(22):11770-80
Memory T-cells and characterization of peripheral T-cell clones in acute Kawasaki disease.
Franco A, Shimizu C, Tremoulet AH, Burns JC
Autoimmunity 2010 Jun;43(4):317-24
Autoimmunity 2010 Jun;43(4):317-24
Role of TLX1 in T-cell acute lymphoblastic leukaemia pathogenesis.
Riz I, Hawley TS, Johnston H, Hawley RG
British journal of haematology 2009 Apr;145(1):140-3
British journal of haematology 2009 Apr;145(1):140-3
Proliferation and differentiation potential of human CD8+ memory T-cell subsets in response to antigen or homeostatic cytokines.
Geginat J, Lanzavecchia A, Sallusto F
Blood 2003 Jun 1;101(11):4260-6
Blood 2003 Jun 1;101(11):4260-6
Two subsets of memory T lymphocytes with distinct homing potentials and effector functions.
Sallusto F, Lenig D, Förster R, Lipp M, Lanzavecchia A
Nature 1999 Oct 14;401(6754):708-12
Nature 1999 Oct 14;401(6754):708-12
No comments: Submit comment
Supportive validation
- Submitted by
- Invitrogen Antibodies (provider)
- Main image

- Experimental details
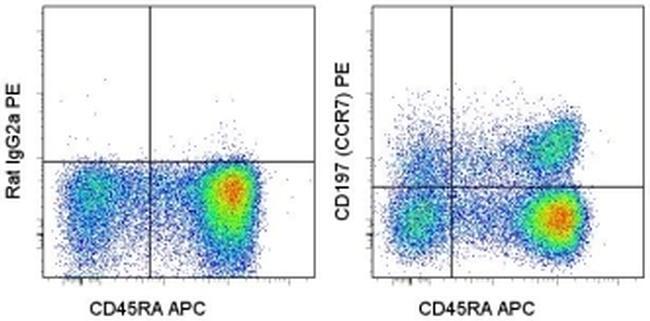
- Staining of normal human peripheral blood cells with Anti-Human CD45RA APC (Product # 17-0458-42) and Rat IgG2a K Isotype Control PE (Product # 12-4321-80) (left) or Anti-Human CD197 (CCR7) PE (right). Cells in the lymphocyte gate were used for analysis.
- Conjugate
- Yellow dye

- Submitted by
- Invitrogen Antibodies (provider)
- Main image

- Experimental details
- Staining of normal human peripheral blood cells with Anti-Human CD45RA APC (Product # 17-0458-42) and Rat IgG2a K Isotype Control PE (Product # 12-4321-80) (left) or Anti-Human CD197 (CCR7) PE (right). Cells in the lymphocyte gate were used for analysis.
Supportive validation
- Submitted by
- Invitrogen Antibodies (provider)
- Main image
- Experimental details
- NULL
- Conjugate
- Yellow dye

- Submitted by
- Invitrogen Antibodies (provider)
- Main image
- Experimental details
- NULL
- Conjugate
- Yellow dye

- Submitted by
- Invitrogen Antibodies (provider)
- Main image
- Experimental details
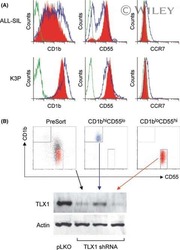
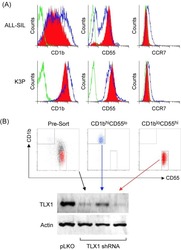
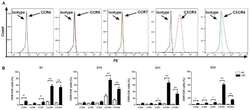
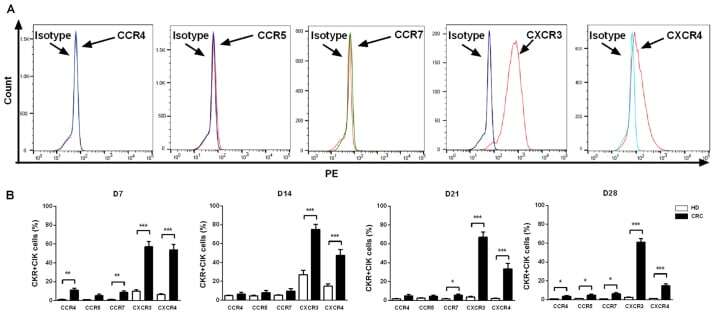
- Figure 3. Expression levels of chemokine receptors on CIK cells generated from patients with CRC and healthy donors. (A) Analysis of the expression levels of CCR4, CCR5, CCR7, CXCR3 and CXCR4 on CIK cells via flow cytometry revealed that CXCR3 and CXCR4 had higher expression levels on CIK cells compared with isotype, expression profiles of CCR4, CCR5 and CCR7 did not show significant changes compared with isotype. (B) Dynamic changes of chemokine receptors CCR4, CCR5, CCR7, CXCR3 and CXCR4 of CIK cells on D7, 14, 21 and 28 were detected in patients with CRC and HD CIK cells via flow cytometry. The result revealed that expression levels of CXCR3 and CXCR4 were significantly higher on CIK cells cultured from CRC compared with HD at all the time points analyzed, while the expression levels of CCR4, CCR5 and CCR7 were significantly higher on CIK cells cultured from CRC compared with HD at different time points analyzed (CCR4 on D7 and D28; CCR5 on D28; CCR7 on D7, D21 and D28). All comparisons were performed using unpaired Student''s t-test with Welch''s correction. *P
- Conjugate
- Yellow dye
- Submitted by
- Invitrogen Antibodies (provider)
- Main image
- Experimental details
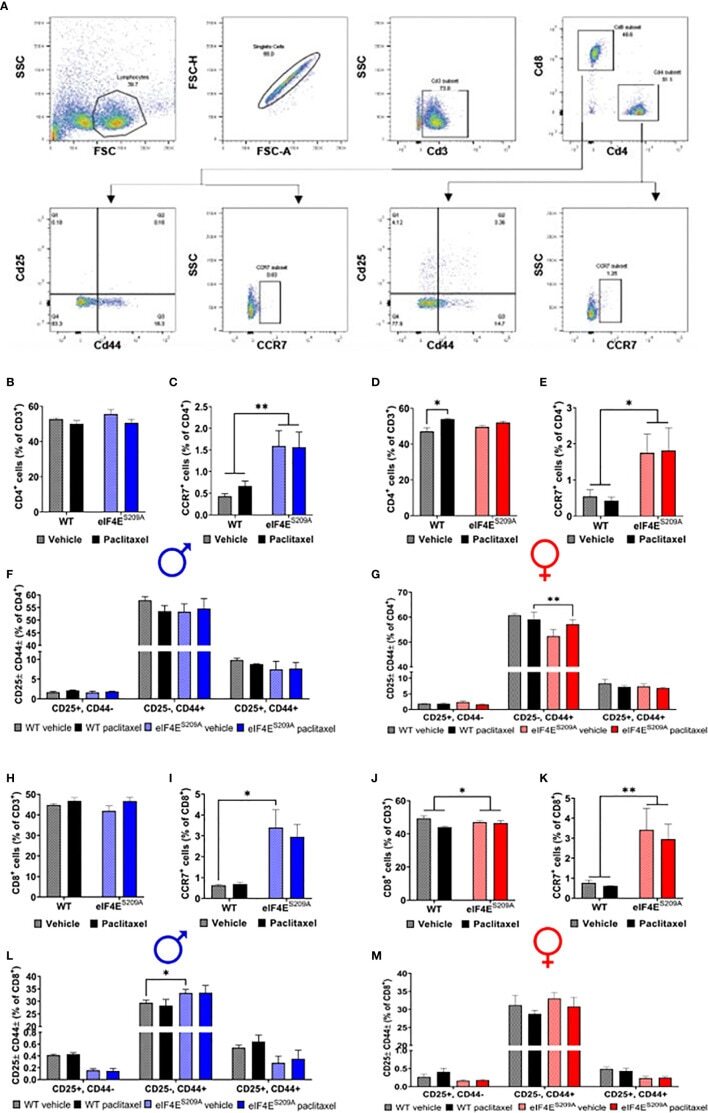
- Figure 3 Paclitaxel dysregulates CD4 + and CD8 + T-cell subpopulations in an eIF4E-dependent manner. (A) Gating strategy used for flow cytometry of lymphocytes from popliteal and inguinal lymph nodes. T-cells were separated from the whole lymphoid cells population using CD3. CD3 + cells were then gated for CD4 + T-cell and CD8 + T-cells. For each of these subsets, cells were further gated for CCR7 or CD25 and CD44. (B) Quantification of CD4 + T-cells from the CD3 population from male mice. (C) CCR7 + T-cells from isolated CD4 + population in males, ** p 0.0063. (D) CD4 + cells gated for CD25 and/or CD44 in males. (E) Quantification of CD4 + T-cells from the CD3 + population from female mice, * p 0.0101. (F) CCR7 + T-cells from isolated CD4 + population in female mice, * p 0.0250. (G) CD4 + cells gated for CD25 and/or CD44 in female mice, ** p 0.0011. (H) Quantification of CD8 + T-cells from the CD3 + population from male mice. (I) CCR7 + T-cells from isolated CD8 + population in males, * p 0.0433. (J) CD8 + cells gated for CD25 and/or CD44 in males, * p 0.0396. (K) Quantification of CD8 + T-cells from the CD3 population from female mice, * p 0.041. (L) CCR7 + T-cells from isolated CD8 + population in female mice, ** p 0.0097. (M) CD8 + cells gated for CD25 and/or CD44 in female mice. All data are presented as mean +- standard error of the mean, n = 3 mice each for male/female WT vehicle-treated and WT paclitaxel groups, n = 4 mice each for male/female eIF4E S209A vehicle-trea
- Conjugate
- Yellow dye
- Submitted by
- Invitrogen Antibodies (provider)
- Main image
- Experimental details
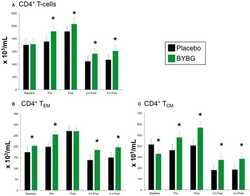
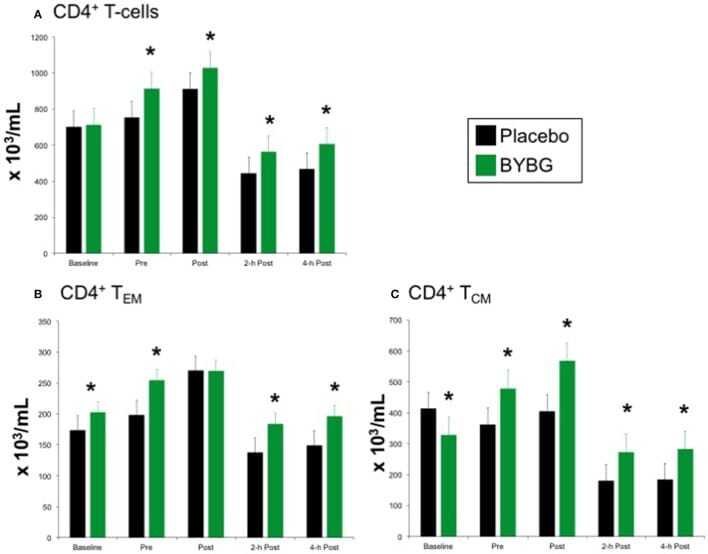
- Figure 5 Effect of BYBG on CD4+ T cells. CD4+ T cell concentrations were determined using peripheral blood mononuclear cells (PBMC) isolated from human whole blood samples. PBMCs were analyzed using flow cytometry to determine total ( A , CD3+/CD4+), T EM ( B , CCR7-/CD45RA-), and T CM ( C , CCR7+/CD45RA-) concentrations. Placebo (black bars) and BYBG (green bars) are represented separately and were statistically compared. Values represent the mean +- SEM. * indicates BYBG significantly different than placebo ( p < 0.05).
- Conjugate
- Yellow dye
- Submitted by
- Invitrogen Antibodies (provider)
- Main image
- Experimental details
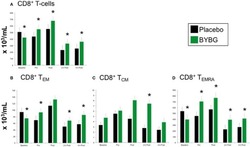
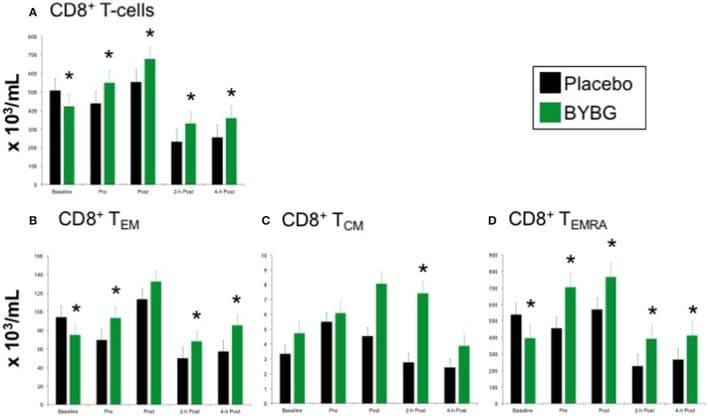
- Figure 6 Effect of BYBG on CD8+ T cells. CD8+ T cell concentrations were determined using peripheral blood mononuclear cells (PBMC) isolated from human whole blood samples. PBMCs were analyzed using flow cytometry to determine total ( A , CD3+/CD8+), T EM ( B , CCR7-/CD45RA-), and T CM ( C , CCR7+/CD45RA-), and T EMRA ( D , CCR7-/CD45RA+) concentrations. Placebo (black bars) and BYBG (green bars) are represented separately and were statistically compared. Values represent the mean +- SEM. * indicates BYBG significantly different than placebo ( p < 0.05).
- Conjugate
- Yellow dye
- Submitted by
- Invitrogen Antibodies (provider)
- Main image

- Experimental details
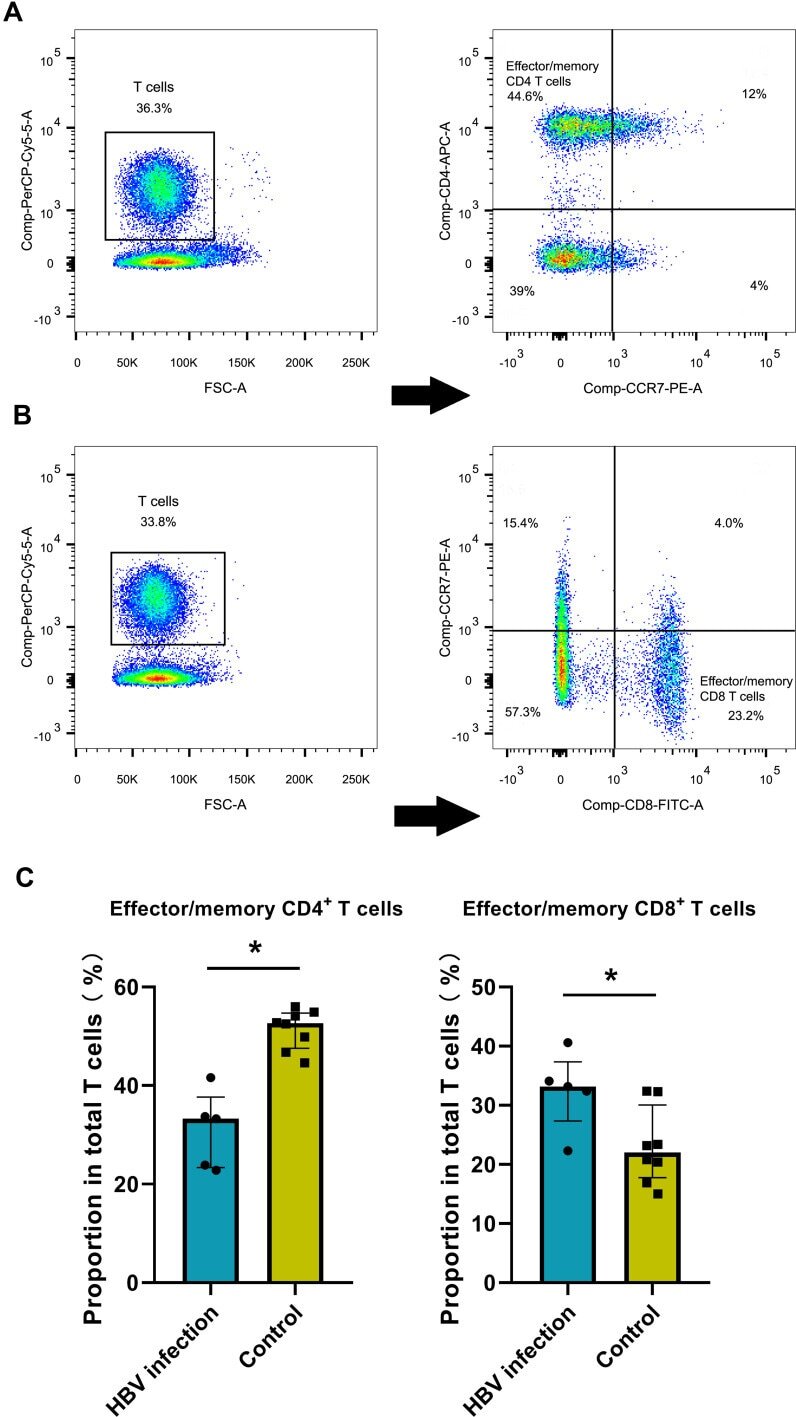
- Figure 2 HBV-related samples display higher proportion of effector/memory CD8+ T cells by flow cytometry assay. ( A ) Examples of CD3, CD4 and CCR7 staining to determine effector/memory CD4+ T cells. ( B ) Examples of CD3, CD8 and CCR7 staining to determine effector/memory CD8+ T cells. ( C ) The average proportion of effector/memory CD4+ T cells and CD8+ T cells in HBV and control groups (*p
- Conjugate
- Yellow dye
- Submitted by
- Invitrogen Antibodies (provider)
- Main image
- Experimental details
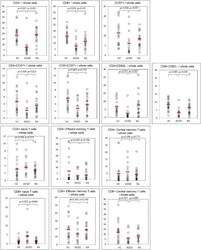
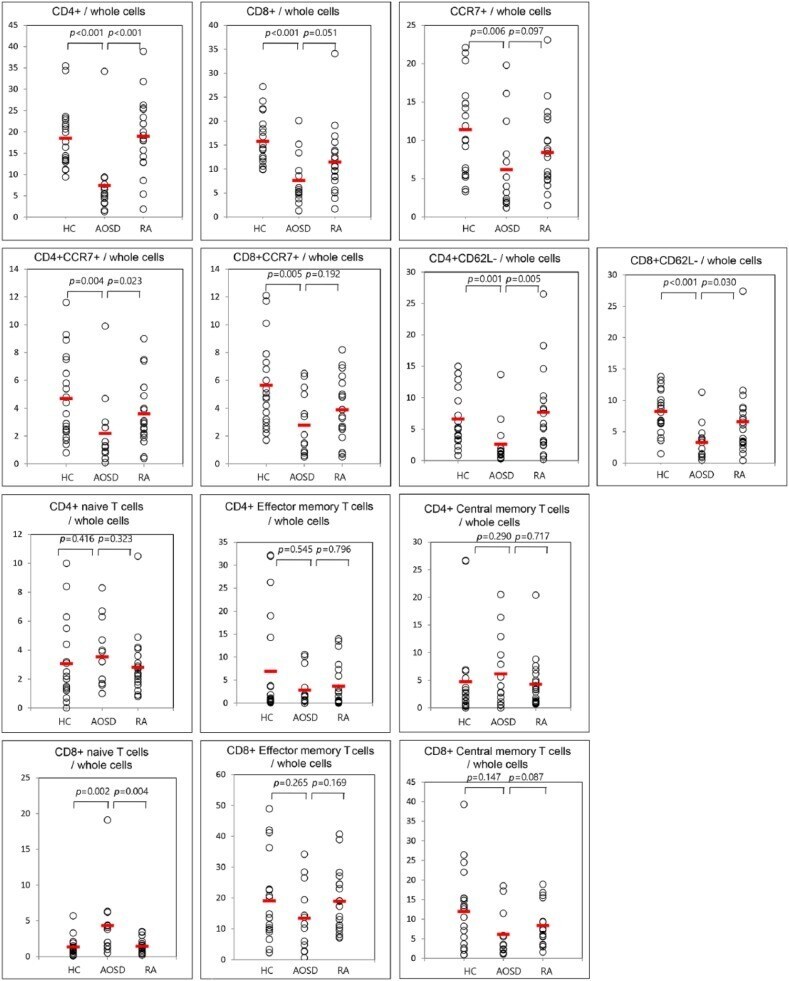
- Figure 2. Percentage of surface-stained cells presenting CD4+, CD8+, CCR7+, CD4+CCR7+, CD8+CCR7+, CD4+CD62L-, CD8+CD62L-, CD4+naive T cell, CD4+ effector memory T cell, CD4+ central memory T cells, CD8+ naive T cells, CD8+ effector memory T cells, and CD8+ central memory T cells in patients with AOSD, a patient with rheumatoid arthritis (RA), and a healthy control (HC). Results were obtained from 14 patients with AOSD, 20 RA patients, and 20 HCs. The horizontal line indicates the mean value for each group. The P value was determined by the Mann-Whitney U test.
- Conjugate
- Yellow dye
- Submitted by
- Invitrogen Antibodies (provider)
- Main image
- Experimental details
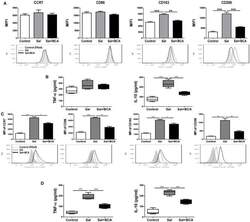
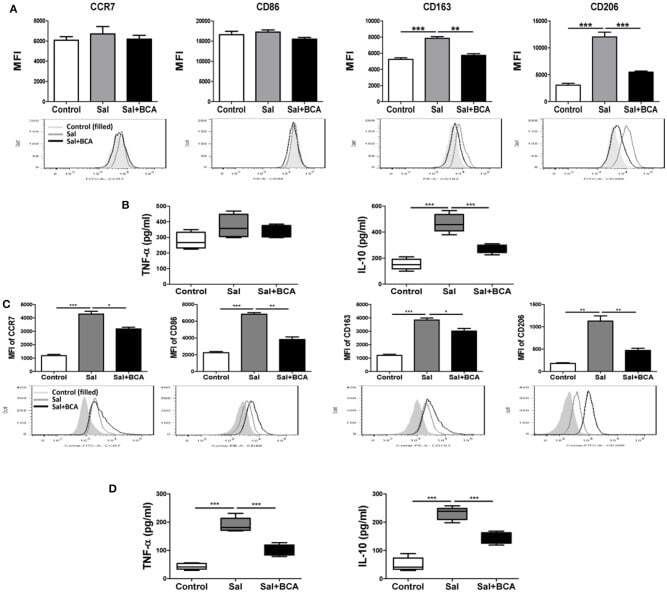
- Figure 7 BCA regulate MPhi polarization in vitro and in vivo . (A,B) Raw246.7 cells were treated with 4 mug/ml BCA for 2 h. Then, the cells were infected with Salmonella at MOI = 10:1 for 2 h. (A) The expression of surface markers (CCR7, CD86, CD163, and CD206) was determined by flow cytometry. The results are presented as MFI. (B) TNF-alpha and IL-10 in the supernatants were detected by ELISA. ** P < 0.01, *** P < 0.001. The data are representative of three experiments with similar results. (C,D) Mice were infected by intragastric administration of an overnight culture of Salmonella (10 5 bacteria in 0.1 ml PBS) through a gavage tube and then treated with 6.25 mg/kg BCA intragastrically by gavage daily (5 mice for each group). On the 5th day p.i., the mice were sacrificed and the peritoneal fluid was collected. (C) The expression of surface markers (CCR7, CD86, CD163, and CD206) in mouse peritoneal MPhis were determined by flow cytometry The results are presented as MFI. (D) TNF-alpha and IL-10 in ascitic fluid were detected by ELISA. * P < 0.05, ** P < 0.01, *** P < 0.001.
- Conjugate
- Yellow dye
- Submitted by
- Invitrogen Antibodies (provider)
- Main image
- Experimental details
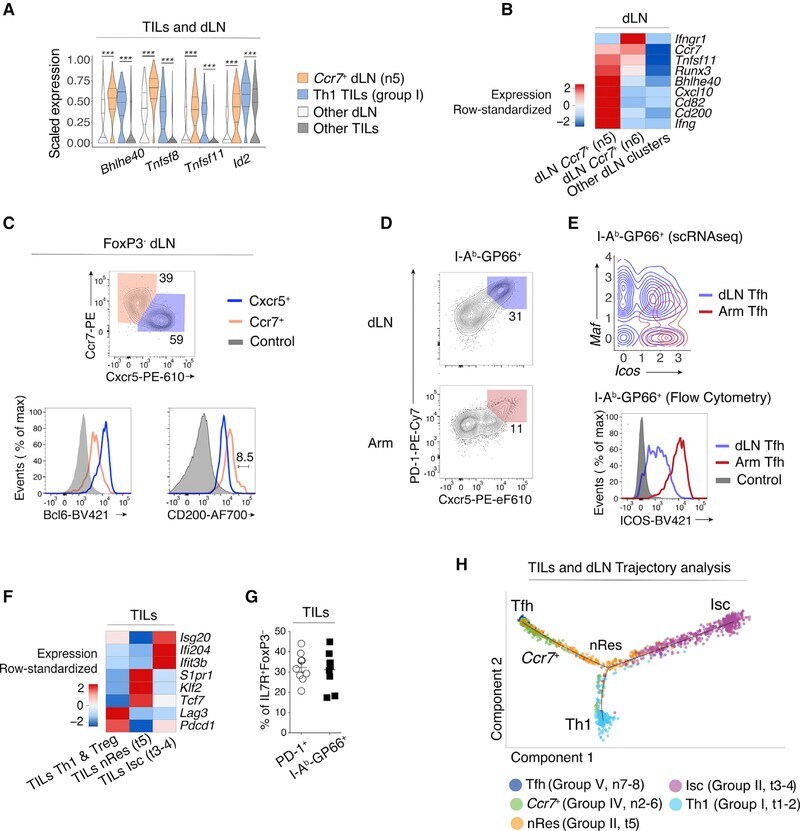
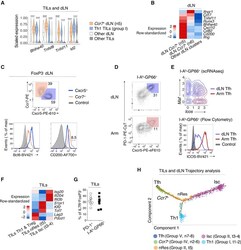
- Figure 4. Transcriptomic Continuum between TIL and dLN Tumor-Reactive Cells (A) Violin plots of differentially expressed genes across TIL group I Th1 and dLN group IV Ccr7 + (clusters t1-2 and n5, respectively, as shown in Figure 1A ), as well as all other TIL and dLN populations. Unpaired t-test; ***p < 0.001. (B) Heatmap shows row-standardized expression of differentially expressed genes across dLN Ccr7 + clusters (group IV n5-6) and other dLN clusters (Treg and Tfh clusters n1 and n7-8, respectively). (C) Flow cytometry contour plots of Cxcr5 versus Ccr7 in Foxp3 - dLN cells (top). Overlaid protein expression of Bcl6 and CD200 in Ccr7 + and Cxcr5 + dLN cells and naive CD4 + splenocytes from tumor-free control mice (bottom). Data are representative of 17 mice analyzed in three experiments. (D) Flow cytometry contour plots of Cxcr5 versus PD-1 in dLN and Arm cells. Data are representative of 10 mice analyzed in two experiments. (E) Contour plot of dLN (red, clusters n7-8) and Arm (blue) Tfh cell distribution according to scRNA-seq-detected normalized expression of Icos versus Maf (top).Overlaid protein expression of ICOS in dLN and Arm PD-1 + Cxcr5 + (Tfh) cells and naive CD4 + splenocytes from tumor-free control mice (bottom). (F) Heatmap shows row-standardized expression of differentially expressed genes across TIL Isc and nRes clusters (as defined in the text, group II t3-4 and t5,respectively) and all other TIL clusters (Th1 and Treg clusters t1-2
- Conjugate
- Yellow dye