Explore
 Validate
 Learn
Learn Western blot
Antibody data
- Antibody Data
- Antigen structure
- References [0]
- Comments [0]
- Validations
- Western blot [3]
- Immunocytochemistry [1]
Submit
Validation data
Reference
Comment
Report error
- Product number
- MA1-24691 - Provider product page

- Provider
- Invitrogen Antibodies
- Product name
- NFkB p65 Monoclonal Antibody (NF-12)
- Antibody type
- Monoclonal
- Antigen
- Recombinant protein fragment
- Description
- Positive Control: 3T3 whole cell extract
- Reactivity
- Human, Mouse
- Host
- Mouse
- Isotype
- IgG
- Antibody clone number
- NF-12
- Vial size
- 50 µL
- Concentration
- 4.8 mg/mL
- Storage
- Store at 4°C short term. For long term storage, store at -20°C, avoiding freeze/thaw cycles.
No comments: Submit comment
Supportive validation
- Submitted by
- Invitrogen Antibodies (provider)
- Main image

- Experimental details
- Western blot of NFkB p65 in whole extract of NIH-3T3 cells using a NFkB p65 monoclonal antibody (Product # MA1-24691) at a dilution of 1:250 (lane 1) 1:500 (lane 2) and 1:1000 (lane 3) followed by detection using a Goat anti-mouse IgG-Peroxidase and chemiluminescent substrate.

- Submitted by
- Invitrogen Antibodies (provider)
- Main image
- Experimental details
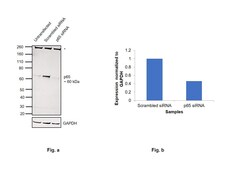
- Knockdown of Transcription factor p65 was achieved by transfecting RAW 264.7 with Transcription factor p65 specific siRNAs (Silencer® select Product # s72857 and s72859). Western Blot analysis (Fig. a) was performed using Whole cell extracts from the Transcription factor p65 knockdown cells (lane 3), non-targeting scrambled siRNA transfected cells (lane 2) and untransfected cells (lane 1). The blot was probed with NFkB p65 Monoclonal Antibody (NF-12) (Product # MA1-24691, 1:1000 dilution) and Goat anti-Mouse IgG (H+L) Superclonal™ Recombinant Secondary Antibody, HRP (Product # A28177, 1:4000). Densitometric analysis of this Western Blot is shown in histogram (Fig. b). Decrease in signal upon siRNA mediated knock down confirms that antibody is specific to Transcription factor p65. An uncharacterized band (*) was observed around 260 kDa.

- Submitted by
- Invitrogen Antibodies (provider)
- Main image

- Experimental details
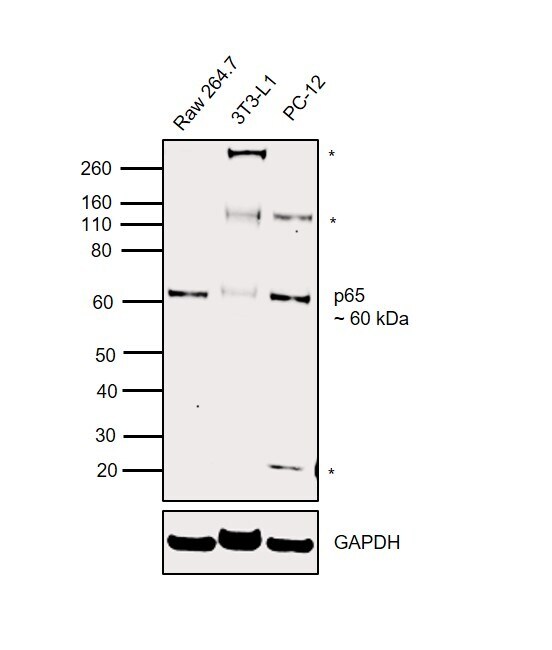
- Western Blot was performed using Anti-NFkB p65 Monoclonal Antibody (NF-12) (Product # MA1-24691) and a 60 kDa band corresponding to Transcription factor p65 was observed across cell lines tested. Whole cell extracts (50 µg lysate) of RAW 264.7 (Lane 1), 3T3-L1 (Lane 2) and PC-12 (Lane 3) were electrophoresed using NuPAGE™ 4-12% Bis-Tris Protein Gel (Product # NP0322BOX). Resolved proteins were then transferred onto a nitrocellulose membrane (Product # IB23001) by iBlot® 2 Dry Blotting System (Product # IB21001). The blot was probed with the primary antibody (1:1000 dilution) and detected by chemiluminescence with Goat anti-Mouse IgG (H+L) Superclonal™ Recombinant Secondary Antibody, HRP (Product # A28177, 1:4000) using the iBright FL 1000 (Product # A32752). Chemiluminescent detection was performed using SuperSignal™ West Dura Extended Duration Substrate (Product # 34076). Uncharacterized bands (*) were observed around 20 kDa, 150 kDa and 260 kDa.
Supportive validation
- Submitted by
- Invitrogen Antibodies (provider)
- Main image

- Experimental details
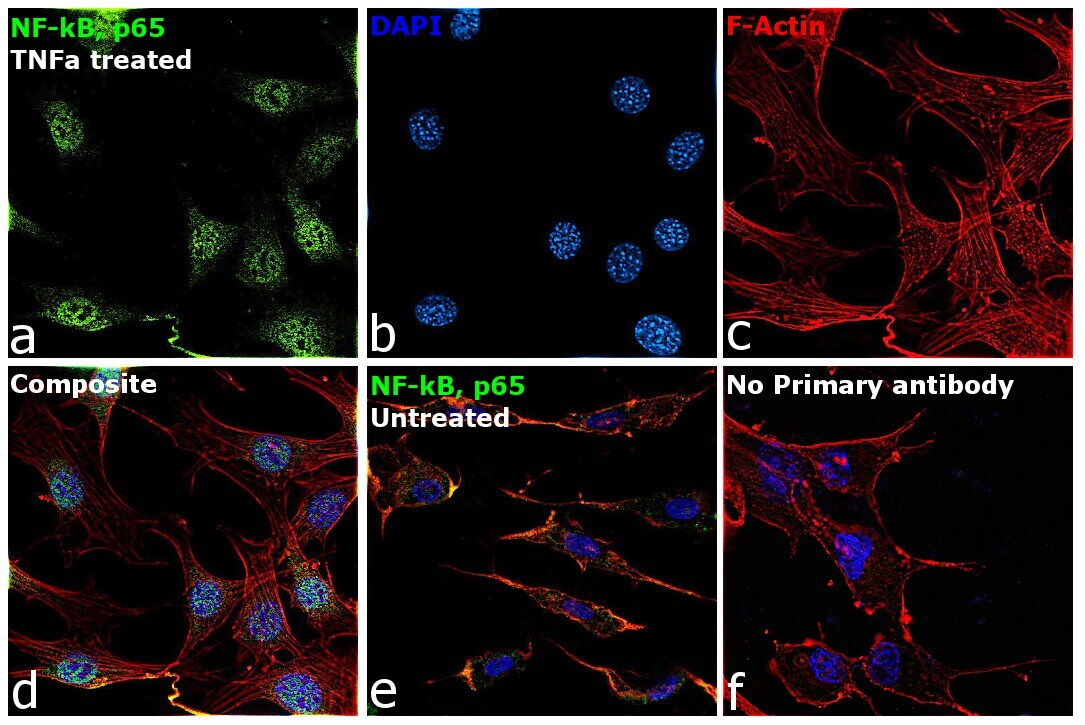
- Immunofluorescence analysis of Transcription factor p65 was performed using NIH/3T3 cells (serum-starved) and NIH/3T3 cells serum-starved for 24 hours, followed by 10 ng/mL mouse TNF alpha treatment for 30 minutes. The cells were fixed with 4% paraformaldehyde for 10 minutes, permeabilized with 0.1% Triton™ X-100 for 15 minutes, and blocked with 2% BSA for 1 hour at room temperature. The cells were labeled with NFkB p65 Monoclonal Antibody (NF-12) (Product # MA1-24691) at 1:100 dilution in 0.1% BSA, incubated at 4 degree celsius overnight and then labeled with Donkey anti-Mouse IgG (H+L) Highly Cross-Adsorbed Secondary Antibody, Alexa Fluor Plus 488 (Product # A32766), (1:2000), for 45 minutes at room temperature (Panel a: Green). Nuclei (Panel b:Blue) were stained with ProLong™ Diamond Antifade Mountant with DAPI (Product # P36962). F-actin (Panel c: Red) was stained with Rhodamine Phalloidin (Product # R415, 1:300). Panel d represents the merged image showing nuclear localization of p65 protein in NIH/3T3 treated cells. Panel e represents the merged image of NIH/3T3 untreated cells, that shows cytoplasmic localization of p65 protein. Panel f represents control cells with no primary antibody to assess background. The images were captured at 60X magnification.