Explore
 Validate
 Learn
LearnPA5-34663
antibody from Invitrogen Antibodies
Targeting: MTOR
FLJ44809, FRAP, FRAP1, FRAP2, RAFT1, RAPT1
 Western blot
 Immunocytochemistry
Antibody data
- Antibody Data
- Antigen structure
- References [10]
- Comments [0]
- Validations
- Immunocytochemistry [3]
- Immunoprecipitation [1]
- Immunohistochemistry [4]
- Chromatin Immunoprecipitation [2]
- Other assay [19]
Submit
Validation data
Reference
Comment
Report error
- Product number
- PA5-34663 - Provider product page

- Provider
- Invitrogen Antibodies
- Product name
- mTOR Polyclonal Antibody
- Antibody type
- Polyclonal
- Antigen
- Recombinant full-length protein
- Description
- Recommended positive controls: 293T, A431, HeLa, HepG2, mouse brain, Flag-human mTOR transfected 293T. Predicted reactivity: Mouse (99%), Rat (100%), Zebrafish (90%), Sheep (98%). Store product as a concentrated solution. Centrifuge briefly prior to opening the vial.
- Reactivity
- Human, Mouse, Rat
- Host
- Rabbit
- Isotype
- IgG
- Vial size
- 100 μL
- Concentration
- 0.05 mg/mL
- Storage
- Store at 4°C short term. For long term storage, store at -20°C, avoiding freeze/thaw cycles.
Submitted references Diane-35 and Metformin Induce Autophagy and Apoptosis in Polycystic Ovary Syndrome Women with Early-Stage Endometrial Carcinoma.
Immunohistochemical Expression Pattern of FGFR1, FGFR2, RIP5, and HIP2 in Developing and Postnatal Kidneys of Dab1(-/-) (yotari) Mice.
Selective Deletion of the Mechanistic Target of Rapamycin From the Renal Collecting Duct Principal Cell in Mice Down-Regulates the Epithelial Sodium Channel.
ACSL4 contributes to sevoflurane-induced ferroptotic neuronal death in SH-SY5Y cells via the 5' AMP-activated protein kinase/mammalian target of rapamycin pathway.
MM-129 as a Novel Inhibitor Targeting PI3K/AKT/mTOR and PD-L1 in Colorectal Cancer.
Implications of cell division cycle associated 4 on the Wilm's tumor cells viability via AKT/mTOR signaling pathway.
Interaction of YAP1 and mTOR promotes bladder cancer progression.
Actionable Cytopathogenic Host Responses of Human Alveolar Type 2 Cells to SARS-CoV-2.
Inhibition of glucose metabolism selectively targets autoreactive follicular helper T cells.
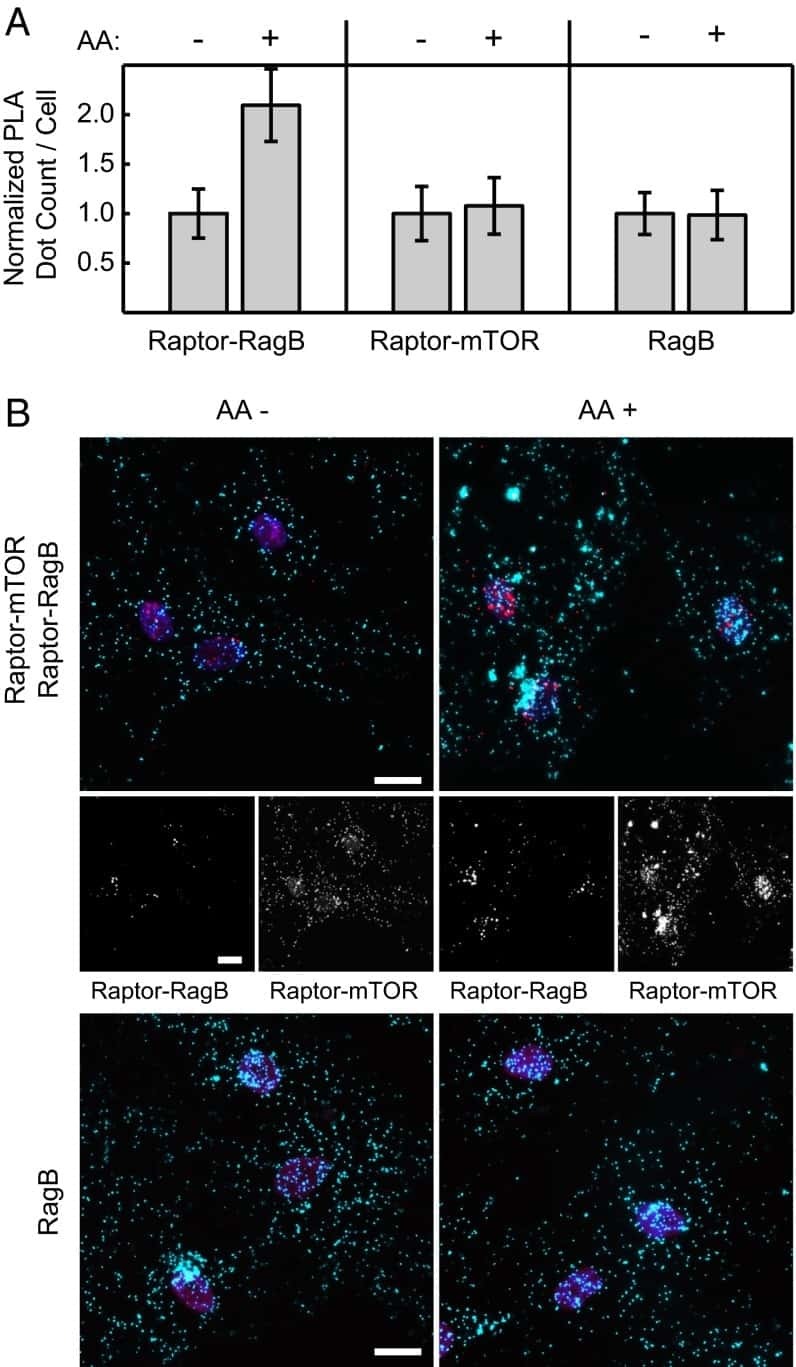
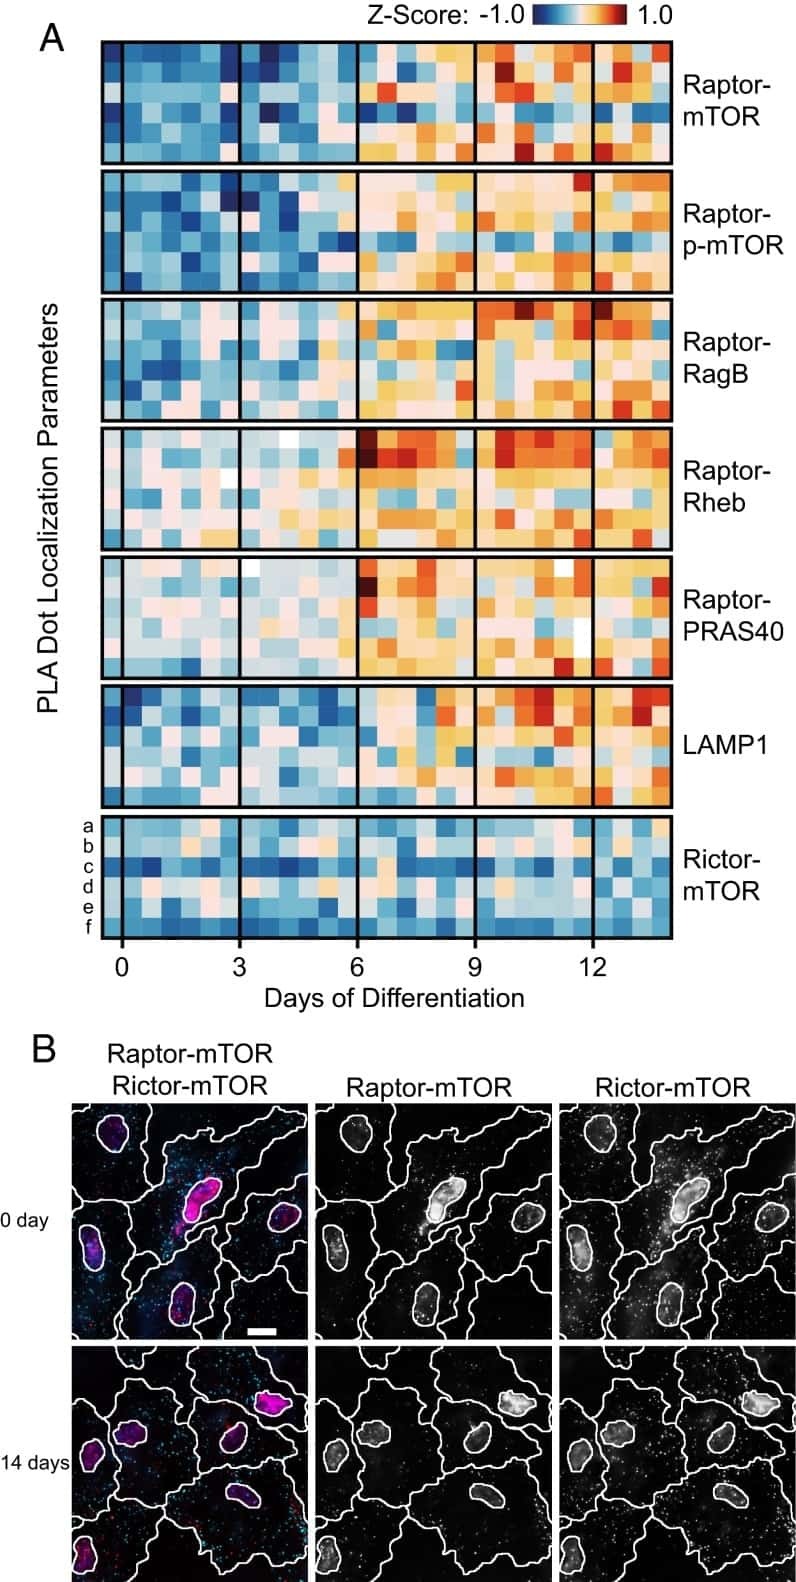
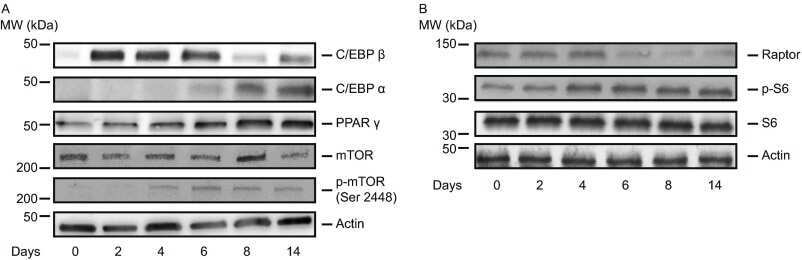
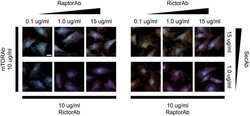
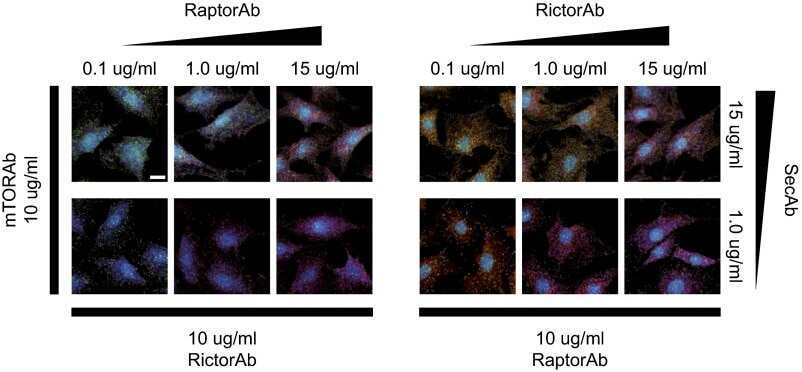
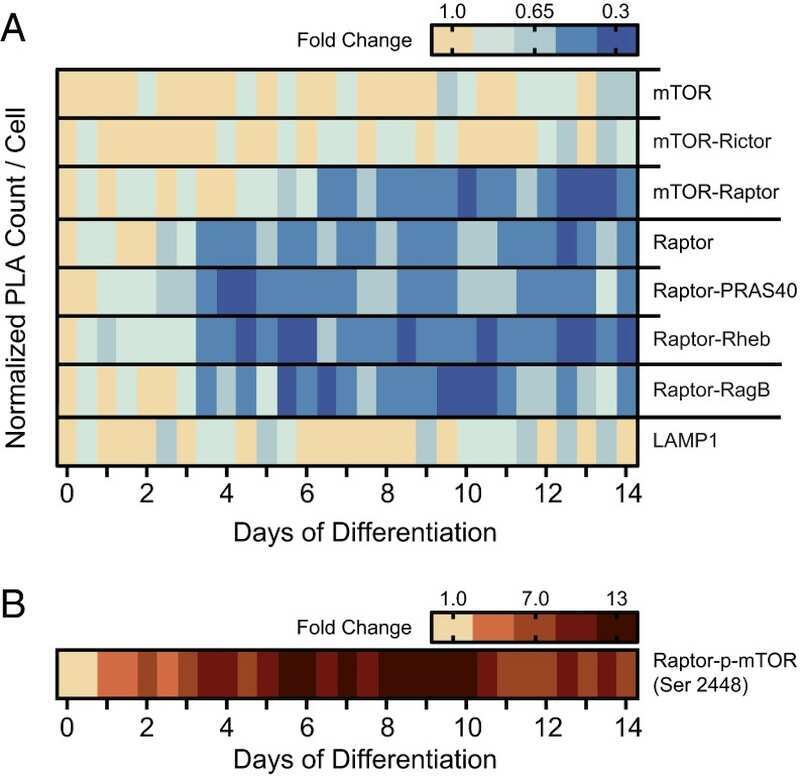
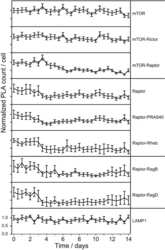
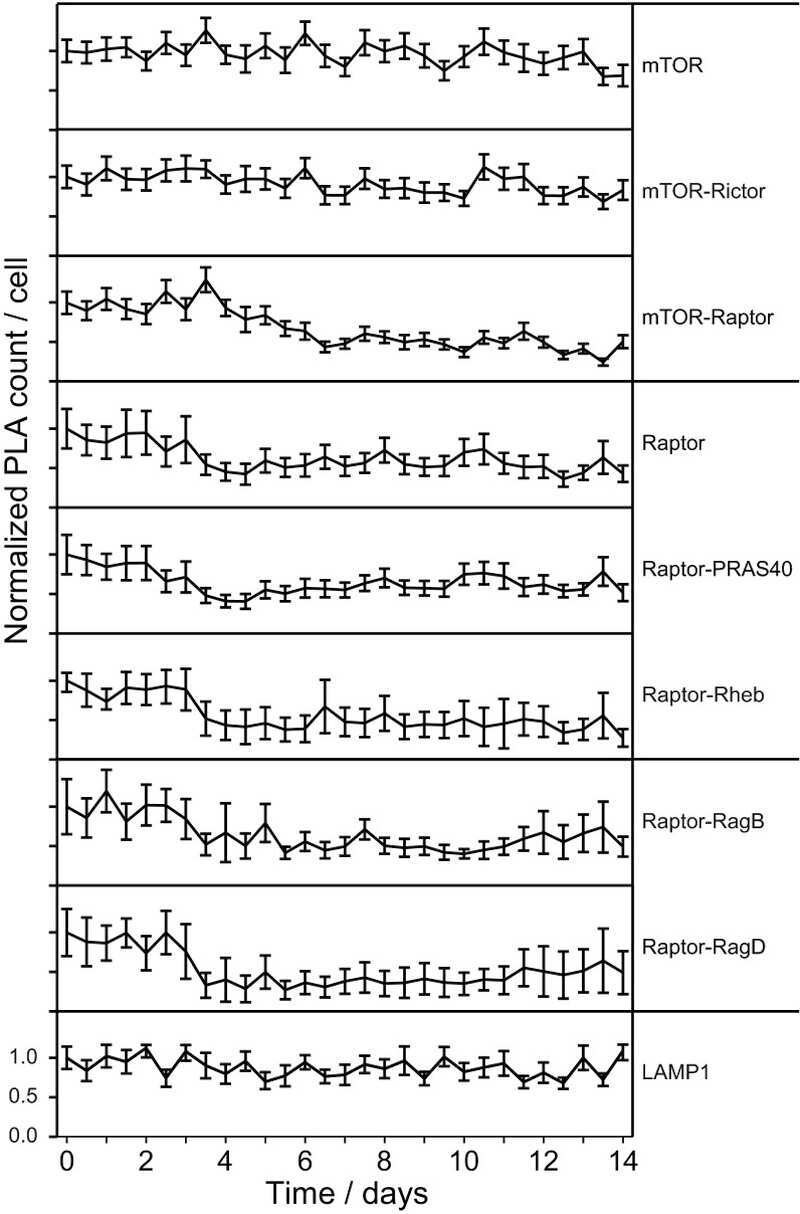
In situ characterization of the mTORC1 during adipogenesis of human adult stem cells on chip.
Liu Y, Wang Y, Yao D, Chen X, Zhang F, Feng Y, Li X
Genes 2022 Jan 12;13(1)
Genes 2022 Jan 12;13(1)
Immunohistochemical Expression Pattern of FGFR1, FGFR2, RIP5, and HIP2 in Developing and Postnatal Kidneys of Dab1(-/-) (yotari) Mice.
Kelam N, Racetin A, Katsuyama Y, Vukojević K, Kostić S
International journal of molecular sciences 2022 Feb 11;23(4)
International journal of molecular sciences 2022 Feb 11;23(4)
Selective Deletion of the Mechanistic Target of Rapamycin From the Renal Collecting Duct Principal Cell in Mice Down-Regulates the Epithelial Sodium Channel.
Chen B, Fluitt MB, Brown AL, Scott S, Gadicherla A, Ecelbarger CM
Frontiers in physiology 2021;12:787521
Frontiers in physiology 2021;12:787521
ACSL4 contributes to sevoflurane-induced ferroptotic neuronal death in SH-SY5Y cells via the 5' AMP-activated protein kinase/mammalian target of rapamycin pathway.
Cheng L, Zhu X, Liu Y, Zhu K, Lin K, Li F
Annals of translational medicine 2021 Sep;9(18):1454
Annals of translational medicine 2021 Sep;9(18):1454
MM-129 as a Novel Inhibitor Targeting PI3K/AKT/mTOR and PD-L1 in Colorectal Cancer.
Hermanowicz JM, Pawlak K, Sieklucka B, Czarnomysy R, Kwiatkowska I, Kazberuk A, Surazynski A, Mojzych M, Pawlak D
Cancers 2021 Jun 26;13(13)
Cancers 2021 Jun 26;13(13)
Implications of cell division cycle associated 4 on the Wilm's tumor cells viability via AKT/mTOR signaling pathway.
Li S, Qin C, Chen Y, Wei D, Tan Z, Meng J
Renal failure 2021 Dec;43(1):1470-1478
Renal failure 2021 Dec;43(1):1470-1478
Interaction of YAP1 and mTOR promotes bladder cancer progression.
Xu M, Gu M, Zhou J, Da J, Wang Z
International journal of oncology 2020 Jan;56(1):232-242
International journal of oncology 2020 Jan;56(1):232-242
Actionable Cytopathogenic Host Responses of Human Alveolar Type 2 Cells to SARS-CoV-2.
Hekman RM, Hume AJ, Goel RK, Abo KM, Huang J, Blum BC, Werder RB, Suder EL, Paul I, Phanse S, Youssef A, Alysandratos KD, Padhorny D, Ojha S, Mora-Martin A, Kretov D, Ash PEA, Verma M, Zhao J, Patten JJ, Villacorta-Martin C, Bolzan D, Perea-Resa C, Bullitt E, Hinds A, Tilston-Lunel A, Varelas X, Farhangmehr S, Braunschweig U, Kwan JH, McComb M, Basu A, Saeed M, Perissi V, Burks EJ, Layne MD, Connor JH, Davey R, Cheng JX, Wolozin BL, Blencowe BJ, Wuchty S, Lyons SM, Kozakov D, Cifuentes D, Blower M, Kotton DN, Wilson AA, Mühlberger E, Emili A
Molecular cell 2020 Dec 17;80(6):1104-1122.e9
Molecular cell 2020 Dec 17;80(6):1104-1122.e9
Inhibition of glucose metabolism selectively targets autoreactive follicular helper T cells.
Choi SC, Titov AA, Abboud G, Seay HR, Brusko TM, Roopenian DC, Salek-Ardakani S, Morel L
Nature communications 2018 Oct 22;9(1):4369
Nature communications 2018 Oct 22;9(1):4369
In situ characterization of the mTORC1 during adipogenesis of human adult stem cells on chip.
Wu X, Schneider N, Platen A, Mitra I, Blazek M, Zengerle R, Schüle R, Meier M
Proceedings of the National Academy of Sciences of the United States of America 2016 Jul 19;113(29):E4143-50
Proceedings of the National Academy of Sciences of the United States of America 2016 Jul 19;113(29):E4143-50
No comments: Submit comment
Supportive validation
- Submitted by
- Invitrogen Antibodies (provider)
- Main image
- Experimental details
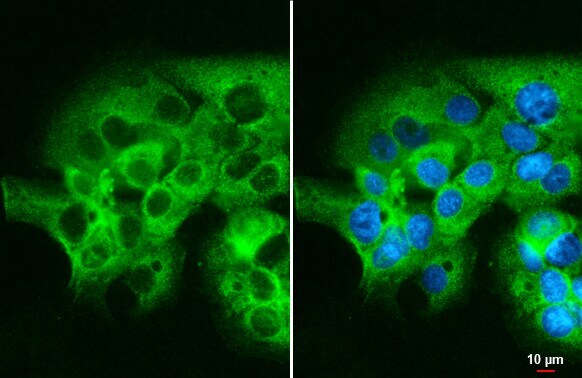
- Immunofluorescent analysis of mTOR showing staining in the cytoplasm and nucleus of MCF-7 cells. MCF-7 cells were fixed in 100% MeOH for 5 min and stained using a mTOR polyclonal antibody (Product # PA5-34663) diluted at 1:500. Blue: Hoechst 33342 staining.
- Submitted by
- Invitrogen Antibodies (provider)
- Main image

- Experimental details
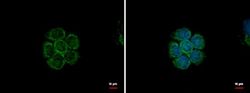
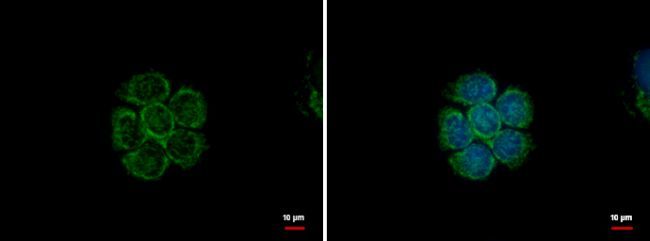
- Immunocytochemistry-Immunofluorescence analysis of mTOR was performed in MCF-7 cells fixed in ice-cold MeOH for 5 min. Green: mTOR Polyclonal Antibody (Product # PA5-34663) diluted at 1:2000. Blue: Hoechst 33342 staining. Scale bar = 10 µm.

- Submitted by
- Invitrogen Antibodies (provider)
- Main image

- Experimental details
- Immunocytochemistry-Immunofluorescence analysis of mTOR was performed in MCF-7 cells fixed in ice-cold MeOH for 5 min. Green: mTOR Polyclonal Antibody (Product # PA5-34663) diluted at 1:2000. Blue: Hoechst 33342 staining. Scale bar = 10 µm.
Supportive validation
- Submitted by
- Invitrogen Antibodies (provider)
- Main image

- Experimental details
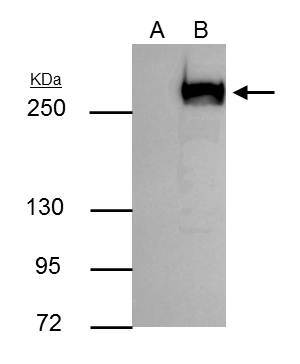
- mTOR antibody immunoprecipitates mTOR protein in IP experiments. IP Sample: 293T whole cell lysate/extract A : Control with 3 µg of pre-immune rabbit IgG B : Immunoprecipitation of mTOR by 3 µg of mTOR antibody (Product # PA5-34663) 5% SDS-PAGE The immunoprecipitated mTOR protein was detected by mTOR antibody (Product # PA5-34663) diluted at 1:1,000. Anti-rabbit IgG (HRP) was used as a secondary reagent.
Supportive validation
- Submitted by
- Invitrogen Antibodies (provider)
- Main image
- Experimental details
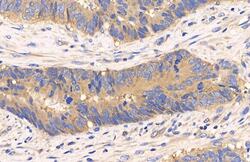
- mTOR Polyclonal Antibody detects mTOR protein at cytoplasm by immunohistochemical analysis (Autostainer Formulated). Sample: Paraffin-embedded human colon cancer. mTOR stained by mTOR Polyclonal Antibody (Product # PA5-34663) diluted at 1:500. Antigen Retrieval: Citrate buffer, 20 min.

- Submitted by
- Invitrogen Antibodies (provider)
- Main image

- Experimental details
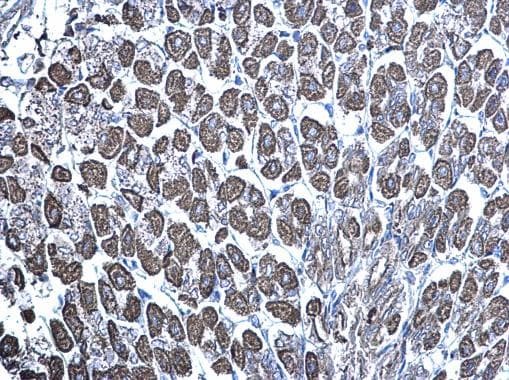
- mTOR Polyclonal Antibody detects mTOR protein at mitochondria on mouse stomach by immunohistochemical analysis. Sample: Paraffin-embedded mouse stomach. MTOR Polyclonal Antibody (Product # PA5-34663) diluted at 1:500. Antigen Retrieval: EDTA based buffer, pH 8.0, 15 min.
- Submitted by
- Invitrogen Antibodies (provider)
- Main image
- Experimental details
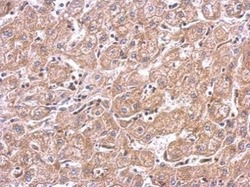
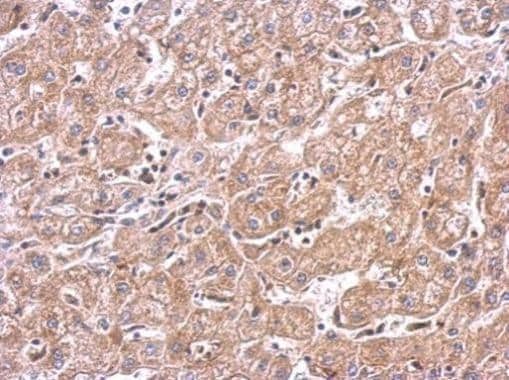
- mTOR antibody detects FRAP1 protein at cytosol on human hepatoma by immunohistochemical analysis. Sample: Paraffin-embedded hepatoma. MTOR antibody (Product # PA5-34663) dilution: 1:500. Antigen Retrieval: EDTA based buffer, pH 8.0, 15 min.
- Submitted by
- Invitrogen Antibodies (provider)
- Main image
- Experimental details
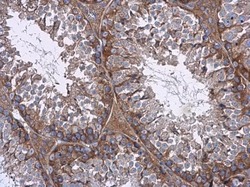
- Immunohistochemistry (Paraffin) analysis of mTOR was performed in paraffin-embedded mouse testis tissue using mTOR Polyclonal Antibody (Product # PA5-34663) at a dilution of 1:500.

Supportive validation
- Submitted by
- Invitrogen Antibodies (provider)
- Main image

- Experimental details
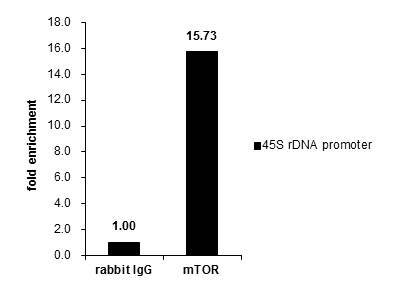
- Cross-linked ChIP was performed with 293T chromatin extract and 5 µg of either control rabbit IgG or mTOR Polyclonal Antibody (Product # PA5-34663). The precipitated DNA was detected by PCR with primer set targeting to 45S rDNA promoter.

- Submitted by
- Invitrogen Antibodies (provider)
- Main image

- Experimental details
- Cross-linked ChIP was performed with 293T chromatin extract and 5 µg of either control rabbit IgG or mTOR Polyclonal Antibody (Product # PA5-34663). The precipitated DNA was detected by PCR with primer set targeting to 45S rDNA promoter.
Supportive validation
- Submitted by
- Invitrogen Antibodies (provider)
- Main image
- Experimental details
- NULL
- Submitted by
- Invitrogen Antibodies (provider)
- Main image
- Experimental details
- NULL
- Submitted by
- Invitrogen Antibodies (provider)
- Main image
- Experimental details
- NULL
- Submitted by
- Invitrogen Antibodies (provider)
- Main image
- Experimental details
- NULL
- Submitted by
- Invitrogen Antibodies (provider)
- Main image

- Experimental details
- NULL
- Submitted by
- Invitrogen Antibodies (provider)
- Main image
- Experimental details
- NULL
- Submitted by
- Invitrogen Antibodies (provider)
- Main image
- Experimental details
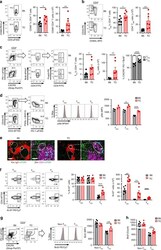
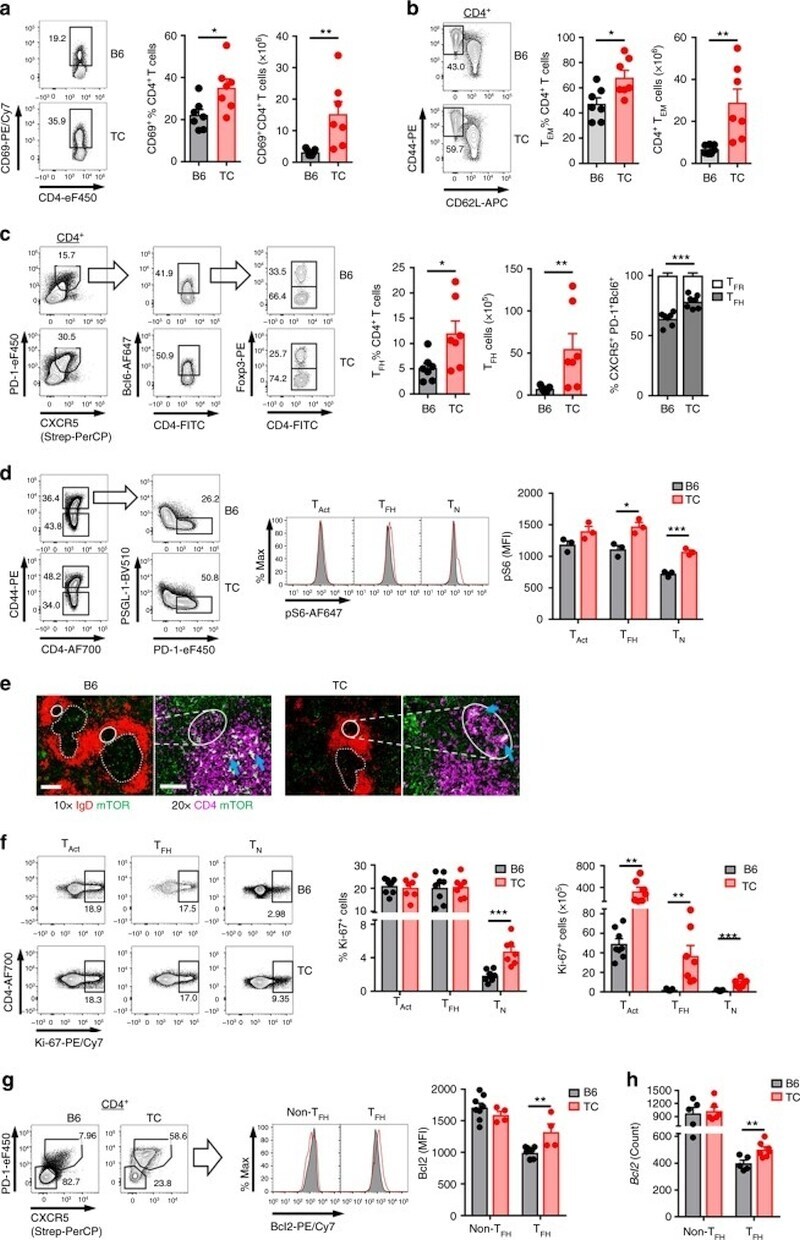
- Fig. 1 Increased mTORC1 activity and survival in TC T FH cells. a - c Frequency and cell number of CD69 + ( a ), CD4 + CD44 + CD62L - T EM cells ( b ), and CD4 + CXCXR5 + PD1 + Bcl6 + Foxp3 - T FH ( c ) in CD4 + T cells, with the relative distribution of T FH and Foxp3 + T FR cells in CD4 + CXCXR5 + PD1 + Bcl6 + cells. d Mean fluorescence intensity (MFI) of phospho-S6 in T N cells (CD4 + CD44 - ), T Act cells (CD4 + CD44 + ), and T FH cells (CD4 + CD44 + PD-1 hi PSGL-1 lo ). e Representative mTOR staining (green) in the GC (plain line) and T cell zone (dashed line) relative to non-GC B cells (IgD + red) and CD4 + T cells (purple). Arrows point to examples of mTOR staining. Scale bars: 200 muM for 10x and 10 muM for 20x. f Frequency and number of Ki-67 + proliferating T N , T Act , and T FH cells. g Bcl2 MFI in CD4 + CXCXR5 + PD1 + T FH and CD4 + CXCXR5 - PD1 - non-T FH cells, with representative FACS plots on the left. h Bcl2 mRNA expression in T FH and non-T FH cells as determined with a Nanostring custom panel. Spleens from 9-month-old B6 and TC mice, mean + s.e.m. of N = 3-8 mice per group compared with t tests. * P < 0.05, ** P < 0.01, and *** P < 0.001
- Submitted by
- Invitrogen Antibodies (provider)
- Main image

- Experimental details
- mTOR antibody immunoprecipitates mTOR protein in IP experiments. IP Sample: 293T whole cell lysate/extract A : Control with 3 µg of pre-immune rabbit IgG B : Immunoprecipitation of mTOR by 3 µg of mTOR antibody (Product # PA5-34663) 5% SDS-PAGE The immunoprecipitated mTOR protein was detected by mTOR antibody (Product # PA5-34663) diluted at 1:1,000. Anti-rabbit IgG (HRP) was used as a secondary reagent.

- Submitted by
- Invitrogen Antibodies (provider)
- Main image
- Experimental details
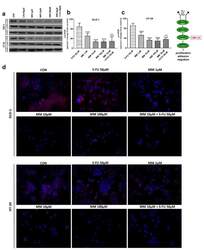
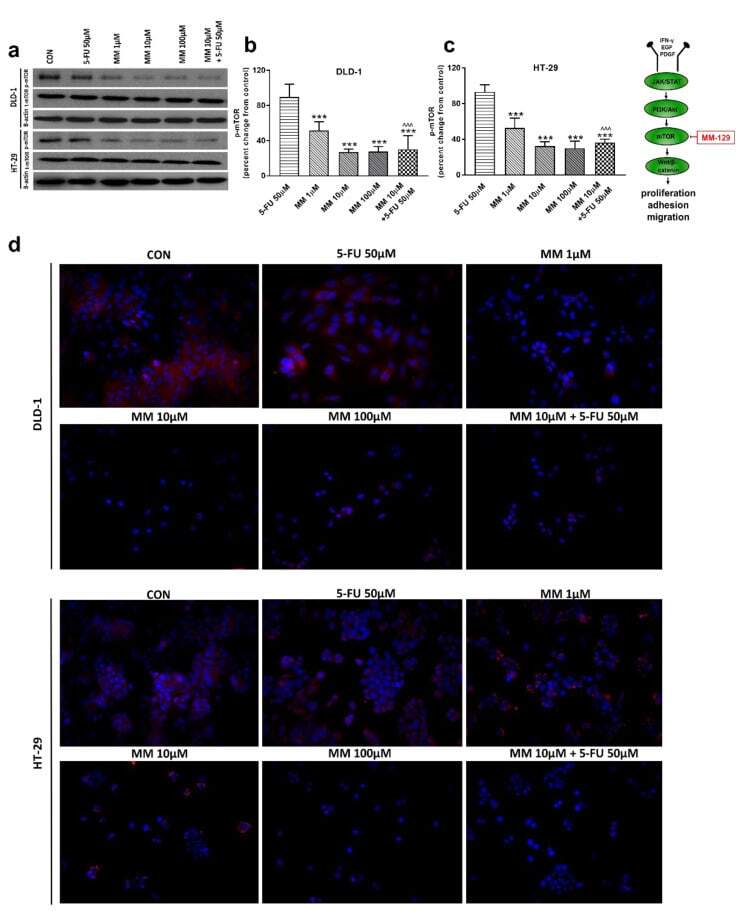
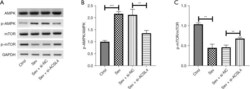
- Figure 4 Phosphorylated mTOR (p-mTOR), total mTOR (t-mTOR), and beta-actin expression as determined by Western blot ( a ) and phosphorylated mTOR (p-mTOR) determined by confocal microscopy ( d ) in DLD-1 and HT-29 cells treated with 5-FU (5-FU 50 uM), MM-129 (MM 1 uM, 10 uM, 100 uM), and their combination (MM 10 uM + 5-FU 50 uM) for 24 h. The samples used for electrophoresis consisted of 20 ug of protein from 6 pooled cell extracts. The samples used for electrophoresis consisted of 20 ug of protein from 6 pooled cell extracts from independent experiments ( n = 6). Band staining was quantified by densitometry ( b , c ). The corresponding uncropped blots are shown in Supplementary Figures S3a-c and S4a-c . Cells were incubated with rabbit polyclonal antibody against phospho mTOR and secondary goat polyclonal antibody against rabbit (red label). The nuclei were stained with Hoechst 33342 (blue label) ( d ). The results are presented as means +- SDs; *** p < 0.001 vs. CON, ^^^ p < 0.001 vs. 5-FU.
- Submitted by
- Invitrogen Antibodies (provider)
- Main image
- Experimental details
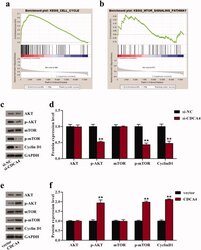
- Figure 4. CDCA4 affected cell cycle and AKT/mTOR signaling pathway. (a-b) GSEA was utilized to identify the relative signaling pathway associated with high CDCA4 expression. (c-f) The effects of CDCA4-knockdown (c-d) and -overexpression (e-f) on the AKT/mTOR relative markers and Cyclin D1 protein were evaluated using western blot analysis. (d) Quantification of c. (f) Quantification of e. ** p < 0.01 vs . si-NC or vector group.

- Submitted by
- Invitrogen Antibodies (provider)
- Main image
- Experimental details
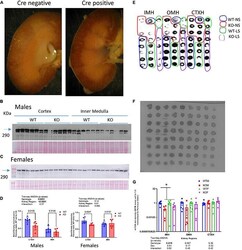
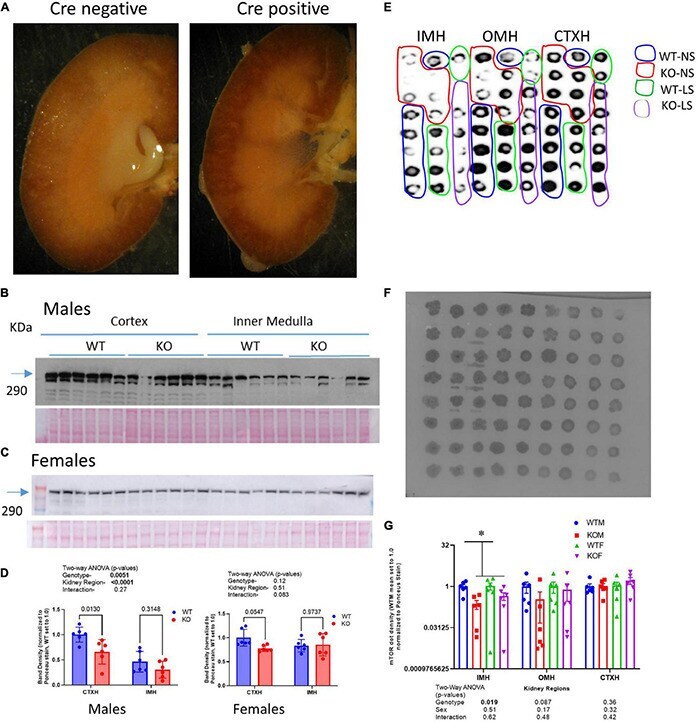
- FIGURE 1 Characterizing the CD-principal-cell targeted mTOR deletion. (A) To evaluate cellular location of Cre-recombinase activity, LacZ reporter mice were crossed with Aqp2 c re transgenic mice and the kidneys of offspring probed for beta-galactosidase activity- blue stain; left (Cre-negative); right (Cre-positive) demonstrating staining specific to renal collecting duct in Cre positive mice. mTOR CD-KO mice were generating by crossing male Mtor t m1.2K oz /J with female Aqp2 c re mice. Western blots of cortex and inner medulla homogenates (equal amounts of protein were loaded in each lane, 10 mug/lane) from wild-type (WT) and knockout (KO) (B) male and (C) female mice ( n = 6/group) probed with anti-mTOR polyclonal antibody; (D) densitometric summaries of western blotting of mTOR in cortex (CTXH) and inner medullary homogenates (IMH, mean +- sem); (E) dot blot of inner medulla (IMH), outer medulla (OMH), and cortex (CTXH) homogenates (2 mul/dot) from WT and KO male and female mice ( n = 6/group) probed with anti-mTOR antibody. (F) Ponceau S staining of proteins on dot blot for loading correction of mTOR dot blot; (G) density summary of dots normalized by Ponceau intensity. Two-way ANOVA (genotype x sex) is shown below bars; * indicates a significant ( p < 0.05) difference between WT and KO.
- Submitted by
- Invitrogen Antibodies (provider)
- Main image

- Experimental details
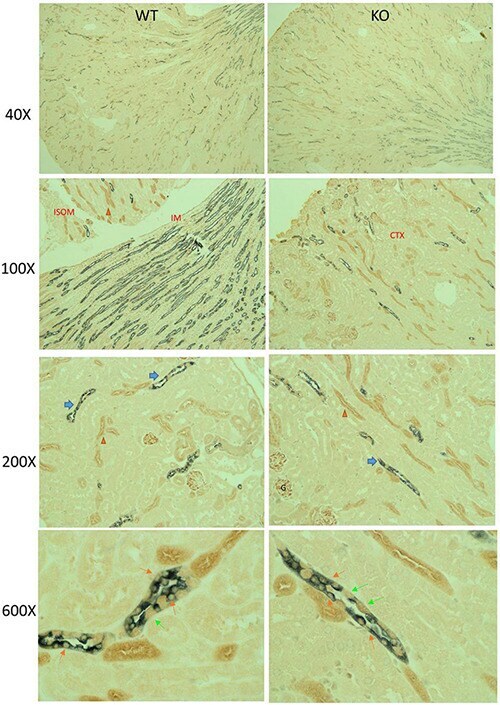
- FIGURE 2 Mechanistic Target of Rapamycin (mTOR) immunohistochemistry (IHC) in mouse kidney. Paraffin-embed kidney coronal sections were prepared for double-labeling IHC by standard chromogenic approaches; mTOR (brown) and AQP2 (gray) in male KO and WT mouse kidneys under control dietary conditions. Sections were imaged at 40x, 100x, 200x, and 600x total magnification, as indicated. At 200x, blue and orange arrows point to collecting duct and thick ascending limbs, respectively, which displayed relatively stronger mTOR labeling than other cells of the kidney (including proximal tubule). Glomerular (G) also displayed strong mTOR labeling. Under 600x, orange and lime-green arrows indicate principal and intercalated cells, respectively. Principal cells were identified by dual gray and brown label. KO mice had reduced brown labeling in cells co-staining with gray.
- Submitted by
- Invitrogen Antibodies (provider)
- Main image
- Experimental details
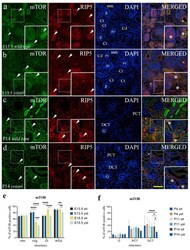
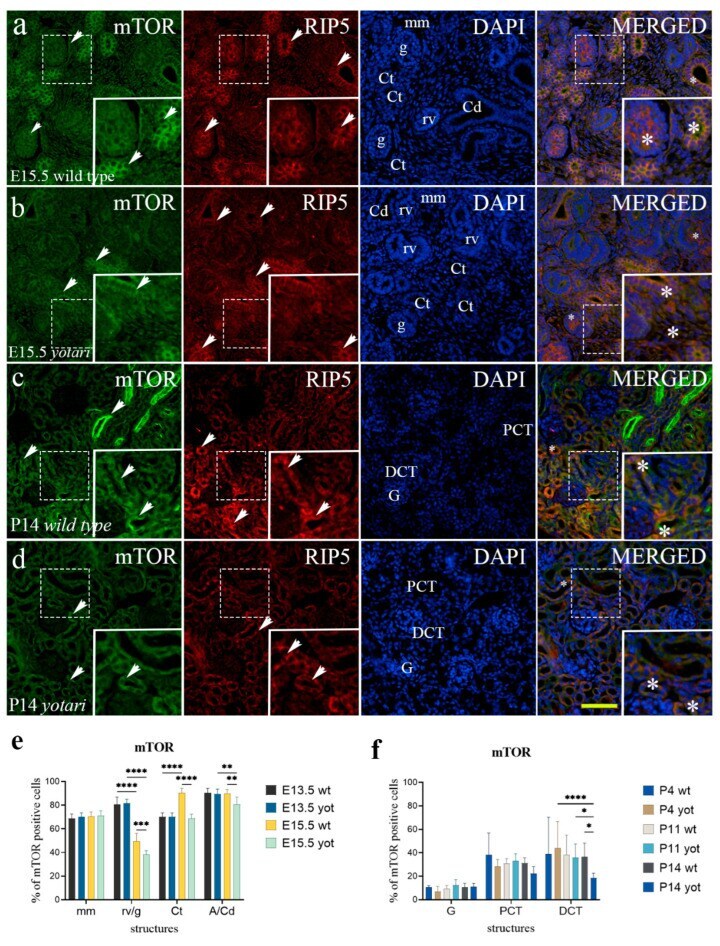
- Double immunofluorescence staining of embryonic wild-type ( a ) and yotari ( b ) and postnatal wild-type ( c ) and yotari ( d ) mouse kidneys with the mTOR and RIP5 markers. Arrows show the expression pattern of mTOR and RIP5 in the mesenchyme (mm), renal vesicles (rv), immature glomeruli (g), convoluted tubules (Ct), ampullae (A), and collecting ducts (Cd), glomeruli (G), proximal convoluted tubules (PCT) and distal convoluted tubules (DCT) indicated on 4',6-diamidino-2-phenylindole (DAPI) image. Immunoexpression of mTOR, RIP5, DAPI staining and merged mTOR, RIP5, and DAPI at embryonic day E15.5 in wild type ( a ) and yotari ( b ). Immunoexpression of mTOR, RIP5, DAPI staining and merged mTOR, RIP5, and DAPI at postnatal day 14 (P14) in wild type ( c ) and yotari ( d ). Wild-type and yotari mice at embryonic day E13.5 of kidney development mostly correspond regarding localization and intensity of mTOR; thus, a representative image was selected from E15.5. Wild-type and yotari mice at postnatal day 4 (P4) and 11 (P11) of kidney development mostly correspond regarding localization and intensity of mTOR; thus, a representative image was selected from P14. The most prominent protein expression area is shown in inserts, corresponding to the dashed boxes. An asterisk denotes the zone where co-expression was detected. Images were taken on magnification x40. The scale bar is 50 mum, which refers to all images. The distribution of the percentages of mTOR positive cells in the metanep
- Submitted by
- Invitrogen Antibodies (provider)
- Main image
- Experimental details
- Figure 5 ACSL4 regulated the AMPK/mTOR pathway in sev-stimulated SH-SY5Y cells. SH-SY5Y cells were transfected with si- ACSL4 or si-NC for 24 h and treated with 4.1% sev for 6 h, and then tested for the expression of AMPK, pAMPK, mTOR, and p-mTOR using western blot. (A) Representative images for western blot of AMPK, pAMPK, mTOR, and p-mTOR expression in SH-SY5Y cells are shown. Quantification of (B) p-AMPK/AMPK and (C) p-mTOR/mTOR ratios in SH-SY5Y cells. **, P

- Submitted by
- Invitrogen Antibodies (provider)
- Main image

- Experimental details
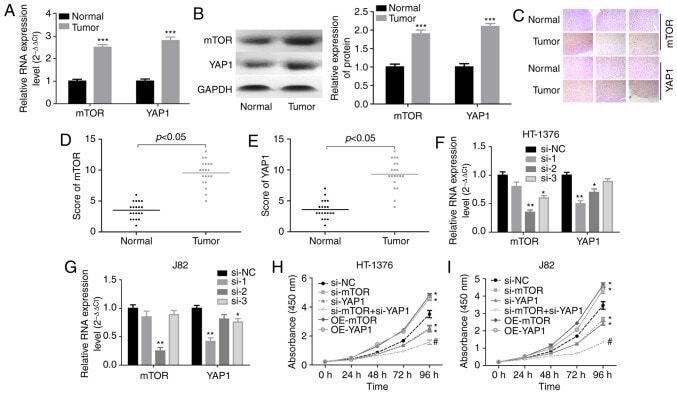
- Figure 1 Knockdown of YAP1 and mTOR inhibited the progression of bladder cancer. (A and B) RT-PCR and western blot assays were performed to test the expression of YAP1 and mTOR in bladder cancer and normal bladder tissues ( *** P
- Submitted by
- Invitrogen Antibodies (provider)
- Main image

- Experimental details
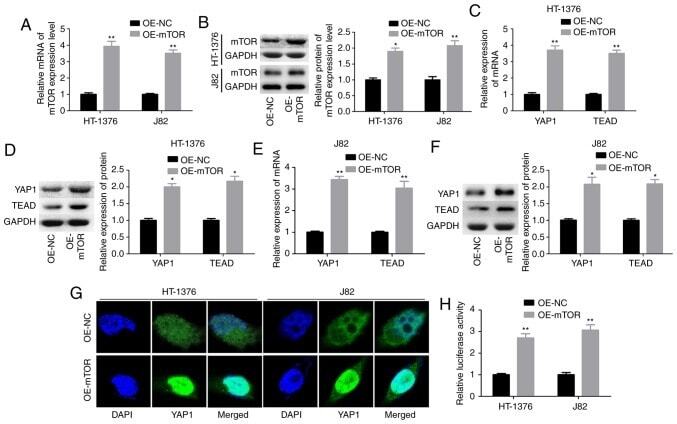
- Figure 2 Crosstalk between the YAP1 and mTOR proteins. (A and B) HT-1376 and J82 cells were transfected with OE-mTOR and OE-NC; then cells were harvested and subjected to RT-PCR and western blot assays to determine the expression of mTOR at the mRNA and protein levels, respectively. (C-F) RT-PCR and western blot assays were performed to determine the mRNA and protein expression of YAP1 and TEAD after 48 h of HT-1376 and J82 cell transfection with OE-mTOR or OE-NC. (G) Immunofluorescence assay was performed to evaluate the effects of subcellular location of the YAP1 protein. (H) Statistical analysis of the fluorescence intensity of the YAP1 protein ( * P
- Submitted by
- Invitrogen Antibodies (provider)
- Main image

- Experimental details
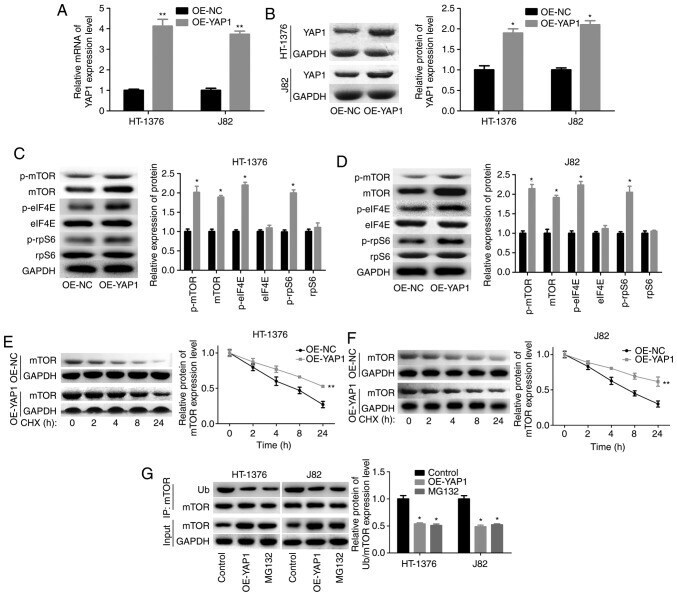
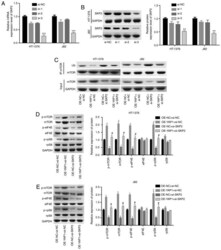
- Figure 3 Upregulation of YAP1 promoted the expression and protein stability of mTOR. (A and B) HT-1376 and J82 cells were transfected with OE-YAP1 and OE-NC; then, the cells were harvested and subjected to RT-PCR and western blot assays to determine the expression of YAP1. (C and D) western blotting assays were performed to determine the protein expression and phosphorylation of mTOR, p-mTOR, p-eIF4E, eIF4E, p-rpS6 and rpS6 after HT-1376 and J82 cells were transfected with OE-YAP1 or OE-NC. (E and F) After HT-1376 and J82 cells were transfected with OE-YAP1 and OE-NC for 24 h, they were incubated with 100 ug/ml CHX for 0, 1, 2, 4, 8 and 24 h; then, cells were harvested and protein samples were extracted for western blotting with mTOR antibody. (G) Immunoprecipitation (IP) assay was performed to explore the effects of YAP1 upregulation or MG132 on mTOR expression and ubiquitination in HT-1376 and J82 cells ( * P
- Submitted by
- Invitrogen Antibodies (provider)
- Main image
- Experimental details
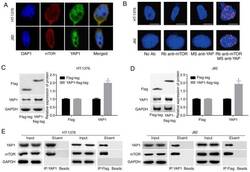
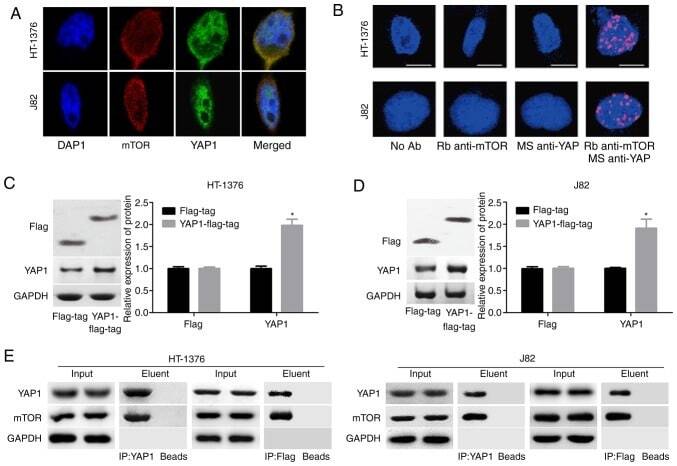
- Figure 4 Interaction between YAP1 protein and mTOR protein in HT-1376 and J82 cells. (A) Immunofluorescence assay was performed to evaluate the subcellular localization of the YAP1 and SKP2 proteins. (B) Duolink assay was performed to evaluate the subcellular localization of the YAP1 and mTOR proteins. (C and D) Western blotting was performed to assess the expression of flag and YAP1 after J82 and HT-1376 cells were transfected with flag-tag or YAP1-flag-tag vector ( * P
- Submitted by
- Invitrogen Antibodies (provider)
- Main image
- Experimental details
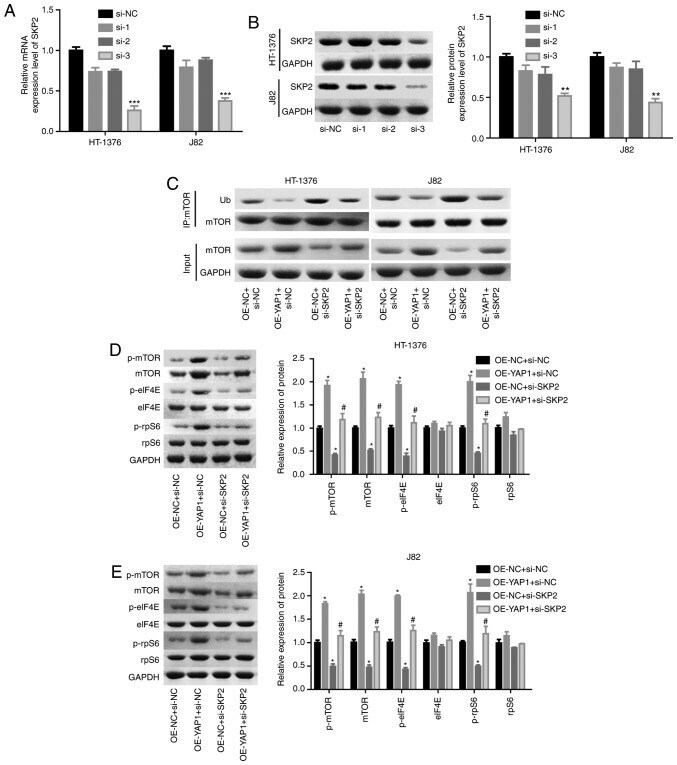
- Figure 6 Detection of the effects of YAP1/SKP2 axis on mTOR ubiquitination and bladder cancer progression. (A and B) HT-1376 and J82 cells were trans-fected with siRNAs-SKP2; then, the cells were harvested and subjected to RT-PCR and western blot assays to determine the knockdown efficiency of SKP2 ( ** P