 Explore
 Validate
 Learn
Learn Western blot
 ELISA
ELISAAntibody data
- Antibody Data
- Antigen structure
- References [0]
- Comments [0]
- Validations
- Western blot [4]
- Immunocytochemistry [2]
- Chromatin Immunoprecipitation [2]
Submit
Validation data
Reference
Comment
Report error
- Product number
- MA5-15442 - Provider product page

- Provider
- Invitrogen Antibodies
- Product name
- HDAC3 Monoclonal Antibody (7G6C5)
- Antibody type
- Monoclonal
- Antigen
- Purifed from natural sources
- Description
- MA5-15442 targets HDAC3 in indirect ELISA, IF, ChIP and WB applications and shows reactivity with Human samples. The MA5-15442 immunogen is purified recombinant fragment of human HDAC3 (aa224-428) expressed in E. Coli. MA5-15442 detects HDAC3 which has a predicted molecular weight of approximately 48.8kDa.
- Reactivity
- Human
- Host
- Mouse
- Isotype
- IgG
- Antibody clone number
- 7G6C5
- Vial size
- 100 µL
- Concentration
- Conc. Not Determined
- Storage
- Store at 4°C short term. For long term storage, store at -20°C, avoiding freeze/thaw cycles.
No comments: Submit comment
Supportive validation
- Submitted by
- Invitrogen Antibodies (provider)
- Main image

- Experimental details
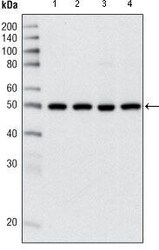
- Western blot analysis of HDAC3 using HDAC3 monoclonal antibody (Product # MA5-15442) in HeLa (1), NIH/3T3 (2), C6 (3) and COS-7 (4) cell lysate.

- Submitted by
- Invitrogen Antibodies (provider)
- Main image

- Experimental details
- Western blot analysis was performed on modified whole cell extracts (1% SDS) (30 µg lysate) of K-562 (Lane 1), THP-1 (Lane 2), MDA-MB-231 (Lane 3), HeLa (Lane 4), A-431 (Lane 5) and NIH/3T3 (Lane 6). The blot was probed with Anti-HDAC3 Monoclonal Antibody (7G6C5) (Product # MA5-15442, 1:1000 dilution) and detected by chemiluminescence using Goat anti-Mouse IgG (H+L) Superclonal™ Secondary Antibody, HRP conjugate (Product # A28177, 0.25µg/ml, 1:4000 dilution). A 49 kDa band corresponding to HDAC3 was observed across the cell lines tested. An additional band around 38 kDa was observed in the cell lines tested.

- Submitted by
- Invitrogen Antibodies (provider)
- Main image
- Experimental details
- Western blot analysis of HDAC3 using HDAC3 monoclonal antibody (Product # MA5-15442) in HeLa (1), NIH/3T3 (2), C6 (3) and COS-7 (4) cell lysate.

Supportive validation
- Submitted by
- Invitrogen Antibodies (provider)
- Main image
- Experimental details
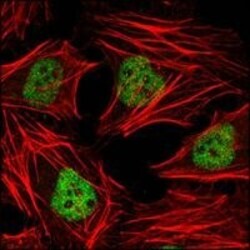
- Immunofluorescence analysis of HeLa cells using HDAC3 monoclonal antibody (Product # MA5-15442) (Green). Red: Actin filaments have been labeled with DY-554 phalloidin.

- Submitted by
- Invitrogen Antibodies (provider)
- Main image

- Experimental details
- Immunofluorescence analysis of HDAC3 was performed using 70% confluent log phase HeLa cells. The cells were fixed with 4% paraformaldehyde for 10 minutes, permeabilized with 0.1% Triton™ X-100 for 15 minutes, and blocked with 1% BSA for 1 hour at room temperature. The cells were labeled with HDAC3 Monoclonal Antibody (7G6C5)(Product # MA5-15442) at 1:100 dilution in 0.1% BSA, incubated at 4 degree Celsius overnight and then labeled with Goat anti-Mouse IgG (H+L) Superclonal™ Secondary Antibody, Alexa Fluor® 488 conjugate (Product # A28175) at a dilution of 1:2000 for 45 minutes at room temperature (Panel a: green). Nuclei (Panel b: blue) were stained with ProLong™ Diamond Antifade Mountant with DAPI (Product # P36962). F-actin (Panel c: red) was stained with Rhodamine Phalloidin (Product # R415). Panel d represents the merged image showing nuclear localization. Panel e represents control cells with no primary antibody to assess background. The images were captured at 60X magnification.

Supportive validation
- Submitted by
- Invitrogen Antibodies (provider)
- Main image

- Experimental details
- Chromatin immunoprecipitation analysis of HDAC3 was performed using cross-linked chromatin from 1x10^6 HCT116 colon carcinoma cells treated with serum for 0, 15, and 30 minutes. Immunoprecipitation was performed using a multiplex microplate Matrix ChIP assay (see reference for Matrix ChIP protocol: http://www.ncbi.nlm.nih.gov/pubmed/22098709) with 1.0 µL/100 µL well volume of an HDAC3 monoclonal antibody (Product # MA5-15442). Chromatin aliquots from ~1x10^5 cells were used per ChIP pull-down. Quantitative PCR data were done in quadruplicate using 1 µL of eluted DNA in 2 µL SYBR real-time PCR reactions containing primers to amplify -15kb upstream of the Egr1 gene or exon-1 or exon-2 of Egr1. PCR calibration curves were generated for each primer pair from a dilution series of sheared total genomic DNA. Quantitation of immunoprecipitated chromatin is presented as signal relative to the total amount of input chromatin. Results represent the mean +/- SEM for three experiments. A schematic representation of the Egr-1 locus is shown above the data where boxes represent exons (black boxes = translated regions, white boxes = untranslated regions), the zigzag line represents an intron, and the straight line represents upstream sequence. Regions amplified by Egr-1 primers are represented by black bars. Data courtesy of the Innovators Program.

- Submitted by
- Invitrogen Antibodies (provider)
- Main image

- Experimental details
- Enrichment of endogenous HDAC3 protein at specific gene loci using Anti-HDAC3 Antibody: Chromatin Immunoprecipitation (ChIP) was performed using Anti-HDAC3 Mouse Monoclonal Antibody (Product # MA5-15442, 8 ul) on sheared chromatin from 2 million HeLa cells using the MAGnify ChIP System (Product # 49-2024). Normal Rabbit IgG was used as a negative IP control. The purified DNA was analyzed by qPCR with PCR primer pairs over P21 promoter, ACTB upstream region (active) and SAT2 satellite repeats and SAT alpha (inactive). Data is presented as fold enrichment of the antibody signal versus the negative control IgG using the comparative CT method.
