Explore
 Validate
 Learn
LearnA15705
antibody from Invitrogen Antibodies
Targeting: CD59
16.3A5, EJ16, EJ30, EL32, G344, MIC11, MIN1, MIN2, MIN3, MSK21, p18-20
 Flow cytometry
 Other assay
Antibody data
- Antibody Data
- Antigen structure
- References [1]
- Comments [0]
- Validations
- Other assay [3]
Submit
Validation data
Reference
Comment
Report error
- Product number
- A15705 - Provider product page

- Provider
- Invitrogen Antibodies
- Product name
- CD59 Monoclonal Antibody (MEM-43), APC
- Antibody type
- Monoclonal
- Antigen
- Other
- Reactivity
- Human
- Host
- Mouse
- Isotype
- IgG
- Antibody clone number
- MEM-43
- Vial size
- 100 Tests
- Storage
- 4° C
Submitted references A hypomorphic PIGA gene mutation causes severe defects in neuron development and susceptibility to complement-mediated toxicity in a human iPSC model.
Yuan X, Li Z, Baines AC, Gavriilaki E, Ye Z, Wen Z, Braunstein EM, Biesecker LG, Cheng L, Dong X, Brodsky RA
PloS one 2017;12(4):e0174074
PloS one 2017;12(4):e0174074
No comments: Submit comment
Supportive validation
- Submitted by
- Invitrogen Antibodies (provider)
- Main image
- Experimental details
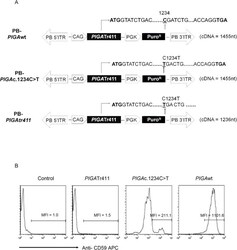
- Fig 1 Generation of PIGAc .1234C>T mutation using the PiggyBac transposon system. (A). Map of PiggyBac (PB) constructs for PIGA wt (top), PIGA c.1234C>T (middle) and PIGA tr411 (bottom). c.1234C>T (p.Arg412*) is a nonsense point mutation in the 6 th exon of the PIGA gene that predicts a truncated protein missing the final C-terminal 73 amino acids. PIGA tr411 is the truncated form of the PIGA cDNA, lacking the coding sequence of the C-terminal 73 amino acids. (B). Representative FACS analysis CD59 expression in TF1 PIGA cells transfected with PB- PIGA wt, PB- PIGA c.1234C>T or PB- PIGA tr411. Transfected TF1 PIGA cells were stained with an APC-conjugated CD59 antibody to assess PIGA gene expression. Non-transfected TF1 PIGA cells were used as a control. MFI represents mean fluorescence intensity.

- Submitted by
- Invitrogen Antibodies (provider)
- Main image
- Experimental details
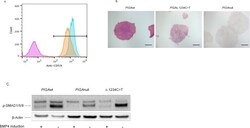
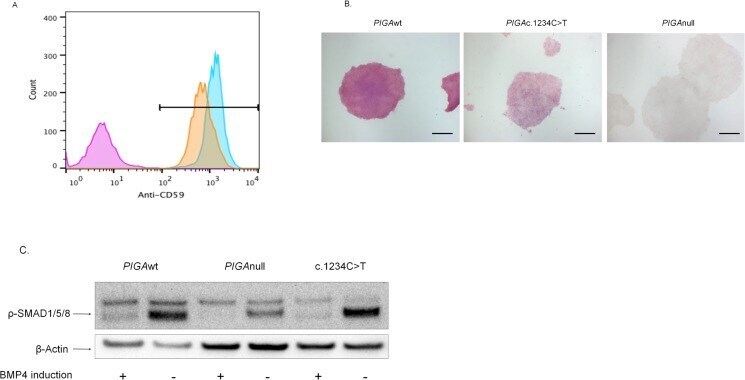
- Fig 2 The PIGA c.1234C>T mutation increases PIGA function compared to PIGA hiPSCs. (A). Representative example of FACS analysis CD59 expression in the three hiPSC lines. Overlay histogram shows that CD59 expression was significantly higher in PIGA c.1234 C>T hiPSCs compared to PIGA hiPSCs. MFI was 445.4 in PIGA wt hiPSCs and 332.6 in PIGA c.1234C>T hiPSCs (p>0.05, NS). However, MFI in PIGA c.1234C>T hiPSCs was significantly higher than 17.9 in PIGA hiPSCs (*pT hiPSCs. PIGA hiPSCs (purple), PIGA c.1234C>T hiPSCs (orange) and PIGA wt hiPSCs (blue). (B). Representative example of Alkaline Phosphatase (AP) activity in the three hiPSC lines was detected by an Alkaline Phosphatase Detection Kit. AP activity was examined under light microscopy (20X magnification, scale bar 50mum). AP activity was increased in PIGAc . 1234C>T hiPSCs compared to PIGA hiPSCs. Further confirming PIGA c.1234C>T hiPSCs possess partial PIGA gene function. (C). Representative Western blot: BMP4 induction in three hiPSC lines. PIGA wt, PIGA and PIGA c.1234C>T, were treated with or without 50ng/mL BMP4 for 4 hours and levels of phosphoSmad1 (Ser463/465)/Smad5 (Ser463/465)/Smad8 (Ser426/428) were detected by immunoblotting. Intensity of Smad 1/5/8 phosphorylation was comparably increased following BMP4 induction in both of PIGA wt hiPSCs and PIGA c.1234C>T hiPSCs; decreased responsiveness to BM
- Submitted by
- Invitrogen Antibodies (provider)
- Main image
- Experimental details
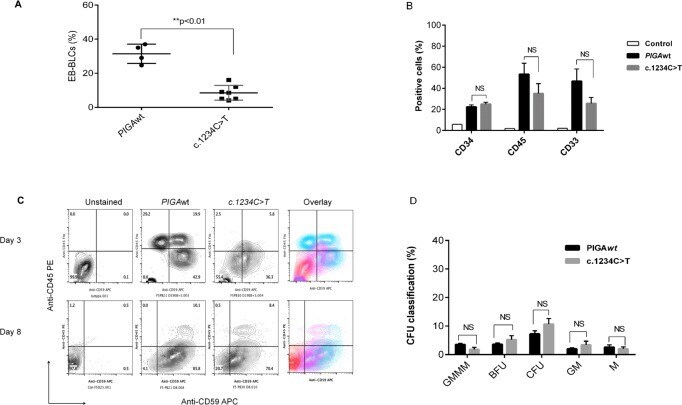
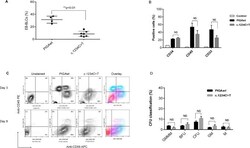
- Fig 3 The PIGA c.1234C>T mutation does not impair terminal hematopoietic differentiation during mesoderm induction. (A). Quantitation of EB-derived blood-like cells (EB-BLCs). A total of 100 hiPSC-derived EBs were assessed for each hiPSC derived cell line and the percentage of EB-BLCs present was determined. The percentage of EB-BLCs derived from PIGA wt hiPSCs was significantly higher than EB-BLCs from PIGA c.1234C>T hiPSCs (**PT hiPSCs. The cells were stained with anti-human CD33, anti-human CD34 and anti-human CD45 for flow cytometry analysis. Antibodies and analyzed by flow cytometry. The values shown are from three independent experiments. All values represent average and standard error (mean +- SE). (C). Representative example of FACS analysis of hematopoietic phenotypes in the EB-BLCs from PIGA wt and PIGA c.1234C>T. The zebra plot shows expression of CD59 (X-axis) and CD45 (Y-axis) after three and eight days of hematopoietic differentiation. Unstained PIGA wt cells were used as a control. (D). Enumeration of colony forming units (CFU) from the BLCs derived from PIGA wt and PIGA c.1234C>T. There was no significant difference in CFU colony formation between PIGA wt and PIGA c.1234C>T hematopoietic cells (p>0.05, NS, one-tailed, Unpaired T test).