 Explore
 Validate
 Learn
Learn Western blot
 Immunocytochemistry
Antibody data
- Antibody Data
- Antigen structure
- References [2]
- Comments [0]
- Validations
- Western blot [2]
Submit
Validation data
Reference
Comment
Report error
- Product number
- NB100-2519 - Provider product page

- Provider
- Novus Biologicals
- Proper citation
- Novus Cat#NB100-2519, RRID:AB_2260943
- Product name
- Rabbit Polyclonal AlphaB Crystallin/CRYAB Antibody
- Antibody type
- Polyclonal
- Description
- Immunogen affinity purified.
- Reactivity
- Human, Mouse
- Host
- Rabbit
- Isotype
- IgG
- Vial size
- 0.1 ml
- Concentration
- 1.08 mg/ml
- Storage
- Store at 4C. Do not freeze.
Submitted references Brief alcohol exposure alters transcription in astrocytes via the heat shock pathway.
Targeting the IRE1α/XBP1 and ATF6 arms of the unfolded protein response enhances VEGF blockade to prevent retinal and choroidal neovascularization.
Pignataro L, Varodayan FP, Tannenholz LE, Protiva P, Harrison NL
Brain and behavior 2013 Mar;3(2):114-33
Brain and behavior 2013 Mar;3(2):114-33
Targeting the IRE1α/XBP1 and ATF6 arms of the unfolded protein response enhances VEGF blockade to prevent retinal and choroidal neovascularization.
Liu L, Qi X, Chen Z, Shaw L, Cai J, Smith LH, Grant MB, Boulton ME
The American journal of pathology 2013 Apr;182(4):1412-24
The American journal of pathology 2013 Apr;182(4):1412-24
No comments: Submit comment
Supportive validation
- Submitted by
- Novus Biologicals (provider)
- Main image

- Experimental details
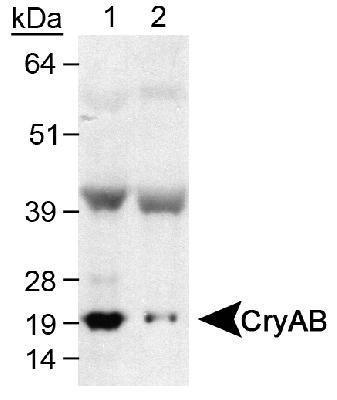
- Western Blot: AlphaB Crystallin/CRYAB Antibody [NB100-2519] - Detection of CryAB using NB 100-2519 (0.5ug/ml). Lane 1: Human skeletal muscle Lane 2: Mouse skeletal muscle.
- Submitted by
- Novus Biologicals (provider)
- Main image
- Experimental details
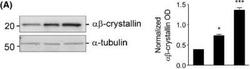
- Western Blot: AlphaB Crystallin/CRYAB Antibody [NB100-2519] - Ethanol induces the expression of heat shock proteins (HSPs) in primary astrocyte culture. Increase in alphabeta-crystallin protein levels after treatment for 2 h with 60 mmol/L ethanol (EtOH) or 42C heat shock (HS) in primary astrocyte culture. alpha-tubulin used as an internal standard. The bar graph to the right of the immunoblots represents the quantification of immunoreactive bands intensities normalized to the internal standard, expressed in arbitrary optical density (OD) units. The data are the mean +/- SEM of normalized relative OD values analyzed by one-way ANOVA with Dunnett's multiple comparison post hoc test, n = 3 (significantly differently at the level of *P < 0.05, **P < 0.01, ***P < 0.001). Image collected and cropped by CiteAb from the following publication (http://doi.wiley.com/10.1002/brb3.125) licensed under a CC-BY licence.
