Explore
 Validate
 Learn
Learn Immunohistochemistry
 Flow cytometry
Antibody data
- Antibody Data
- Antigen structure
- References [4]
- Comments [0]
- Validations
- Flow cytometry [2]
- Other assay [4]
Submit
Validation data
Reference
Comment
Report error
- Product number
- 14-0138-37 - Provider product page

- Provider
- Invitrogen Antibodies
- Product name
- CD13 Monoclonal Antibody (WM-15 (WM15)), eBioscience™
- Antibody type
- Monoclonal
- Antigen
- Other
- Description
- Description: The WM-15 monoclonal antibody reacts with human CD13, also known as aminopeptidase N. CD13 is a transmembrane ectoenzyme occurring on monocytes and granulocytes but not lymphocytes in blood. It is also reportedly on a wide variety of cells and in a wide variety of tissues, including endothelial cells, epithelial cells, fibroblasts, kidney proximal tubules, intestine, and placenta. CD13 is reported to have many different functions including degradation of enkephalins and endorphins, terminal degradation of peptides, amino acid scavenging, antigen processing, and adhesion and migration of cells. Applications Reported: The WM-15 (WM15) antibody) has been reported for use in flow cytometric analysis, and microscopy. Applications Tested: The WM-15 (WM15) antibody has been tested by flow cytometric analysis of lysed whole blood. This can be used at less than or equal to 1 µg per test. A test is defined as the amount (µg) of antibody that will stain a cell sample in a final volume of 100 µL. Cell number should be determined empirically but can range from 10^5 to 10^8 cells/test. It is recommended that the antibody be carefully titrated for optimal performance in the assay of interest. Purity: Greater than 90%, as determined by SDS-PAGE. Aggregation: Less than 10%, as determined by HPLC. Filtration: 0.2 µm post-manufacturing filtered.
- Reactivity
- Human
- Host
- Mouse
- Isotype
- IgG
- Antibody clone number
- WM-15 (WM15)
- Vial size
- 2 mg
- Concentration
- 0.5 mg/mL
- Storage
- 4°C
Submitted references Targeting glutaminase 1 attenuates stemness properties in hepatocellular carcinoma by increasing reactive oxygen species and suppressing Wnt/beta-catenin pathway.
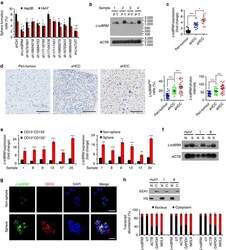
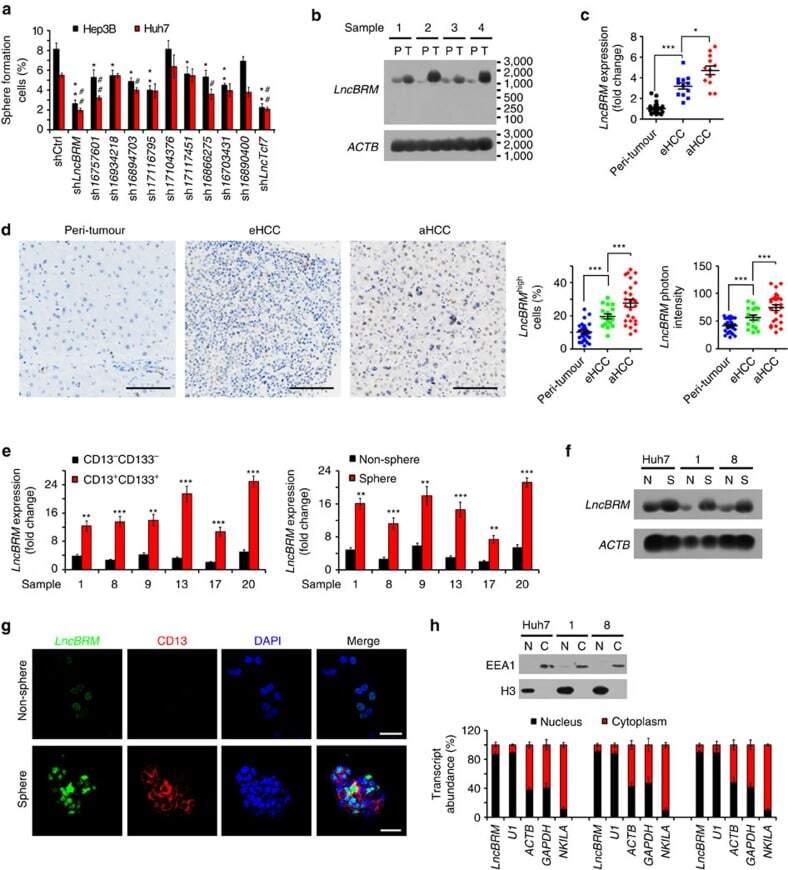
LncBRM initiates YAP1 signalling activation to drive self-renewal of liver cancer stem cells.
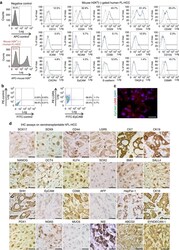
Model of fibrolamellar hepatocellular carcinomas reveals striking enrichment in cancer stem cells.
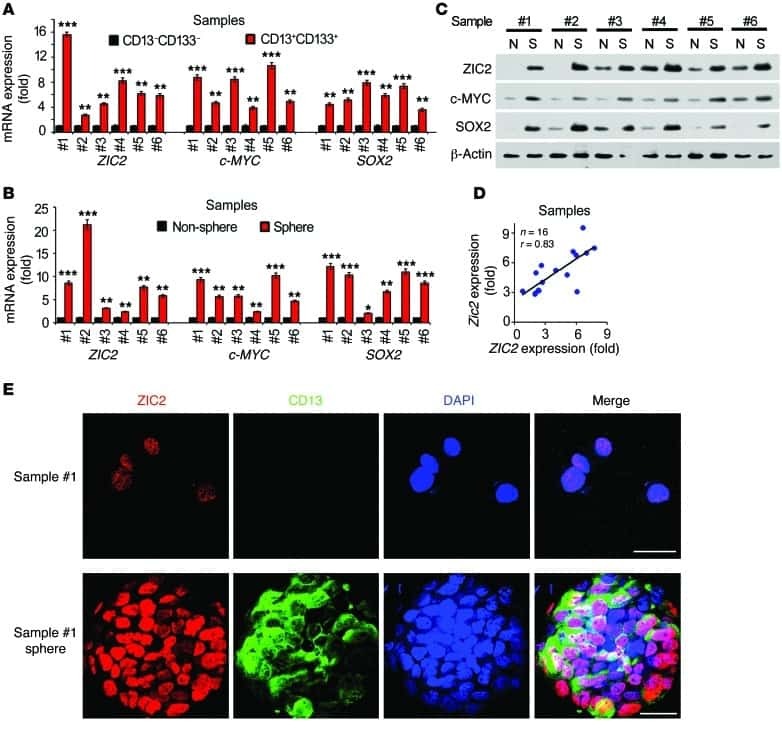
ZIC2-dependent OCT4 activation drives self-renewal of human liver cancer stem cells.
Li B, Cao Y, Meng G, Qian L, Xu T, Yan C, Luo O, Wang S, Wei J, Ding Y, Yu D
EBioMedicine 2019 Jan;39:239-254
EBioMedicine 2019 Jan;39:239-254
LncBRM initiates YAP1 signalling activation to drive self-renewal of liver cancer stem cells.
Zhu P, Wang Y, Wu J, Huang G, Liu B, Ye B, Du Y, Gao G, Tian Y, He L, Fan Z
Nature communications 2016 Dec 1;7:13608
Nature communications 2016 Dec 1;7:13608
Model of fibrolamellar hepatocellular carcinomas reveals striking enrichment in cancer stem cells.
Oikawa T, Wauthier E, Dinh TA, Selitsky SR, Reyna-Neyra A, Carpino G, Levine R, Cardinale V, Klimstra D, Gaudio E, Alvaro D, Carrasco N, Sethupathy P, Reid LM
Nature communications 2015 Oct 6;6:8070
Nature communications 2015 Oct 6;6:8070
ZIC2-dependent OCT4 activation drives self-renewal of human liver cancer stem cells.
Zhu P, Wang Y, He L, Huang G, Du Y, Zhang G, Yan X, Xia P, Ye B, Wang S, Hao L, Wu J, Fan Z
The Journal of clinical investigation 2015 Oct 1;125(10):3795-808
The Journal of clinical investigation 2015 Oct 1;125(10):3795-808
No comments: Submit comment
Supportive validation
- Submitted by
- Invitrogen Antibodies (provider)
- Main image
- Experimental details
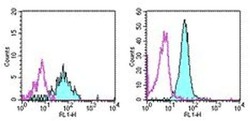
- Staining of normal human peripheral blood cells with 0.5 µg of Mouse IgG1 Isotype Control Purified (Product # 14-4714-82) (open histogram) or 0.5 µg of Anti-Human CD13 Purified (filled histogram) followed by Anti-Mouse IgG FITC (Product # 11-4011-85). Cells in the monocyte (left) and granulocyte (right) gates were used for analysis.
- Submitted by
- Invitrogen Antibodies (provider)
- Main image

- Experimental details
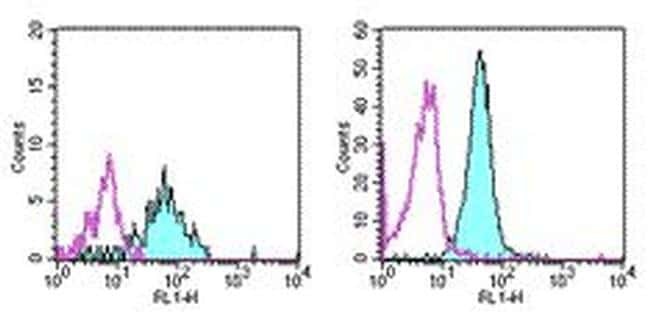
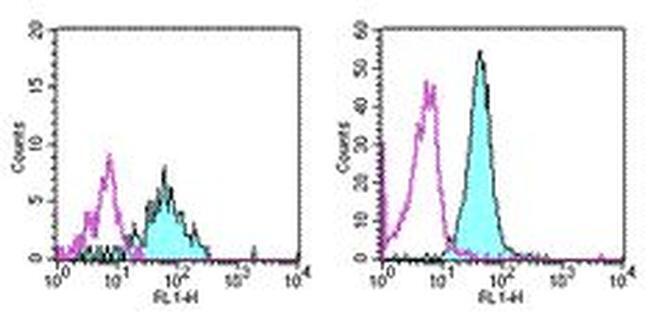
- Staining of normal human peripheral blood cells with 0.5 µg of Mouse IgG1 Isotype Control Purified (Product # 14-4714-82) (open histogram) or 0.5 µg of Anti-Human CD13 Purified (filled histogram) followed by Anti-Mouse IgG FITC (Product # 11-4011-85). Cells in the monocyte (left) and granulocyte (right) gates were used for analysis.
Supportive validation
- Submitted by
- Invitrogen Antibodies (provider)
- Main image

- Experimental details
- NULL
- Submitted by
- Invitrogen Antibodies (provider)
- Main image
- Experimental details
- Figure 1 LncBRM is highly expressed in HCC tumours and liver CSCs. ( a ) The indicated lncRNAs were silenced using pSiCoR lentivirus, followed by sphere formation assays. *, **, for Hep3B cells, Hep3B shlncBRM versus Hep3B shCtrl; #, ##, for Huh7 cells, Huh7 shlncBRM versus Huh7 shCtrl. ( b ) Total RNAs were extracted from peri-tumour (P) and tumour (T) tissues, followed by northern blotting. ACTB served as a loading control. ( c ) Primary HCC samples were prepared for examination of lncBRM expression using RT-qPCR. aHCC, advanced HCC; eHCC, early HCC. ( d ) LncBRM was detected by in situ hybridization. LncBRM highly expressed cells (middle panel) and lncBRM photon intensity (right panel) were calculated by Image-Pro Plus 6 and shown as scatter plot (means+-s.e.m.). Scale bars, 100 mum. ( e ) Liver CSCs (CD13 + CD133 + ) and non-CSCs (CD13 - CD133 - ) were sorted from HCC samples, followed by detection of lncBRM using RT-qPCR (left panel). Oncospheres and non-spheres derived from HCC primary tumour cells were analysed similarly. Expression levels of lncBRM were normalized to that of non-tumour sample 17 as a baseline level. ( f ) lncBRM was examined in oncospheres and non-spheres with northern blotting. N, non-sphere; S, sphere. ( g ) Non-spheres and spheres were stained with lncBRM probes and CD13 antibody for confocal microscopy. Scale bars, 20 mum. ( h ) Nucleocytoplasmic fractionation of oncosphere cells was performed and followed by immunoblotting (upper panel) and RT-qP
- Submitted by
- Invitrogen Antibodies (provider)
- Main image
- Experimental details
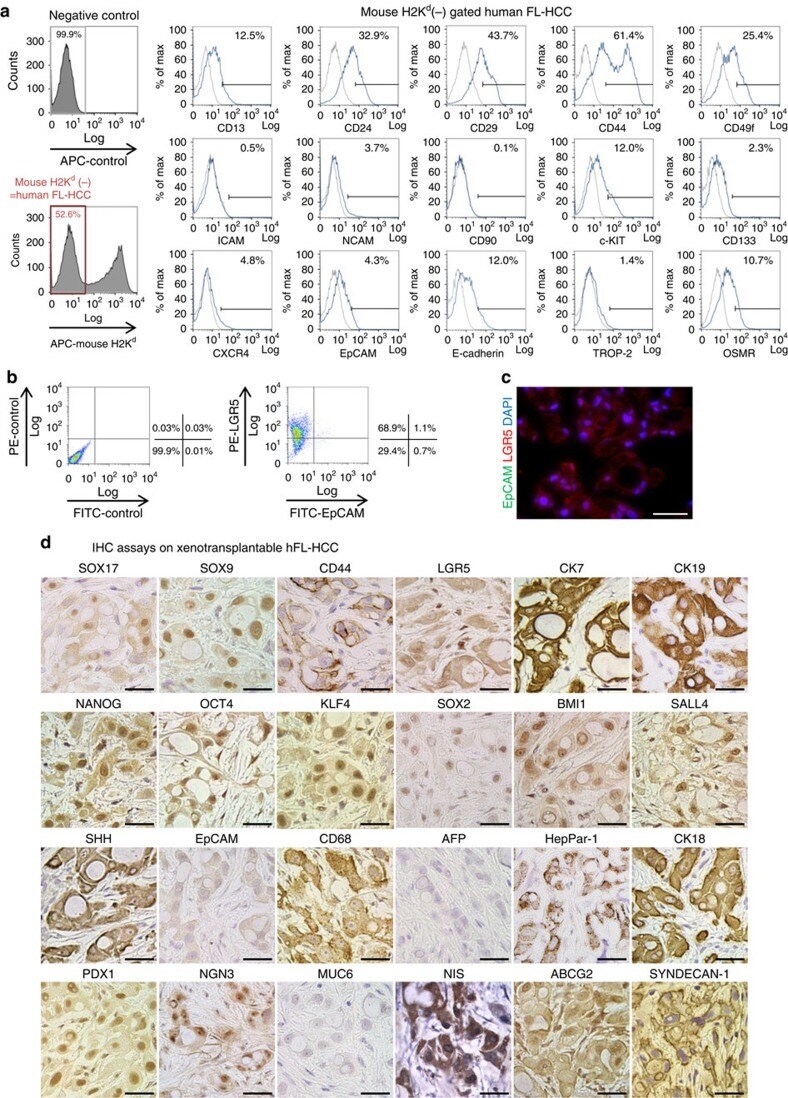
- Figure 2 Characterization of a transplantable hFL-HCC tumour line. ( a ) Representative flow cytometric findings of hFL-HCC cells, gated-mouse-H2K d -negative, were done. Antigens expressed by a significant percentage of the cells included CD44 (61.4%); CD49f (25.4%); CD24 (32.9%); CD13 (12.5%); c-KIT (12.0%); E-cadherin (12.0%); and OSMR (10.7%). Other antigens found routinely but in a smaller percentage of cells included CXCR4 (4.8%); EpCAM (4.3%); CD133 (2.3%); TROP-2 (1.4%); and ICAM1 (0.5%). ( b ) Double staining of LGR5 and EpCAM in hFL-HCC cells. LGR5+ cells accounted for 68.9% of the cells in the tumours. Of these, only 1.1% were also EpCAM+. ( c ) Immunofluorescence assay on hFL-HCC xenotransplantable tumour demonstrated strong expression of LGR5 and an absence of EpCAM. ( d ) IHC assays on the xenotransplantable tumour line. The survey included assays for endodermal stem/progenitor transcription factors and markers (SOX17, SOX9, CD44, LGR5 and CK19); pluripotency genes (NANOG, OCT4, KLF4, SOX2 and BMI1); hepatic and other markers (HepPar-1, CK18, CK7, SHH and CD68); and pancreatic/endocrine markers (PDX1, NGN3 and NIS), which were strongly expressed. EpCAM was essentially negative, and alpha-fetoprotein was negative. The scale bar, 25 mum ( c , d ).
- Submitted by
- Invitrogen Antibodies (provider)
- Main image

- Experimental details
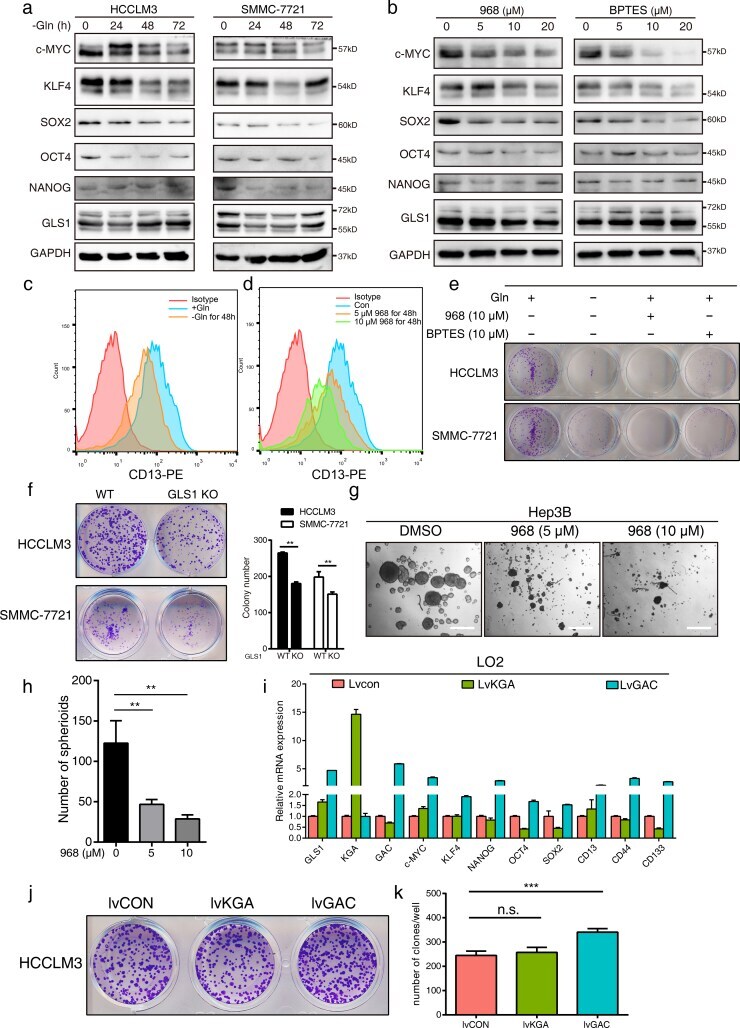
- Fig. 5 Targeting GLS1 suppresses cancer stem cell properties. (a) Effect of glutamine on the expression of stemness genes. HCCLM3 and SMMC-7721 were cultured in DMEM with the absence of glutamine for 24, 48, or 72 h. Cell lysates were subjected to Western blot to measure the expression of stemness markers. (b) HCCLM3 cells were treated with 5, 10, or 20 muM 968 or BPTES for 48 h, then Western blot was employed to detect the expression of stemness markers. (c-d) Glutamine deprivation or 968 treatment for 48 h resulted in a decrease of CD13 expression as evaluated by flow cytometry. (e) Colony formation assay was performed to assess the effect of glutamine withdrawal and GLS1 inhibitors (968 or BPTES) on tumorigenicity. (f) Colony formation assay and quantitative analysis were performed in HCCLM3 and SMMC-7721 cells with GLS1 knockout. (g-h) 968 treatment reduced the number and size of the tumorspheres in Hep3B as measured by sphere-formation assays. Scale bars: 200 mum (i) The expression changes of stemness markers in cell lines stably overexpressing empty vector (lvCON), KGA (lvKGA) or GAC (lvGAC) isoform by lentiviral. (j-k) Colony formation assay and quantitative analysis were performed in lvCON, lvKGA, and lvGAC cell lines. Data are presented as mean +- SD. **, p < .01; ***, p < .001. Fig. 5