Explore
 Validate
 Learn
Learn Flow cytometry
Antibody data
- Antibody Data
- Antigen structure
- References [52]
- Comments [0]
- Validations
- Flow cytometry [1]
- Other assay [15]
Submit
Validation data
Reference
Comment
Report error
- Product number
- 14-0271-85 - Provider product page

- Provider
- Invitrogen Antibodies
- Product name
- CD27 Monoclonal Antibody (LG.7F9), eBioscience™
- Antibody type
- Monoclonal
- Antigen
- Other
- Description
- Description: The LG.7F9 monoclonal antibody reacts with mouse CD27, a lymphocyte-specific member of the TNFR superfamily. CD27 is expressed by virtually all mature T cells and by a subpopulation of B cells, mainly memory B cells. In mouse, CD27 has been found on nearly all thymocytes excluding a population of CD46-CD8- precursors. CD27 binds to CD70 and, through this interaction, plays an important role in T cell-B cell interaction. It has been reported that triggering CD27 plays an important role in the maturation of CD4+ and CD8+ effector cells. LG.7F9 cross-reacts with human and rat CD27.
- Antibody clone number
- LG.7F9
- Concentration
- 0.5 mg/mL
Submitted references PI3Kδ coordinates transcriptional, chromatin, and metabolic changes to promote effector CD8(+) T cells at the expense of central memory.
Effect of Subcutaneous Anti-CD20 Antibody-Mediated B Cell Depletion on Susceptibility to Pneumocystis Infection in Mice.
Development of a VRC01-class germline targeting immunogen derived from anti-idiotypic antibodies.
Immune cell phenotypes associated with disease severity and long-term neutralizing antibody titers after natural dengue virus infection.
Ontogenic timing, T cell receptor signal strength, and Notch signaling direct γδ T cell functional differentiation in vivo.
The transcriptional repressor ID2 supports natural killer cell maturation by controlling TCF1 amplitude.
Th2 Biased Immunity With Altered B Cell Profiles in Circulation of Patients With Sporotrichosis Caused by Sporothrix globosa.
Coordinated Viral Control by Cytotoxic Lymphocytes Ensures Optimal Adaptive NK Cell Responses.
Iterative Single-Cell Analyses Define the Transcriptome of the First Functional Hematopoietic Stem Cells.
Divergent Role for STAT5 in the Adaptive Responses of Natural Killer Cells.
Cytomegalovirus Infection Drives Avidity Selection of Natural Killer Cells.
The complex of MCMV proteins and MHC class I evades NK cell control and drives the evolution of virus-specific activating Ly49 receptors.
Tumor-associated neutrophils suppress pro-tumoral IL-17+ γδ T cells through induction of oxidative stress.
TBK-binding protein 1 regulates IL-15-induced autophagy and NKT cell survival.
Continuous activity of Foxo1 is required to prevent anergy and maintain the memory state of CD8(+) T cells.
Non-redundant ISGF3 Components Promote NK Cell Survival in an Auto-regulatory Manner during Viral Infection.
NCR1-deficiency diminishes the generation of protective murine cytomegalovirus antibodies by limiting follicular helper T-cell maturation.
Polymicrobial sepsis impairs bystander recruitment of effector cells to infected skin despite optimal sensing and alarming function of skin resident memory CD8 T cells.
WASH maintains NKp46(+) ILC3 cells by promoting AHR expression.
Casein kinase 2 controls the survival of normal thymic and leukemic γδ T cells via promotion of AKT signaling.
NK cells regulate CXCR2+ neutrophil recruitment during acute lung injury.
NFκB-Pim-1-Eomesodermin axis is critical for maintaining CD8 T-cell memory quality.
NKG2C/E Marks the Unique Cytotoxic CD4 T Cell Subset, ThCTL, Generated by Influenza Infection.
The breast tumor microenvironment alters the phenotype and function of natural killer cells.
NK cell development requires Tsc1-dependent negative regulation of IL-15-triggered mTORC1 activation.
NK Cell Maturation and Cytotoxicity Are Controlled by the Intramembrane Aspartyl Protease SPPL3.
Differential Responsiveness of Innate-like IL-17- and IFN-γ-Producing γδ T Cells to Homeostatic Cytokines.
PI3Kδ Regulates the Magnitude of CD8+ T Cell Responses after Challenge with Listeria monocytogenes.
Transcriptional repressor ZEB2 promotes terminal differentiation of CD8+ effector and memory T cell populations during infection.
OX40- and CD27-mediated costimulation synergizes with anti-PD-L1 blockade by forcing exhausted CD8+ T cells to exit quiescence.
Production of IL-10 by CD4(+) regulatory T cells during the resolution of infection promotes the maturation of memory CD8(+) T cells.
Ly49C-dependent control of MCMV Infection by NK cells is cis-regulated by MHC Class I molecules.
Murine CD27(-) Vγ6(+) γδ T cells producing IL-17A promote ovarian cancer growth via mobilization of protumor small peritoneal macrophages.
Microsphere priming facilitates induction of potent therapeutic T-cell immune responses against autochthonous liver cancers.
The transcription factor E4bp4/Nfil3 controls commitment to the NK lineage and directly regulates Eomes and Id2 expression.
Cutaneous immunosurveillance and regulation of inflammation by group 2 innate lymphoid cells.
Low-affinity T cells are programmed to maintain normal primary responses but are impaired in their recall to low-affinity ligands.
CCR2 defines a distinct population of NK cells and mediates their migration during influenza virus infection in mice.
Population dynamics of naive and memory CD8 T cell responses after antigen stimulations in vivo.
Heterologous plasmid DNA prime-recombinant human adenovirus 5 boost vaccination generates a stable pool of protective long-lived CD8(+) T effector memory cells specific for a human parasite, Trypanosoma cruzi.
Extreme CD8 T cell requirements for anti-malarial liver-stage immunity following immunization with radiation attenuated sporozoites.
Cutting edge: adaptive versus innate receptor signals selectively control the pool sizes of murine IFN-γ- or IL-17-producing γδ T cells upon infection.
Type I IFN signaling constrains IL-17A/F secretion by gammadelta T cells during bacterial infections.
GITR triggering induces expansion of both effector and regulatory CD4+ T cells in vivo.
In vivo expression of signaling proteins in reconstituted NK cells.
Duration of antigen expression in vivo following DNA immunization modifies the magnitude, contraction, and secondary responses of CD8+ T lymphocytes.
Duration of antigen expression in vivo following DNA immunization modifies the magnitude, contraction, and secondary responses of CD8+ T lymphocytes.
The impact of a boosting immunogen on the differentiation of secondary memory CD8+ T cells.
Interleukin 15-mediated survival of natural killer cells is determined by interactions among Bim, Noxa and Mcl-1.
Expression of the murine CD27 ligand CD70 in vitro and in vivo.
Characterization of murine CD70, the ligand of the TNF receptor family member CD27.
Novel mAbs reveal potent co-stimulatory activity of murine CD27.
Cannons JL, Villarino AV, Kapnick SM, Preite S, Shih HY, Gomez-Rodriguez J, Kaul Z, Shibata H, Reilley JM, Huang B, Handon R, McBain IT, Gossa S, Wu T, Su HC, McGavern DB, O'Shea JJ, McGuire PJ, Uzel G, Schwartzberg PL
Cell reports 2021 Oct 12;37(2):109804
Cell reports 2021 Oct 12;37(2):109804
Effect of Subcutaneous Anti-CD20 Antibody-Mediated B Cell Depletion on Susceptibility to Pneumocystis Infection in Mice.
Dai G, Noell K, Weckbecker G, Kolls JK
mSphere 2021 May 5;6(3)
mSphere 2021 May 5;6(3)
Development of a VRC01-class germline targeting immunogen derived from anti-idiotypic antibodies.
Seydoux E, Wan YH, Feng J, Wall A, Aljedani S, Homad LJ, MacCamy AJ, Weidle C, Gray MD, Brumage L, Taylor JJ, Pancera M, Stamatatos L, McGuire AT
Cell reports 2021 May 4;35(5):109084
Cell reports 2021 May 4;35(5):109084
Immune cell phenotypes associated with disease severity and long-term neutralizing antibody titers after natural dengue virus infection.
Rouers A, Chng MHY, Lee B, Rajapakse MP, Kaur K, Toh YX, Sathiakumar D, Loy T, Thein TL, Lim VWX, Singhal A, Yeo TW, Leo YS, Vora KA, Casimiro D, Lim B, Tucker-Kellogg L, Rivino L, Newell EW, Fink K
Cell reports. Medicine 2021 May 18;2(5):100278
Cell reports. Medicine 2021 May 18;2(5):100278
Ontogenic timing, T cell receptor signal strength, and Notch signaling direct γδ T cell functional differentiation in vivo.
Chen ELY, Lee CR, Thompson PK, Wiest DL, Anderson MK, Zúñiga-Pflücker JC
Cell reports 2021 Jun 8;35(10):109227
Cell reports 2021 Jun 8;35(10):109227
The transcriptional repressor ID2 supports natural killer cell maturation by controlling TCF1 amplitude.
Li ZY, Morman RE, Hegermiller E, Sun M, Bartom ET, Maienschein-Cline M, Sigvardsson M, Kee BL
The Journal of experimental medicine 2021 Jun 7;218(6)
The Journal of experimental medicine 2021 Jun 7;218(6)
Th2 Biased Immunity With Altered B Cell Profiles in Circulation of Patients With Sporotrichosis Caused by Sporothrix globosa.
Zu J, Yao L, Song Y, Cui Y, Guan M, Chen R, Zhen Y, Li S
Frontiers in immunology 2020;11:570888
Frontiers in immunology 2020;11:570888
Coordinated Viral Control by Cytotoxic Lymphocytes Ensures Optimal Adaptive NK Cell Responses.
Diaz-Salazar C, Sun JC
Cell reports 2020 Sep 22;32(12):108186
Cell reports 2020 Sep 22;32(12):108186
Iterative Single-Cell Analyses Define the Transcriptome of the First Functional Hematopoietic Stem Cells.
Vink CS, Calero-Nieto FJ, Wang X, Maglitto A, Mariani SA, Jawaid W, Göttgens B, Dzierzak E
Cell reports 2020 May 12;31(6):107627
Cell reports 2020 May 12;31(6):107627
Divergent Role for STAT5 in the Adaptive Responses of Natural Killer Cells.
Wiedemann GM, Grassmann S, Lau CM, Rapp M, Villarino AV, Friedrich C, Gasteiger G, O'Shea JJ, Sun JC
Cell reports 2020 Dec 15;33(11):108498
Cell reports 2020 Dec 15;33(11):108498
Cytomegalovirus Infection Drives Avidity Selection of Natural Killer Cells.
Adams NM, Geary CD, Santosa EK, Lumaquin D, Le Luduec JB, Sottile R, van der Ploeg K, Hsu J, Whitlock BM, Jackson BT, Weizman OE, Huse M, Hsu KC, Sun JC
Immunity 2019 Jun 18;50(6):1381-1390.e5
Immunity 2019 Jun 18;50(6):1381-1390.e5
The complex of MCMV proteins and MHC class I evades NK cell control and drives the evolution of virus-specific activating Ly49 receptors.
Železnjak J, Lisnić VJ, Popović B, Lisnić B, Babić M, Halenius A, L'Hernault A, Roviš TL, Hengel H, Erhard F, Redwood AJ, Vidal SM, Dölken L, Krmpotić A, Jonjić S
The Journal of experimental medicine 2019 Aug 5;216(8):1809-1827
The Journal of experimental medicine 2019 Aug 5;216(8):1809-1827
Tumor-associated neutrophils suppress pro-tumoral IL-17+ γδ T cells through induction of oxidative stress.
Mensurado S, Rei M, Lança T, Ioannou M, Gonçalves-Sousa N, Kubo H, Malissen M, Papayannopoulos V, Serre K, Silva-Santos B
PLoS biology 2018 May;16(5):e2004990
PLoS biology 2018 May;16(5):e2004990
TBK-binding protein 1 regulates IL-15-induced autophagy and NKT cell survival.
Zhu L, Xie X, Zhang L, Wang H, Jie Z, Zhou X, Shi J, Zhao S, Zhang B, Cheng X, Sun SC
Nature communications 2018 Jul 18;9(1):2812
Nature communications 2018 Jul 18;9(1):2812
Continuous activity of Foxo1 is required to prevent anergy and maintain the memory state of CD8(+) T cells.
Delpoux A, Michelini RH, Verma S, Lai CY, Omilusik KD, Utzschneider DT, Redwood AJ, Goldrath AW, Benedict CA, Hedrick SM
The Journal of experimental medicine 2018 Feb 5;215(2):575-594
The Journal of experimental medicine 2018 Feb 5;215(2):575-594
Non-redundant ISGF3 Components Promote NK Cell Survival in an Auto-regulatory Manner during Viral Infection.
Geary CD, Krishna C, Lau CM, Adams NM, Gearty SV, Pritykin Y, Thomsen AR, Leslie CS, Sun JC
Cell reports 2018 Aug 21;24(8):1949-1957.e6
Cell reports 2018 Aug 21;24(8):1949-1957.e6
NCR1-deficiency diminishes the generation of protective murine cytomegalovirus antibodies by limiting follicular helper T-cell maturation.
Miletic A, Lenartic M, Popovic B, Brizic I, Trsan T, Miklic K, Mandelboim O, Krmpotic A, Jonjic S
European journal of immunology 2017 Sep;47(9):1443-1456
European journal of immunology 2017 Sep;47(9):1443-1456
Polymicrobial sepsis impairs bystander recruitment of effector cells to infected skin despite optimal sensing and alarming function of skin resident memory CD8 T cells.
Danahy DB, Anthony SM, Jensen IJ, Hartwig SM, Shan Q, Xue HH, Harty JT, Griffith TS, Badovinac VP
PLoS pathogens 2017 Sep;13(9):e1006569
PLoS pathogens 2017 Sep;13(9):e1006569
WASH maintains NKp46(+) ILC3 cells by promoting AHR expression.
Xia P, Liu J, Wang S, Ye B, Du Y, Xiong Z, Han ZG, Tong L, Fan Z
Nature communications 2017 Jun 7;8:15685
Nature communications 2017 Jun 7;8:15685
Casein kinase 2 controls the survival of normal thymic and leukemic γδ T cells via promotion of AKT signaling.
Ribeiro ST, Tesio M, Ribot JC, Macintyre E, Barata JT, Silva-Santos B
Leukemia 2017 Jul;31(7):1603-1610
Leukemia 2017 Jul;31(7):1603-1610
NK cells regulate CXCR2+ neutrophil recruitment during acute lung injury.
Hoegl S, Ehrentraut H, Brodsky KS, Victorino F, Golden-Mason L, Eltzschig HK, McNamee EN
Journal of leukocyte biology 2017 Feb;101(2):471-480
Journal of leukocyte biology 2017 Feb;101(2):471-480
NFκB-Pim-1-Eomesodermin axis is critical for maintaining CD8 T-cell memory quality.
Knudson KM, Pritzl CJ, Saxena V, Altman A, Daniels MA, Teixeiro E
Proceedings of the National Academy of Sciences of the United States of America 2017 Feb 28;114(9):E1659-E1667
Proceedings of the National Academy of Sciences of the United States of America 2017 Feb 28;114(9):E1659-E1667
NKG2C/E Marks the Unique Cytotoxic CD4 T Cell Subset, ThCTL, Generated by Influenza Infection.
Marshall NB, Vong AM, Devarajan P, Brauner MD, Kuang Y, Nayar R, Schutten EA, Castonguay CH, Berg LJ, Nutt SL, Swain SL
Journal of immunology (Baltimore, Md. : 1950) 2017 Feb 1;198(3):1142-1155
Journal of immunology (Baltimore, Md. : 1950) 2017 Feb 1;198(3):1142-1155
The breast tumor microenvironment alters the phenotype and function of natural killer cells.
Krneta T, Gillgrass A, Chew M, Ashkar AA
Cellular & molecular immunology 2016 Sep;13(5):628-39
Cellular & molecular immunology 2016 Sep;13(5):628-39
NK cell development requires Tsc1-dependent negative regulation of IL-15-triggered mTORC1 activation.
Yang M, Chen S, Du J, He J, Wang Y, Li Z, Liu G, Peng W, Zeng X, Li D, Xu P, Guo W, Chang Z, Wang S, Tian Z, Dong Z
Nature communications 2016 Sep 7;7:12730
Nature communications 2016 Sep 7;7:12730
NK Cell Maturation and Cytotoxicity Are Controlled by the Intramembrane Aspartyl Protease SPPL3.
Hamblet CE, Makowski SL, Tritapoe JM, Pomerantz JL
Journal of immunology (Baltimore, Md. : 1950) 2016 Mar 15;196(6):2614-26
Journal of immunology (Baltimore, Md. : 1950) 2016 Mar 15;196(6):2614-26
Differential Responsiveness of Innate-like IL-17- and IFN-γ-Producing γδ T Cells to Homeostatic Cytokines.
Corpuz TM, Stolp J, Kim HO, Pinget GV, Gray DH, Cho JH, Sprent J, Webster KE
Journal of immunology (Baltimore, Md. : 1950) 2016 Jan 15;196(2):645-54
Journal of immunology (Baltimore, Md. : 1950) 2016 Jan 15;196(2):645-54
PI3Kδ Regulates the Magnitude of CD8+ T Cell Responses after Challenge with Listeria monocytogenes.
Pearce VQ, Bouabe H, MacQueen AR, Carbonaro V, Okkenhaug K
Journal of immunology (Baltimore, Md. : 1950) 2015 Oct 1;195(7):3206-17
Journal of immunology (Baltimore, Md. : 1950) 2015 Oct 1;195(7):3206-17
Transcriptional repressor ZEB2 promotes terminal differentiation of CD8+ effector and memory T cell populations during infection.
Omilusik KD, Best JA, Yu B, Goossens S, Weidemann A, Nguyen JV, Seuntjens E, Stryjewska A, Zweier C, Roychoudhuri R, Gattinoni L, Bird LM, Higashi Y, Kondoh H, Huylebroeck D, Haigh J, Goldrath AW
The Journal of experimental medicine 2015 Nov 16;212(12):2027-39
The Journal of experimental medicine 2015 Nov 16;212(12):2027-39
OX40- and CD27-mediated costimulation synergizes with anti-PD-L1 blockade by forcing exhausted CD8+ T cells to exit quiescence.
Buchan S, Manzo T, Flutter B, Rogel A, Edwards N, Zhang L, Sivakumaran S, Ghorashian S, Carpenter B, Bennett C, Freeman GJ, Sykes M, Croft M, Al-Shamkhani A, Chakraverty R
Journal of immunology (Baltimore, Md. : 1950) 2015 Jan 1;194(1):125-133
Journal of immunology (Baltimore, Md. : 1950) 2015 Jan 1;194(1):125-133
Production of IL-10 by CD4(+) regulatory T cells during the resolution of infection promotes the maturation of memory CD8(+) T cells.
Laidlaw BJ, Cui W, Amezquita RA, Gray SM, Guan T, Lu Y, Kobayashi Y, Flavell RA, Kleinstein SH, Craft J, Kaech SM
Nature immunology 2015 Aug;16(8):871-9
Nature immunology 2015 Aug;16(8):871-9
Ly49C-dependent control of MCMV Infection by NK cells is cis-regulated by MHC Class I molecules.
Forbes CA, Scalzo AA, Degli-Esposti MA, Coudert JD
PLoS pathogens 2014 May;10(5):e1004161
PLoS pathogens 2014 May;10(5):e1004161
Murine CD27(-) Vγ6(+) γδ T cells producing IL-17A promote ovarian cancer growth via mobilization of protumor small peritoneal macrophages.
Rei M, Gonçalves-Sousa N, Lança T, Thompson RG, Mensurado S, Balkwill FR, Kulbe H, Pennington DJ, Silva-Santos B
Proceedings of the National Academy of Sciences of the United States of America 2014 Aug 26;111(34):E3562-70
Proceedings of the National Academy of Sciences of the United States of America 2014 Aug 26;111(34):E3562-70
Microsphere priming facilitates induction of potent therapeutic T-cell immune responses against autochthonous liver cancers.
Brinkhoff B, Ostroumov D, Heemcke J, Woller N, Gürlevik E, Manns MP, Longerich T, Zender L, Harty JT, Kubicka S, Kühnel F, Wirth TC
European journal of immunology 2014 Apr;44(4):1213-24
European journal of immunology 2014 Apr;44(4):1213-24
The transcription factor E4bp4/Nfil3 controls commitment to the NK lineage and directly regulates Eomes and Id2 expression.
Male V, Nisoli I, Kostrzewski T, Allan DS, Carlyle JR, Lord GM, Wack A, Brady HJ
The Journal of experimental medicine 2014 Apr 7;211(4):635-42
The Journal of experimental medicine 2014 Apr 7;211(4):635-42
Cutaneous immunosurveillance and regulation of inflammation by group 2 innate lymphoid cells.
Roediger B, Kyle R, Yip KH, Sumaria N, Guy TV, Kim BS, Mitchell AJ, Tay SS, Jain R, Forbes-Blom E, Chen X, Tong PL, Bolton HA, Artis D, Paul WE, Fazekas de St Groth B, Grimbaldeston MA, Le Gros G, Weninger W
Nature immunology 2013 Jun;14(6):564-73
Nature immunology 2013 Jun;14(6):564-73
Low-affinity T cells are programmed to maintain normal primary responses but are impaired in their recall to low-affinity ligands.
Knudson KM, Goplen NP, Cunningham CA, Daniels MA, Teixeiro E
Cell reports 2013 Aug 15;4(3):554-65
Cell reports 2013 Aug 15;4(3):554-65
CCR2 defines a distinct population of NK cells and mediates their migration during influenza virus infection in mice.
van Helden MJ, Zaiss DM, Sijts AJ
PloS one 2012;7(12):e52027
PloS one 2012;7(12):e52027
Population dynamics of naive and memory CD8 T cell responses after antigen stimulations in vivo.
Martin MD, Condotta SA, Harty JT, Badovinac VP
Journal of immunology (Baltimore, Md. : 1950) 2012 Feb 1;188(3):1255-65
Journal of immunology (Baltimore, Md. : 1950) 2012 Feb 1;188(3):1255-65
Heterologous plasmid DNA prime-recombinant human adenovirus 5 boost vaccination generates a stable pool of protective long-lived CD8(+) T effector memory cells specific for a human parasite, Trypanosoma cruzi.
Rigato PO, de Alencar BC, de Vasconcelos JR, Dominguez MR, Araújo AF, Machado AV, Gazzinelli RT, Bruna-Romero O, Rodrigues MM
Infection and immunity 2011 May;79(5):2120-30
Infection and immunity 2011 May;79(5):2120-30
Extreme CD8 T cell requirements for anti-malarial liver-stage immunity following immunization with radiation attenuated sporozoites.
Schmidt NW, Butler NS, Badovinac VP, Harty JT
PLoS pathogens 2010 Jul 15;6(7):e1000998
PLoS pathogens 2010 Jul 15;6(7):e1000998
Cutting edge: adaptive versus innate receptor signals selectively control the pool sizes of murine IFN-γ- or IL-17-producing γδ T cells upon infection.
Ribot JC, Chaves-Ferreira M, d'Orey F, Wencker M, Gonçalves-Sousa N, Decalf J, Simas JP, Hayday AC, Silva-Santos B
Journal of immunology (Baltimore, Md. : 1950) 2010 Dec 1;185(11):6421-6425
Journal of immunology (Baltimore, Md. : 1950) 2010 Dec 1;185(11):6421-6425
Type I IFN signaling constrains IL-17A/F secretion by gammadelta T cells during bacterial infections.
Henry T, Kirimanjeswara GS, Ruby T, Jones JW, Peng K, Perret M, Ho L, Sauer JD, Iwakura Y, Metzger DW, Monack DM
Journal of immunology (Baltimore, Md. : 1950) 2010 Apr 1;184(7):3755-67
Journal of immunology (Baltimore, Md. : 1950) 2010 Apr 1;184(7):3755-67
GITR triggering induces expansion of both effector and regulatory CD4+ T cells in vivo.
van Olffen RW, Koning N, van Gisbergen KP, Wensveen FM, Hoek RM, Boon L, Hamann J, van Lier RA, Nolte MA
Journal of immunology (Baltimore, Md. : 1950) 2009 Jun 15;182(12):7490-500
Journal of immunology (Baltimore, Md. : 1950) 2009 Jun 15;182(12):7490-500
In vivo expression of signaling proteins in reconstituted NK cells.
Orr SJ, Quigley L, McVicar DW
Journal of immunological methods 2009 Jan 30;340(2):158-63
Journal of immunological methods 2009 Jan 30;340(2):158-63
Duration of antigen expression in vivo following DNA immunization modifies the magnitude, contraction, and secondary responses of CD8+ T lymphocytes.
Hovav AH, Panas MW, Rahman S, Sircar P, Gillard G, Cayabyab MJ, Letvin NL
Journal of immunology (Baltimore, Md. : 1950) 2007 Nov 15;179(10):6725-33
Journal of immunology (Baltimore, Md. : 1950) 2007 Nov 15;179(10):6725-33
The impact of a boosting immunogen on the differentiation of secondary memory CD8+ T cells.
Hovav AH, Panas MW, Osuna CE, Cayabyab MJ, Autissier P, Letvin NL
Journal of virology 2007 Dec;81(23):12793-802
Journal of virology 2007 Dec;81(23):12793-802
Interleukin 15-mediated survival of natural killer cells is determined by interactions among Bim, Noxa and Mcl-1.
Huntington ND, Puthalakath H, Gunn P, Naik E, Michalak EM, Smyth MJ, Tabarias H, Degli-Esposti MA, Dewson G, Willis SN, Motoyama N, Huang DC, Nutt SL, Tarlinton DM, Strasser A
Nature immunology 2007 Aug;8(8):856-63
Nature immunology 2007 Aug;8(8):856-63
Expression of the murine CD27 ligand CD70 in vitro and in vivo.
Tesselaar K, Xiao Y, Arens R, van Schijndel GM, Schuurhuis DH, Mebius RE, Borst J, van Lier RA
Journal of immunology (Baltimore, Md. : 1950) 2003 Jan 1;170(1):33-40
Journal of immunology (Baltimore, Md. : 1950) 2003 Jan 1;170(1):33-40
Characterization of murine CD70, the ligand of the TNF receptor family member CD27.
Tesselaar K, Gravestein LA, van Schijndel GM, Borst J, van Lier RA
Journal of immunology (Baltimore, Md. : 1950) 1997 Nov 15;159(10):4959-65
Journal of immunology (Baltimore, Md. : 1950) 1997 Nov 15;159(10):4959-65
Novel mAbs reveal potent co-stimulatory activity of murine CD27.
Gravestein LA, Nieland JD, Kruisbeek AM, Borst J
International immunology 1995 Apr;7(4):551-7
International immunology 1995 Apr;7(4):551-7
No comments: Submit comment
Supportive validation
- Submitted by
- Invitrogen Antibodies (provider)
- Main image
- Experimental details
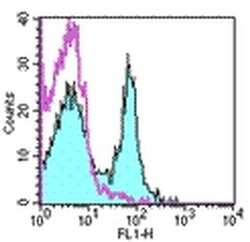
- Staining of mouse splenocytes with 0.25 µg Hamster IgG Isotype Control Purified (Product # 14-4888-81) (open histogram) or 0.25 µg Anti-CD27 Purified (filled histogram) followed by Anti-Armenian Hamster IgG FITC (Product # 11-4111). Total viable cells were used for analysis.

Supportive validation
- Submitted by
- Invitrogen Antibodies (provider)
- Main image
- Experimental details
- NULL
- Submitted by
- Invitrogen Antibodies (provider)
- Main image

- Experimental details
- NULL
- Submitted by
- Invitrogen Antibodies (provider)
- Main image
- Experimental details
- NULL
- Submitted by
- Invitrogen Antibodies (provider)
- Main image

- Experimental details
- NULL
- Submitted by
- Invitrogen Antibodies (provider)
- Main image
- Experimental details
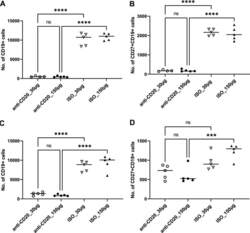
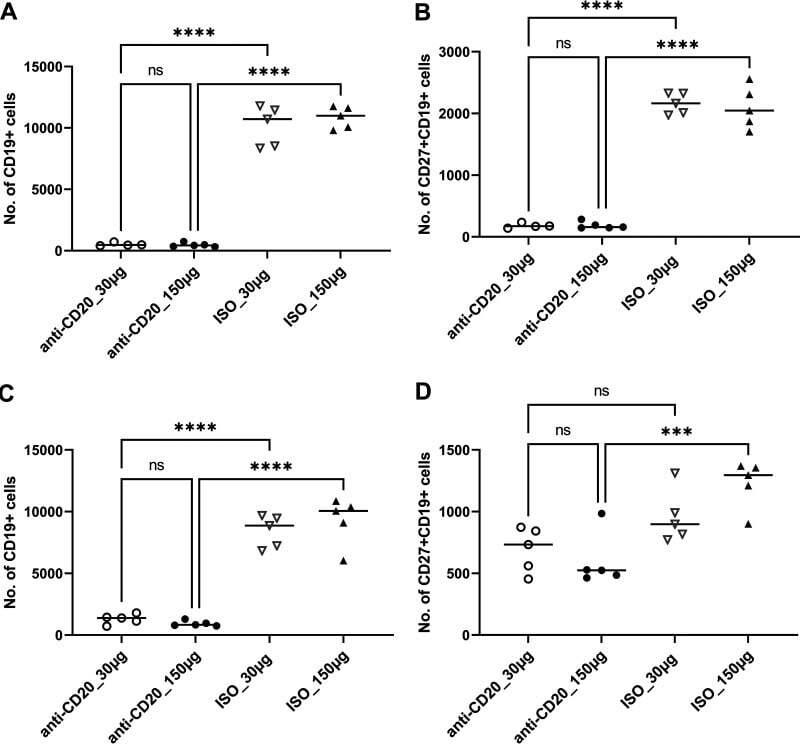
- FIG 1 Lung CD19 + and CD27 + CD19 + cells at day 14 (A and B) and day 28 (C and D) postinfection. C57BL/6 mice were subcutaneously given 30 or 150 mug of anti-CD20 or isotype control antibody weekly. Three days after the first injection, all mice were inoculated with approximately 2 x 10 5 asci of P. murina inoculum. Fourteen or 28 days postinfection, the right upper and lower lung lobes were harvested, and single cells were prepared and stimulated with Pneumocystis (PC) antigen for 6 h followed by staining for cell surface markers and intracellular cytokine staining. For CD19 + and CD27 + CD19 + cells, 100,000 cells were acquired. One-way ANOVA and Tukey's multiple-comparison tests indicated that there were significant differences between anti-CD20 and isotype control antibody (ISO)-treated groups. Statistical significance is indicated as follows: ***, P
- Submitted by
- Invitrogen Antibodies (provider)
- Main image
- Experimental details
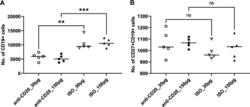
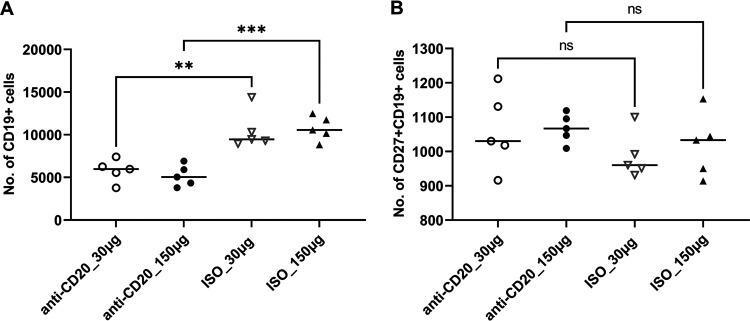
- FIG 6 Lung CD19 + and CD27 + CD19 + cells in secondary PC infection. All mice were inoculated with approximately 2 x 10 5 asci of P. murina inoculum. Six weeks later, the mice were subcutaneously given 30 or 150 mug of anti-CD20 or isotype control antibody weekly. Three days after the first injection, all mice were reinoculated with approximately 2 x 10 5 asci of P. murina inoculum. Fourteen days postinfection, the right upper and lower lung lobes were taken, and single cells were prepared and stimulated with PC antigen for 6 h for surface markers and intracellular cytokine staining. For both CD19 + and CD27 + CD19 + cells, 100,000 cells were acquired. One-way ANOVA and Tukey''s multiple-comparison tests indicated that there were significant differences between anti-CD20- and ISO-treated groups for CD19 + cells but not for CD27 + CD19 + cells. Statistical significance is indicated as follows: **, P
- Submitted by
- Invitrogen Antibodies (provider)
- Main image
- Experimental details
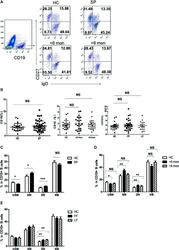
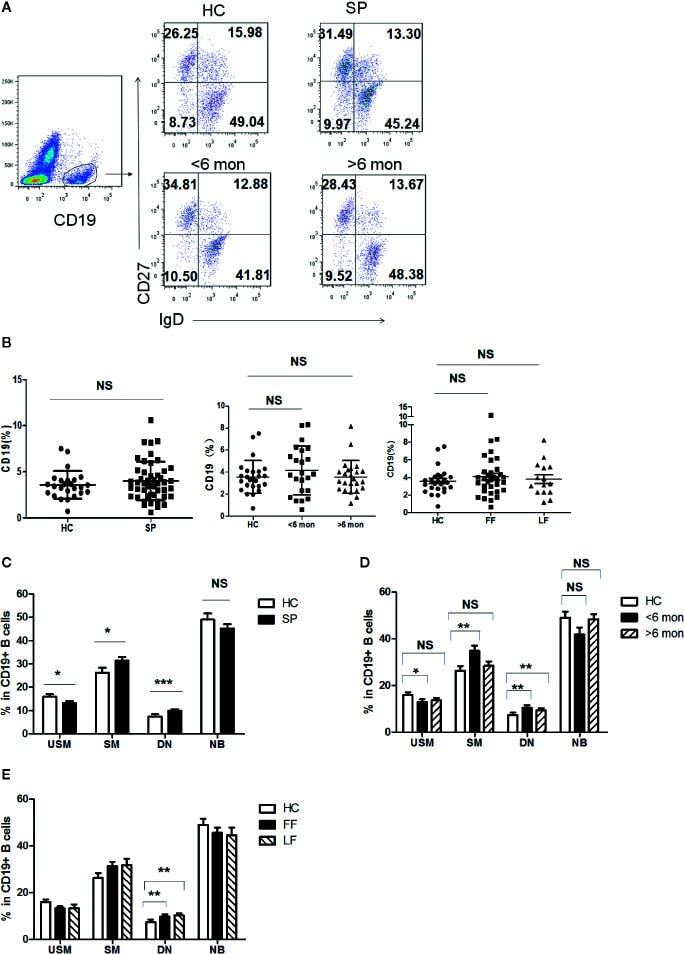
- Figure 3 Phenotypic characterization of circulating B cell subsets in patients and HC. (A) Gated by CD19 + B cells, IgD + CD27 - NB, IgD + CD27 + USM B cells, IgD - CD27 + SM B cells, and IgD - CD27 - DN B cells were identified. The graphs are representative for HC and patients with different duration. Mean value of each B cell subset's percentage is shown in the quadrants. (B) Statistical graphs for comparison of CD19 + B cells' percentages between patient groups and HC. (C-E) Statistical graphs for distinct CD19 + B cells subsets between patients (SP, n = 48; SD, n = 23; LD, n = 25; FF, n = 33; LF, n = 15.) and HC (n = 25). Error bars represent mean+-SD. * P < 0.05, ** P < 0.01, *** P < 0.001, and NS P >= 0.05.
- Submitted by
- Invitrogen Antibodies (provider)
- Main image
- Experimental details
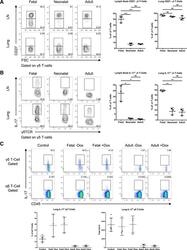
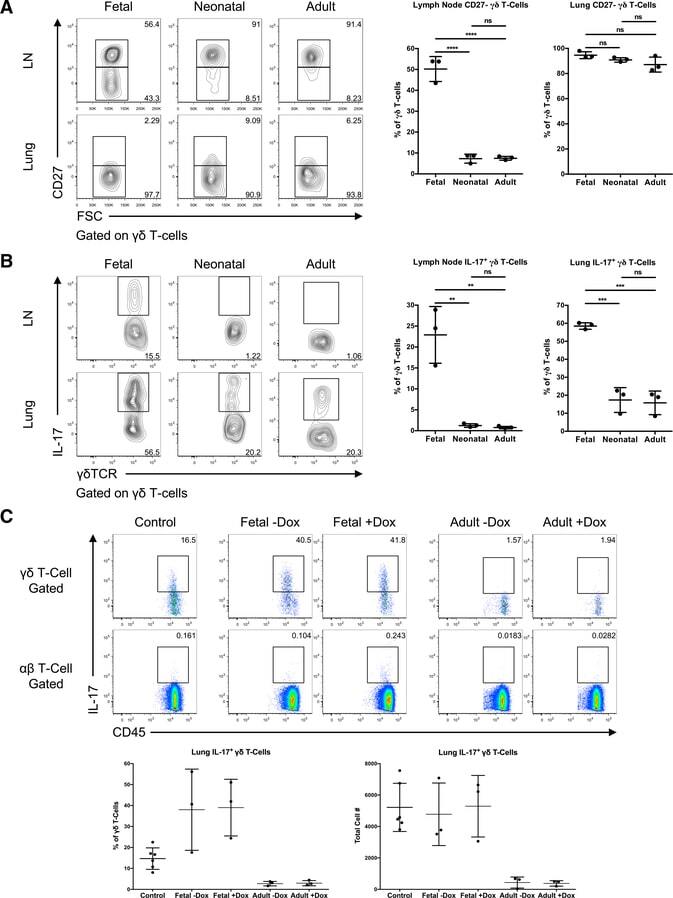
- Figure 3. Ontogenic timing influences gammadeltaT17 generation (A) Flow cytometry analysis of CD27 expression by gammadelta T cells in lymph nodes and lung of fetal-, neonatal-, or adult-induced RBPJ ind mice (left); right panels show percentages. (B) Flow cytometry analysis of IL-17 production by gammadelta T cells in lymph nodes and lung of mice as in (A) stimulated with PMA and ionomycin in vitro (left); right panels show percentages. Data are representative of three independent experiments. Data are presented as means +- standard deviation of three independent experiments. n = 3 mice per group. **p < 0.01, ***p < 0.001, ****p < 0.0001 (one-way ANOVA). (C) Flow cytometry analysis of IL-17 production by gammadelta T cells in lung of control, fetal-, or adult-induced RBPJ ind mice after TDM challenge (top); bottom panels show percentages and numbers. Data are representative of three independent experiments. Data are presented as means +- standard deviation of three independent experiments. n = 6 mice for control; n = 3 mice per fetal- and adult-induced groups. Statistical analyses between groups are found in Figure S2D .
- Submitted by
- Invitrogen Antibodies (provider)
- Main image

- Experimental details
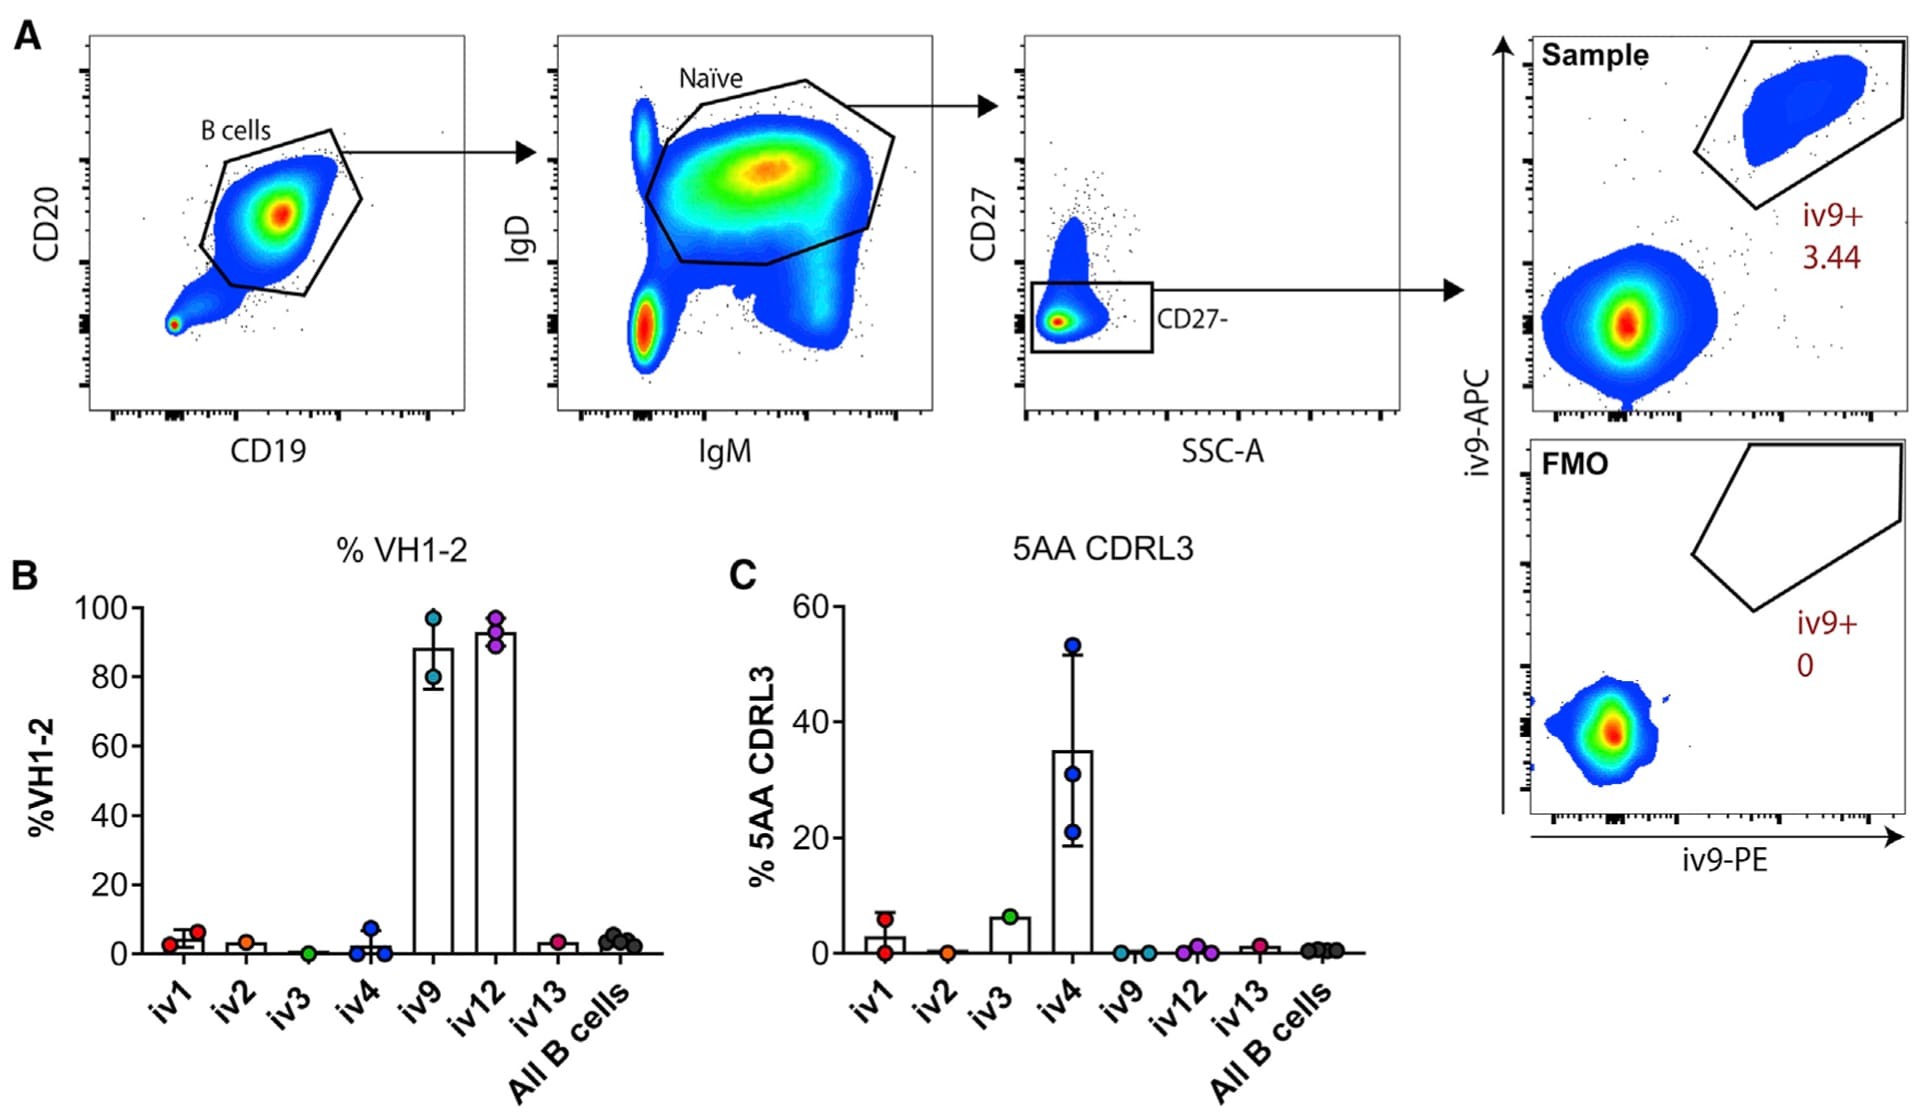
- Figure 2. ai-mAb-specific B cell sorting and sequencing (A) ai-mAbs fluorescently labeled with either phycoerythrin (PE) or allophycocyanin (APC) were used as bait to single-sort CD19 + CD20 + IgD + IgM + CD27 - B cells from PBMCs obtained from healthy, HIV-1-negative donors. VH and VL transcripts were recovered using RT-PCR, and amplicons were Sanger sequenced. (B and C) Frequencies of B cells expressing VH1-2 HC (B) and 5-aa CDRL3 (C) were compared between the different ai-mAbs. Frequencies in total unselected B cells were assessed as control. Data in (B) and (C) are presented as mean +- SD. All frequency data are given in Table S2 .
- Submitted by
- Invitrogen Antibodies (provider)
- Main image
- Experimental details
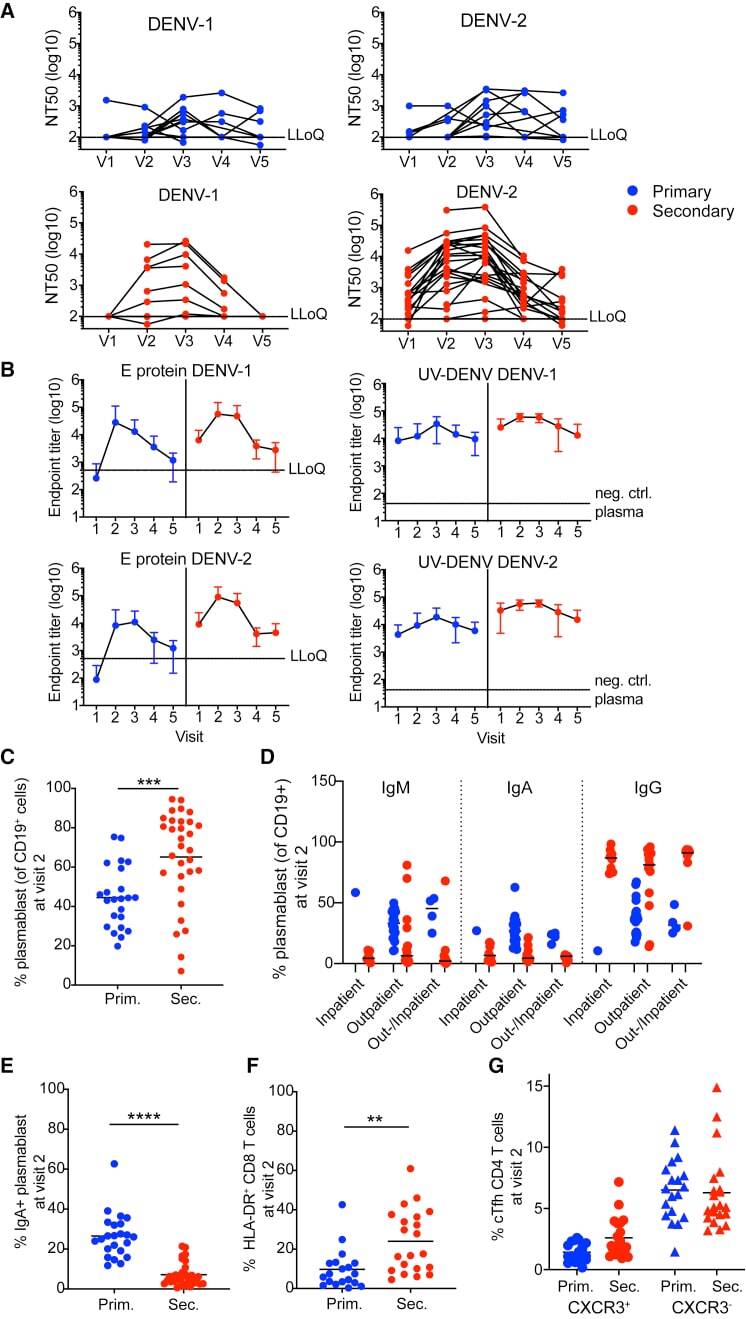
- Figure 6 Primary and secondary status of infection is linked to B cell/antibody readouts (A) NT 50 values of plasma collected at V1-V5 against DENV-1 (left column) or DENV-2 (right column) and for primary patients (top row, blue) or secondary patients (bottom row, red). Each set of connected dots represents 1 patient. (B) Binding of plasma antibodies from V1-V5. ELISA plates were coated with E protein (mostly monomeric, top row) or with UV-inactivated polyethylene glycol (PEG)-precipitated DENV (UV-DENV) (bottom row). E protein ELISA: line indicates the lowest dilution tested (1:500). Endpoint titers for the negative control plasma were 500. UV-DENV ELISA: line indicates the endpoint titer of the negative control plasma (2,500). Lowest dilution tested was 1:100. Primary: blue, secondary: red. Means +- SD are indicated. (C) Frequency of plasmablasts (CD27 + CD38 + ) among CD19 + B cells at V2 for primary and secondary patients. ***p = 0.0007, unpaired t test. Bars indicate the mean. (D) Frequencies of IgA + , IgM + , and IgG + (IgA - IgM - ) plasmablasts during acute disease, stratified according to hospitalization status. Bars indicate the median. (E) IgA expressed at the surface by the plasmablasts in (C); ****p < 0.0001, unpaired t test. Bars indicate the mean (F) Frequency of HLA-DR + cells among CD8 T cells at V2 in primary and secondary patients. **p = 0.002, unpaired t test. Bars indicate the mean. (G) Frequency of CXCR3 + Tfh (circle) or CXCR3 - Tfh (triangle) among CD
- Submitted by
- Invitrogen Antibodies (provider)
- Main image
- Experimental details
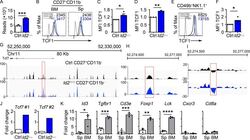
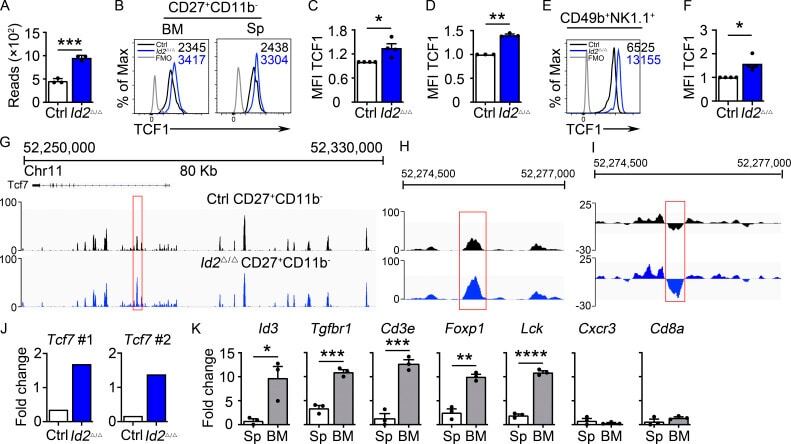
- Figure 2. Dysregulation of Tcf7 /TCF1 in Id2 Delta/Delta NK cells. (A) Tcf7 mRNA in Ctrl and Id2 Delta/Delta NK cells by RNA-seq expressed as normalized reads. Data are from three biological replicates. Error bars represent SD. (B) TCF1 in CD27 + CD11b - NK cells from BM and spleen from Ctrl and Id2 Delta/Delta mice determined by flow cytometry. The MFI of TCF1 is indicated for Ctrl (black) and Id2 Delta/Delta (blue; n = 4 for BM and n = 3 for spleen; data are from independent experiments). (C and D) Summary of relative TCF1 MFI from BM and spleen. MFI of Ctrl NK cells was set as 1 in each experiment. (E) CD49b + -enriched BM NK cells were cultured in IL-15 (20 ng/ml) for 6 d before flow cytometry analysis for TCF1 in NK1.1 + CD49b + cells. The MFI for TCF1 in Ctrl (black) and Id2 Delta/Delta (blue) is shown. (F) Summary of relative TCF1 MFI in IL-15-cultured NK cells. MFI of Ctrl NK cells was set as 1 in each experiment ( n = 4; data are from independent experiments). Error bars represent SEM (C, D, and F). (G) Chromatin accessibility surrounding the Tcf7 gene as determined by ATAC-seq on CD27 + CD11b - NK cells (). Ctrl (black) and ID2-deficient (blue) NK cells. (H) Enhanced view of the indicated region of the Tcf7 intron showing increased chromatin accessibility in ID2-deficient CD27 + CD11b - NK cells. (I) The same region as in H but showing nucleosome depletion. (J) E protein ChIP was performed on chromatin isolated from Ctrl or Id2 Delta/Delta BM NK cells and amplified
- Submitted by
- Invitrogen Antibodies (provider)
- Main image
- Experimental details
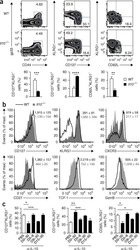
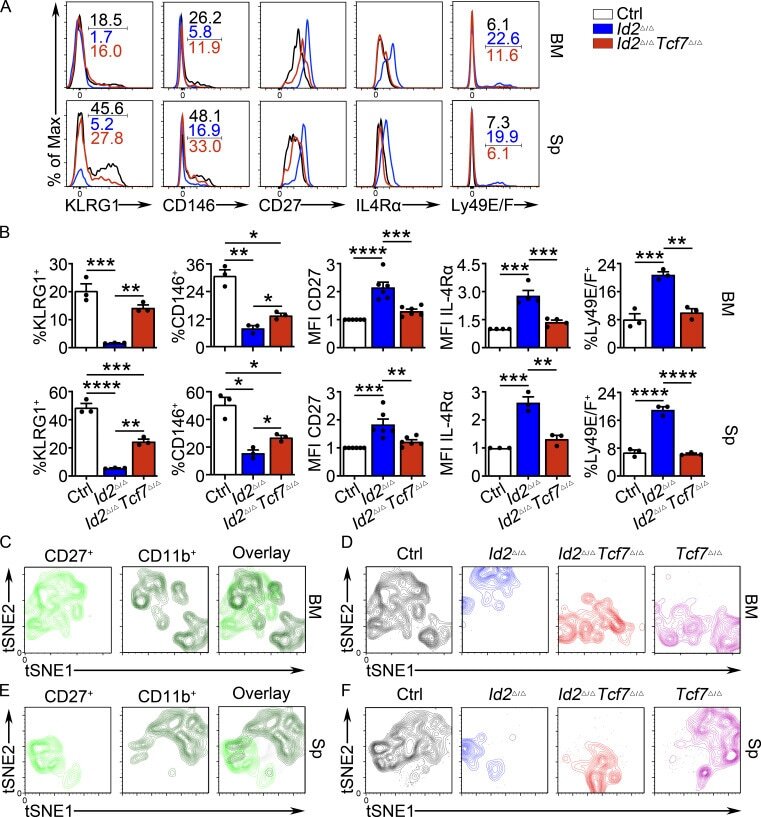
- Figure 6. TCF1 deficiency restores NK cell surface receptor expression in Id2 Delta/Delta NK cells. (A) Flow cytometry plots of different receptors on NK cells of BM (top) and spleen (Sp; bottom) from Id2 Delta/Delta Tcf7 Delta/Delta (red), Id2 Delta/Delta (blue), and Ctrl (black) mice. Numbers are the percentage of cells in the indicated gates. Data represent three to six independent experiments ( n = 3-6 for each group). (B) Summary of data shown in A. MFI of Ctrl NK cells was set as 1 in each experiment for CD27 and IL-4Ralpha. Error bars represent SEM. Statistical significance was determined by one-way ANOVA with Tukey's multiple comparisons test. *, P < 0.05; **, P < 0.01; ***, P < 0.005; ****, P < 0.001. (C and E) BM and spleen tSNE analysis showing expression of CD27 or CD11b on Ctrl NK1.1 + CD49b + NK cells and the overlay of the two markers. Data are representative of two experiments. (D and F) BM and spleen tSNE analysis on NK1.1 + CD49b + NK cells for each of the indicated genotypes. Plots were generated using surface receptors (NK1.1, CD49b, CD27, CD11b, CD49a, KLRG1, CD146, SLAMF6, CD226, IL4Ra, and CXCR3). Data are representative of two experiments.
- Submitted by
- Invitrogen Antibodies (provider)
- Main image
- Experimental details
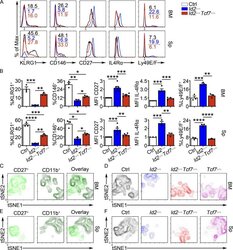
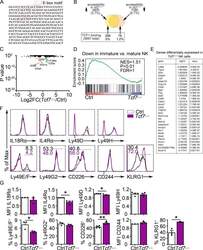
- Figure S2. Altered gene expression in Tcf7 Delta/Delta BM NK cells. (A) Sequence of the intronic region of Tcf7 that shows increased accessibility in ID2-deficient BM CD27 + CD11b - NK cells. (B) Schematic representation of the overlap between regions with altered chromatin accessibility in ID2-deficient CD27 + CD11b - NK cells by ATAC-seq and TCF1 binding sites in CD8 T cells determined by ChIP-seq (Gene Expression Omnibus accession no. GSE73239 ). Regions with increased accessibility by ATAC-seq are shown in yellow, decreased accessibility in peach, and no change in orange. TCF1 binding sites are significantly enriched in ATAC-seq regions that gain accessibility in ID2-deficient cells. P < 1.846 10-66 (Fisher's exact test). (C) Volcano plot showing Log2FC versus adj. P values for RNA-seq data from Tcf7 Delta/Delta and Ctrl NK cells. Data were generated from three biological replicates. (D) GSEA for Ctrl versus Tcf7 Delta/Delta NK cell RNA expression. (E) Table showing differentially expressed genes from RNA-seq data shown in C . (F) Flow cytometry plots of different proteins on NK cells of spleen from Tcf7 Delta/Delta and Ctrl mice ( n = 3-4 for each group from independent experiments). (G) Summary of the data in F. Error bars represent SEM. Statistical significance was determined by two-tailed unpaired t test. *, P < 0.05; **, P < 0.01. FDR, false discovery rate; NES, normalized enrichment score.

- Submitted by
- Invitrogen Antibodies (provider)
- Main image
- Experimental details
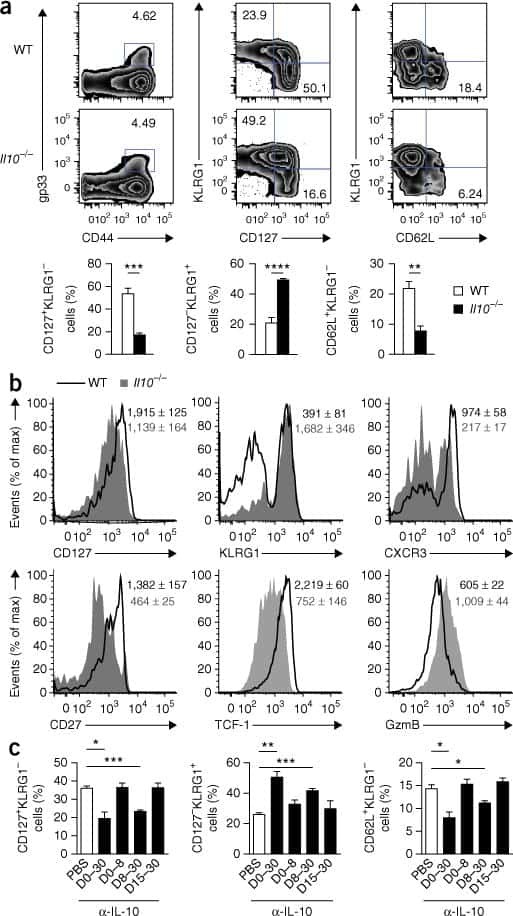
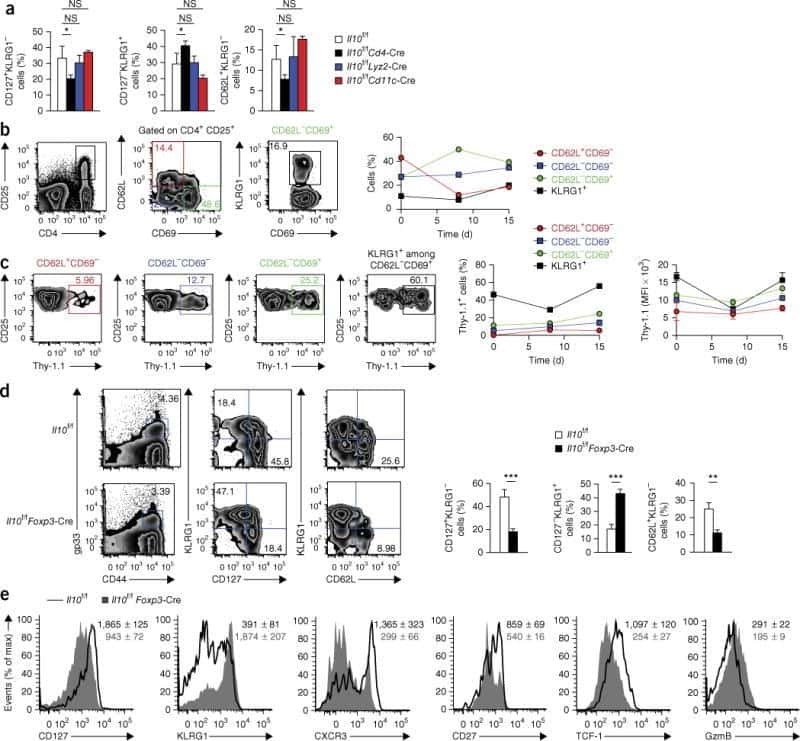
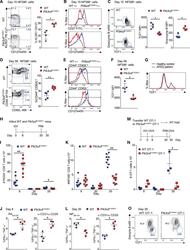
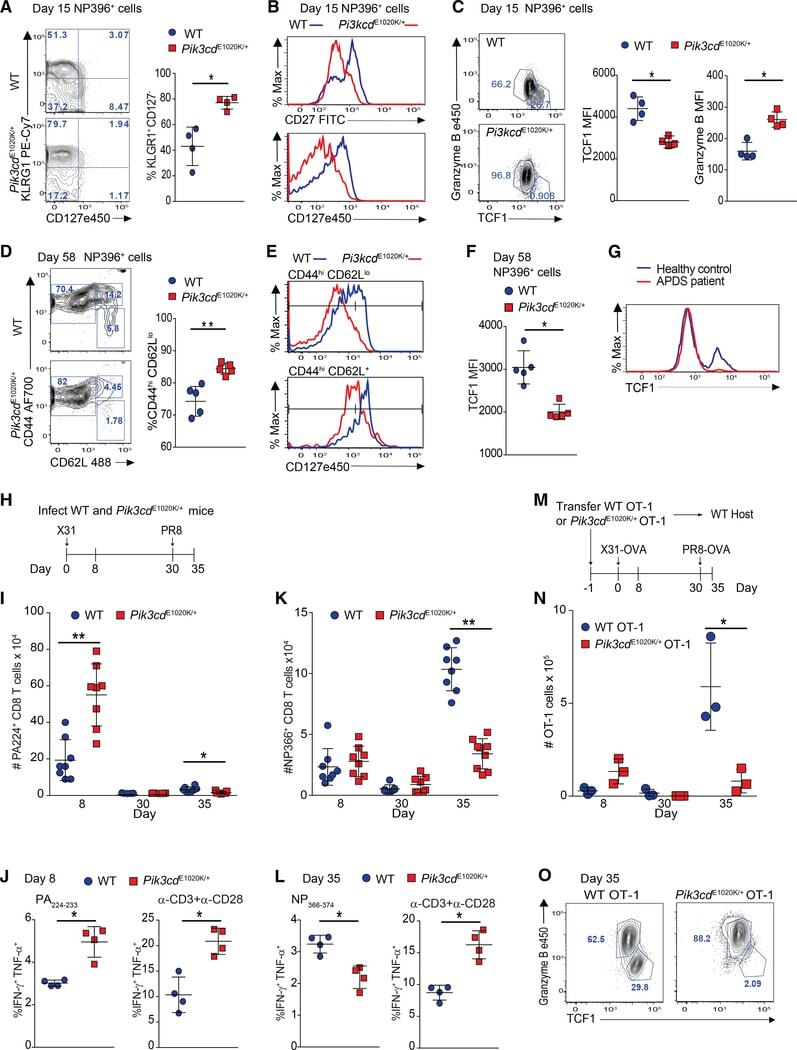
- Figure 3. Pik3cd E1020K/+ mice fail to develop a robust T CM population (A-F) Viable CD8 + splenocytes from mice infected with LCMV Armstrong (n = 2, 4-5/group/time point). (A-C) NP396-specific CD8 + cells day 15 p.i. (A) CD127 and KLRG1 expression (left: representative staining; right: %KLRG1 + CD127 - ). (B) Representative histogram of CD27 (top) and CD127 (bottom). (C) GzmB and TCF1 staining. Middle: TCF1 MFI; right: GzmB MFI. (D-F) NP396-specific CD8 + cells day 58 p.i. (D) CD44 and CD62L staining. Representative flow (left), % CD44 hi CD62L lo cells (right). (E) CD127 histograms: CD44 hi CD62L lo (top) and CD44 hi CD62L + (bottom). (F) TCF1 MFI. (G) TCF1 staining of allo-reactive CD8 + cells from healthy controls and patients with APDS (n = 2, representative histogram). (H-L) Mice were infected with X31 and challenged with PR8 (n = 2, 3-5 mice/genotype/time point). (H) Infection outline. (I) PA224-specific CD8 + cell numbers. (J) IFN-gamma and TNF-alpha from day 8 cells stimulated with either PA 224-233 (left) or anti-CD3 plus anti-CD28 (right). (K) NP366-specific CD8 + T cell numbers. (L) IFN-gamma and TNF-alpha from day 35 cells stimulated with either NP 366-374 (left) or anti-CD3 plus anti-CD28 (right). (M-O) OT-1 cells were transferred into congenic hosts, infected with influenza X31-OVA and challenged with PR8-OVA (n = 2, 3 mice/genotype/time point). (M) Outline. (N) Viable OT-1 cell numbers. (O) TCF1 and GzmB expression in OT-1 cells on day 35. Representative exper
- Submitted by
- Invitrogen Antibodies (provider)
- Main image
- Experimental details
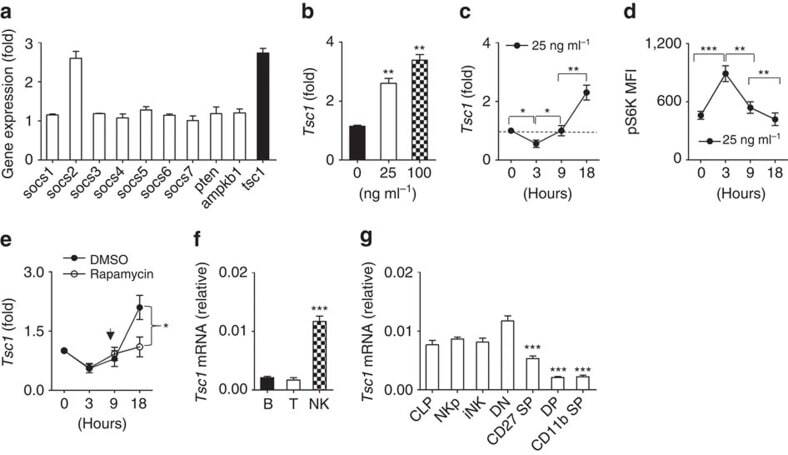
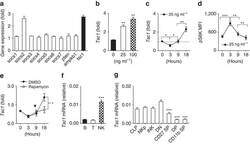
- Figure 1 Dynamic Tsc1 expression following IL-15 stimulation. ( a - c ) Quantitative reverse transcription-PCR (RT-PCR) analysis of the indicated genes in sorted CD3 - NK1.1 + cells from the spleen of WT mice before and after stimulation with 25 ng ml -1 IL-15 for 18 h ( a ), various concentration of IL-15 ( b ), or at the indicated time points ( c ). ( d ) Intracellular phosphorylated S6 in sorted NK cells after stimulation with 25 ng ml -1 IL-15 was detected by flow cytometry at the indicated time points, and the mean fluorescence intensity was calculated. ( e ) Tsc1 messenger RNA (mRNA) expression was analysed by quantitative RT-PCR in sorted CD3 - NK1.1 + cells after stimulation with 25 ng ml -1 IL-15 for 18 h in the presence of DMSO or rapamycin (10 nM). ( f ) Analysis of Tsc1 mRNA expression in sorted T, B and NK cells by quantitative PCR. (g) Analysis of Tsc1 mRNA expression in CLP, NKp and immature NK cells (iNK), and NK cell subsets, including CD27 - CD11b - (DN), CD27 + CD11b - (CD27 SP), CD27 + CD11b + (DP) and CD27 - CD11b + (CD11b SP), by quantitative PCR. The results were normalized to beta- actin ( f , g ) or are presented relative to expression in untreated cells, which was set as 1 ( a - c , e ). Value represent mean+-s.d. * P