Explore
 Validate
 Learn
Learn Flow cytometry
 Blocking/Neutralizing
Antibody data
- Antibody Data
- Antigen structure
- References [20]
- Comments [0]
- Validations
- Flow cytometry [1]
- Other assay [16]
Submit
Validation data
Reference
Comment
Report error
- Product number
- 16-0271-85 - Provider product page

- Provider
- Invitrogen Antibodies
- Product name
- CD27 Monoclonal Antibody (LG.7F9), Functional Grade, eBioscience™
- Antibody type
- Monoclonal
- Antigen
- Other
- Description
- Description: The LG.7F9 monoclonal antibody reacts with mouse CD27, a lymphocyte-specific member of the TNFR superfamily. CD27 is expressed by virtually all mature T cells and by a subpopulation of B cells, mainly memory B cells. In mouse, CD27 has been found on nearly all thymocytes excluding a population of CD46-CD8- precursors. CD27 binds to CD70 and, through this interaction, plays an important role in T cell-B cell interaction. It has been reported that triggering CD27 plays an important role in the maturation of CD4+ and CD8+ effector cells. LG.7F9 cross-reacts with human and rat CD27. Applications Reported: The LG.7F9 antibody has been reported for use in flow cytometric analysis. LG.7F9 has also been reported in blocking of ligand binding. Applications Tested: The LG.7F9 antibody has been tested by flow cytometric analysis of mouse splenocytes. This can be used at less than or equal to 0.5 µg per test. A test is defined as the amount (µg) of antibody that will stain a cell sample in a final volume of 100 µL. Cell number should be determined empirically but can range from 10^5 to 10^8 cells/test. It is recommended that the antibody be carefully titrated for optimal performance in the assay of interest. Storage and handling: Use in a sterile environment. Filtration: 0.2 µm post-manufacturing filtered. Purity: Greater than 90%, as determined by SDS-PAGE. Endotoxin Level: Less than 0.001 ng/µg antibody, as determined by LAL assay. Aggregation: Less than 10%, as determined by HPLC.
- Reactivity
- Human, Mouse, Rat
- Isotype
- IgG
- Antibody clone number
- LG.7F9
- Vial size
- 500 µg
- Concentration
- 1 mg/mL
- Storage
- 4° C
Submitted references PI3Kδ coordinates transcriptional, chromatin, and metabolic changes to promote effector CD8(+) T cells at the expense of central memory.
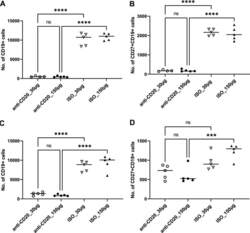
Effect of Subcutaneous Anti-CD20 Antibody-Mediated B Cell Depletion on Susceptibility to Pneumocystis Infection in Mice.
Development of a VRC01-class germline targeting immunogen derived from anti-idiotypic antibodies.
Immune cell phenotypes associated with disease severity and long-term neutralizing antibody titers after natural dengue virus infection.
Ontogenic timing, T cell receptor signal strength, and Notch signaling direct γδ T cell functional differentiation in vivo.
The transcriptional repressor ID2 supports natural killer cell maturation by controlling TCF1 amplitude.
Th2 Biased Immunity With Altered B Cell Profiles in Circulation of Patients With Sporotrichosis Caused by Sporothrix globosa.
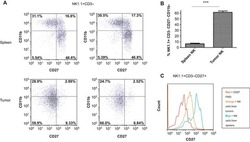
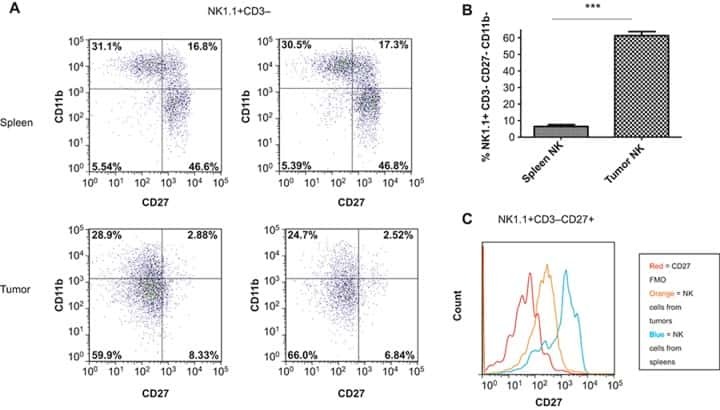
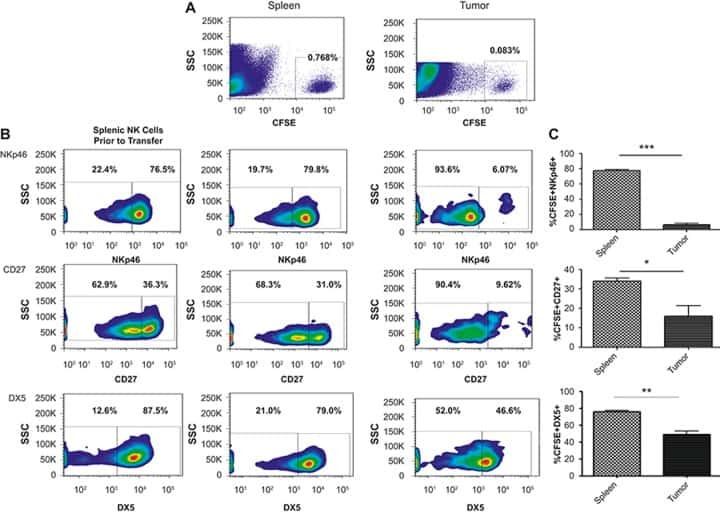
The breast tumor microenvironment alters the phenotype and function of natural killer cells.
NK cell development requires Tsc1-dependent negative regulation of IL-15-triggered mTORC1 activation.
Sirt6 regulates dendritic cell differentiation, maturation, and function.
Production of IL-10 by CD4(+) regulatory T cells during the resolution of infection promotes the maturation of memory CD8(+) T cells.
Costimulation via the tumor-necrosis factor receptor superfamily couples TCR signal strength to the thymic differentiation of regulatory T cells.
Tissue-resident natural killer (NK) cells are cell lineages distinct from thymic and conventional splenic NK cells.
Tissue-resident natural killer (NK) cells are cell lineages distinct from thymic and conventional splenic NK cells.
Pathogen-induced proapoptotic phenotype and high CD95 (Fas) expression accompany a suboptimal CD8+ T-cell response: reversal by adenoviral vaccine.
The bone marrow functions as the central site of proliferation for long-lived NK cells.
CD8 T cells recruited early in mouse polyomavirus infection undergo exhaustion.
STAT6 deletion converts the Th2 inflammatory pathology afflicting Lat(Y136F) mice into a lymphoproliferative disorder involving Th1 and CD8 effector T cells.
T cell-independent development and induction of somatic hypermutation in human IgM+ IgD+ CD27+ B cells.
Characterization of murine CD70, the ligand of the TNF receptor family member CD27.
Cannons JL, Villarino AV, Kapnick SM, Preite S, Shih HY, Gomez-Rodriguez J, Kaul Z, Shibata H, Reilley JM, Huang B, Handon R, McBain IT, Gossa S, Wu T, Su HC, McGavern DB, O'Shea JJ, McGuire PJ, Uzel G, Schwartzberg PL
Cell reports 2021 Oct 12;37(2):109804
Cell reports 2021 Oct 12;37(2):109804
Effect of Subcutaneous Anti-CD20 Antibody-Mediated B Cell Depletion on Susceptibility to Pneumocystis Infection in Mice.
Dai G, Noell K, Weckbecker G, Kolls JK
mSphere 2021 May 5;6(3)
mSphere 2021 May 5;6(3)
Development of a VRC01-class germline targeting immunogen derived from anti-idiotypic antibodies.
Seydoux E, Wan YH, Feng J, Wall A, Aljedani S, Homad LJ, MacCamy AJ, Weidle C, Gray MD, Brumage L, Taylor JJ, Pancera M, Stamatatos L, McGuire AT
Cell reports 2021 May 4;35(5):109084
Cell reports 2021 May 4;35(5):109084
Immune cell phenotypes associated with disease severity and long-term neutralizing antibody titers after natural dengue virus infection.
Rouers A, Chng MHY, Lee B, Rajapakse MP, Kaur K, Toh YX, Sathiakumar D, Loy T, Thein TL, Lim VWX, Singhal A, Yeo TW, Leo YS, Vora KA, Casimiro D, Lim B, Tucker-Kellogg L, Rivino L, Newell EW, Fink K
Cell reports. Medicine 2021 May 18;2(5):100278
Cell reports. Medicine 2021 May 18;2(5):100278
Ontogenic timing, T cell receptor signal strength, and Notch signaling direct γδ T cell functional differentiation in vivo.
Chen ELY, Lee CR, Thompson PK, Wiest DL, Anderson MK, Zúñiga-Pflücker JC
Cell reports 2021 Jun 8;35(10):109227
Cell reports 2021 Jun 8;35(10):109227
The transcriptional repressor ID2 supports natural killer cell maturation by controlling TCF1 amplitude.
Li ZY, Morman RE, Hegermiller E, Sun M, Bartom ET, Maienschein-Cline M, Sigvardsson M, Kee BL
The Journal of experimental medicine 2021 Jun 7;218(6)
The Journal of experimental medicine 2021 Jun 7;218(6)
Th2 Biased Immunity With Altered B Cell Profiles in Circulation of Patients With Sporotrichosis Caused by Sporothrix globosa.
Zu J, Yao L, Song Y, Cui Y, Guan M, Chen R, Zhen Y, Li S
Frontiers in immunology 2020;11:570888
Frontiers in immunology 2020;11:570888
The breast tumor microenvironment alters the phenotype and function of natural killer cells.
Krneta T, Gillgrass A, Chew M, Ashkar AA
Cellular & molecular immunology 2016 Sep;13(5):628-39
Cellular & molecular immunology 2016 Sep;13(5):628-39
NK cell development requires Tsc1-dependent negative regulation of IL-15-triggered mTORC1 activation.
Yang M, Chen S, Du J, He J, Wang Y, Li Z, Liu G, Peng W, Zeng X, Li D, Xu P, Guo W, Chang Z, Wang S, Tian Z, Dong Z
Nature communications 2016 Sep 7;7:12730
Nature communications 2016 Sep 7;7:12730
Sirt6 regulates dendritic cell differentiation, maturation, and function.
Lasigliè D, Boero S, Bauer I, Morando S, Damonte P, Cea M, Monacelli F, Odetti P, Ballestrero A, Uccelli A, Mostoslavsky R, Poggi A, Nencioni A
Aging 2016 Jan;8(1):34-49
Aging 2016 Jan;8(1):34-49
Production of IL-10 by CD4(+) regulatory T cells during the resolution of infection promotes the maturation of memory CD8(+) T cells.
Laidlaw BJ, Cui W, Amezquita RA, Gray SM, Guan T, Lu Y, Kobayashi Y, Flavell RA, Kleinstein SH, Craft J, Kaech SM
Nature immunology 2015 Aug;16(8):871-9
Nature immunology 2015 Aug;16(8):871-9
Costimulation via the tumor-necrosis factor receptor superfamily couples TCR signal strength to the thymic differentiation of regulatory T cells.
Mahmud SA, Manlove LS, Schmitz HM, Xing Y, Wang Y, Owen DL, Schenkel JM, Boomer JS, Green JM, Yagita H, Chi H, Hogquist KA, Farrar MA
Nature immunology 2014 May;15(5):473-81
Nature immunology 2014 May;15(5):473-81
Tissue-resident natural killer (NK) cells are cell lineages distinct from thymic and conventional splenic NK cells.
Sojka DK, Plougastel-Douglas B, Yang L, Pak-Wittel MA, Artyomov MN, Ivanova Y, Zhong C, Chase JM, Rothman PB, Yu J, Riley JK, Zhu J, Tian Z, Yokoyama WM
eLife 2014 Jan 1;3:e01659
eLife 2014 Jan 1;3:e01659
Pathogen-induced proapoptotic phenotype and high CD95 (Fas) expression accompany a suboptimal CD8+ T-cell response: reversal by adenoviral vaccine.
Vasconcelos JR, Bruña-Romero O, Araújo AF, Dominguez MR, Ersching J, de Alencar BC, Machado AV, Gazzinelli RT, Bortoluci KR, Amarante-Mendes GP, Lopes MF, Rodrigues MM
PLoS pathogens 2012;8(5):e1002699
PLoS pathogens 2012;8(5):e1002699
The bone marrow functions as the central site of proliferation for long-lived NK cells.
van Helden MJ, de Graaf N, Boog CJ, Topham DJ, Zaiss DM, Sijts AJ
Journal of immunology (Baltimore, Md. : 1950) 2012 Sep 1;189(5):2333-7
Journal of immunology (Baltimore, Md. : 1950) 2012 Sep 1;189(5):2333-7
CD8 T cells recruited early in mouse polyomavirus infection undergo exhaustion.
Wilson JJ, Pack CD, Lin E, Frost EL, Albrecht JA, Hadley A, Hofstetter AR, Tevethia SS, Schell TD, Lukacher AE
Journal of immunology (Baltimore, Md. : 1950) 2012 May 1;188(9):4340-8
Journal of immunology (Baltimore, Md. : 1950) 2012 May 1;188(9):4340-8
STAT6 deletion converts the Th2 inflammatory pathology afflicting Lat(Y136F) mice into a lymphoproliferative disorder involving Th1 and CD8 effector T cells.
Archambaud C, Sansoni A, Mingueneau M, Devilard E, Delsol G, Malissen B, Malissen M
Journal of immunology (Baltimore, Md. : 1950) 2009 Mar 1;182(5):2680-9
Journal of immunology (Baltimore, Md. : 1950) 2009 Mar 1;182(5):2680-9
T cell-independent development and induction of somatic hypermutation in human IgM+ IgD+ CD27+ B cells.
Scheeren FA, Nagasawa M, Weijer K, Cupedo T, Kirberg J, Legrand N, Spits H
The Journal of experimental medicine 2008 Sep 1;205(9):2033-42
The Journal of experimental medicine 2008 Sep 1;205(9):2033-42
Characterization of murine CD70, the ligand of the TNF receptor family member CD27.
Tesselaar K, Gravestein LA, van Schijndel GM, Borst J, van Lier RA
Journal of immunology (Baltimore, Md. : 1950) 1997 Nov 15;159(10):4959-65
Journal of immunology (Baltimore, Md. : 1950) 1997 Nov 15;159(10):4959-65
No comments: Submit comment
Supportive validation
- Submitted by
- Invitrogen Antibodies (provider)
- Main image

- Experimental details
- Staining of BALB/c splenocytes with 0.25 µg Armenian Hamster IgG Isotype Control Purified (Product # 14-4888-81) (open histogram) or 0.25 µg Anti-CD27 Functional Grade Purified (filled histogram) followed by Anti-Armenian Hamster IgG FITC (Product # 11-4111).Total viable cells were analyzed.

Supportive validation
- Submitted by
- Invitrogen Antibodies (provider)
- Main image
- Experimental details
- NULL
- Submitted by
- Invitrogen Antibodies (provider)
- Main image

- Experimental details
- NULL
- Submitted by
- Invitrogen Antibodies (provider)
- Main image
- Experimental details
- NULL
- Submitted by
- Invitrogen Antibodies (provider)
- Main image

- Experimental details
- NULL
- Submitted by
- Invitrogen Antibodies (provider)
- Main image

- Experimental details
- NULL

- Submitted by
- Invitrogen Antibodies (provider)
- Main image
- Experimental details
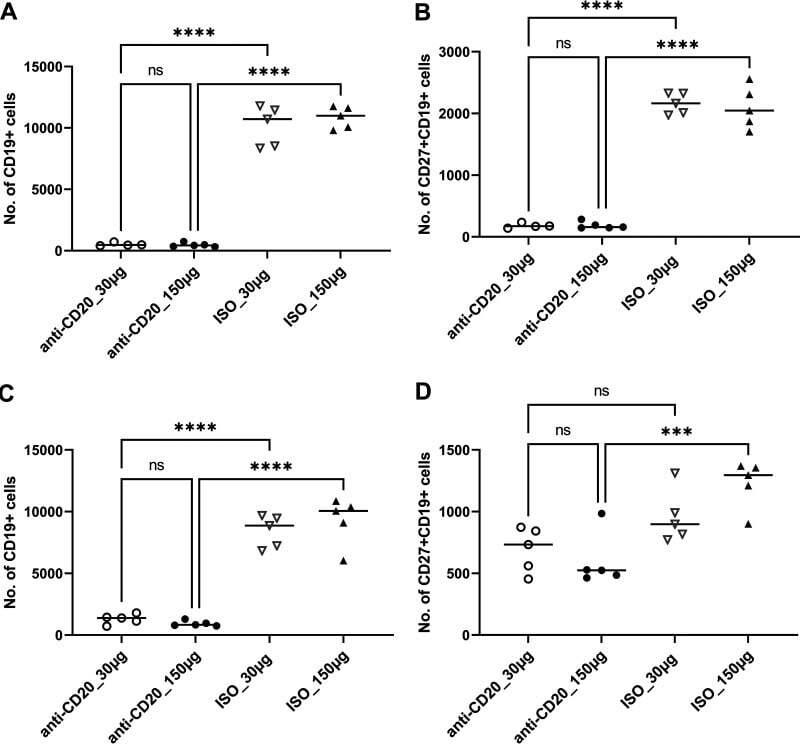
- FIG 1 Lung CD19 + and CD27 + CD19 + cells at day 14 (A and B) and day 28 (C and D) postinfection. C57BL/6 mice were subcutaneously given 30 or 150 mug of anti-CD20 or isotype control antibody weekly. Three days after the first injection, all mice were inoculated with approximately 2 x 10 5 asci of P. murina inoculum. Fourteen or 28 days postinfection, the right upper and lower lung lobes were harvested, and single cells were prepared and stimulated with Pneumocystis (PC) antigen for 6 h followed by staining for cell surface markers and intracellular cytokine staining. For CD19 + and CD27 + CD19 + cells, 100,000 cells were acquired. One-way ANOVA and Tukey's multiple-comparison tests indicated that there were significant differences between anti-CD20 and isotype control antibody (ISO)-treated groups. Statistical significance is indicated as follows: ***, P
- Submitted by
- Invitrogen Antibodies (provider)
- Main image
- Experimental details
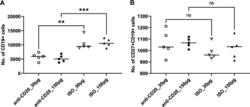
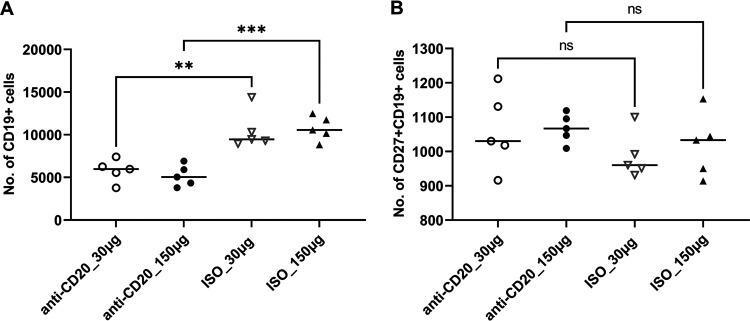
- FIG 6 Lung CD19 + and CD27 + CD19 + cells in secondary PC infection. All mice were inoculated with approximately 2 x 10 5 asci of P. murina inoculum. Six weeks later, the mice were subcutaneously given 30 or 150 mug of anti-CD20 or isotype control antibody weekly. Three days after the first injection, all mice were reinoculated with approximately 2 x 10 5 asci of P. murina inoculum. Fourteen days postinfection, the right upper and lower lung lobes were taken, and single cells were prepared and stimulated with PC antigen for 6 h for surface markers and intracellular cytokine staining. For both CD19 + and CD27 + CD19 + cells, 100,000 cells were acquired. One-way ANOVA and Tukey''s multiple-comparison tests indicated that there were significant differences between anti-CD20- and ISO-treated groups for CD19 + cells but not for CD27 + CD19 + cells. Statistical significance is indicated as follows: **, P
- Submitted by
- Invitrogen Antibodies (provider)
- Main image
- Experimental details
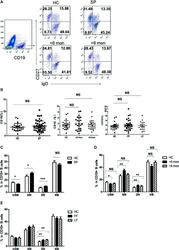
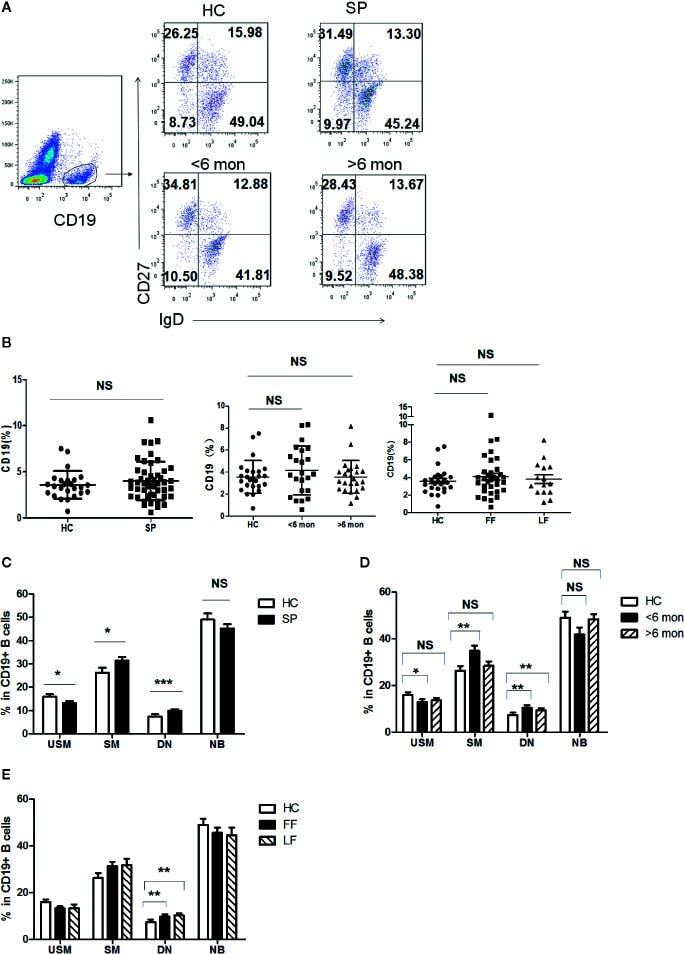
- Figure 3 Phenotypic characterization of circulating B cell subsets in patients and HC. (A) Gated by CD19 + B cells, IgD + CD27 - NB, IgD + CD27 + USM B cells, IgD - CD27 + SM B cells, and IgD - CD27 - DN B cells were identified. The graphs are representative for HC and patients with different duration. Mean value of each B cell subset's percentage is shown in the quadrants. (B) Statistical graphs for comparison of CD19 + B cells' percentages between patient groups and HC. (C-E) Statistical graphs for distinct CD19 + B cells subsets between patients (SP, n = 48; SD, n = 23; LD, n = 25; FF, n = 33; LF, n = 15.) and HC (n = 25). Error bars represent mean+-SD. * P < 0.05, ** P < 0.01, *** P < 0.001, and NS P >= 0.05.
- Submitted by
- Invitrogen Antibodies (provider)
- Main image
- Experimental details
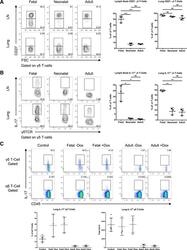
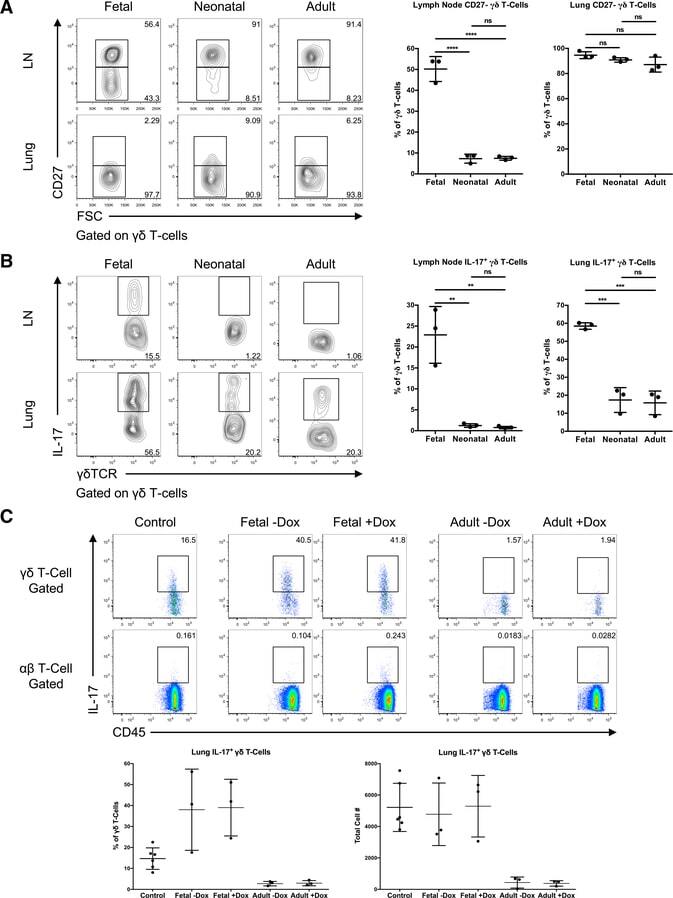
- Figure 3. Ontogenic timing influences gammadeltaT17 generation (A) Flow cytometry analysis of CD27 expression by gammadelta T cells in lymph nodes and lung of fetal-, neonatal-, or adult-induced RBPJ ind mice (left); right panels show percentages. (B) Flow cytometry analysis of IL-17 production by gammadelta T cells in lymph nodes and lung of mice as in (A) stimulated with PMA and ionomycin in vitro (left); right panels show percentages. Data are representative of three independent experiments. Data are presented as means +- standard deviation of three independent experiments. n = 3 mice per group. **p < 0.01, ***p < 0.001, ****p < 0.0001 (one-way ANOVA). (C) Flow cytometry analysis of IL-17 production by gammadelta T cells in lung of control, fetal-, or adult-induced RBPJ ind mice after TDM challenge (top); bottom panels show percentages and numbers. Data are representative of three independent experiments. Data are presented as means +- standard deviation of three independent experiments. n = 6 mice for control; n = 3 mice per fetal- and adult-induced groups. Statistical analyses between groups are found in Figure S2D .
- Submitted by
- Invitrogen Antibodies (provider)
- Main image

- Experimental details
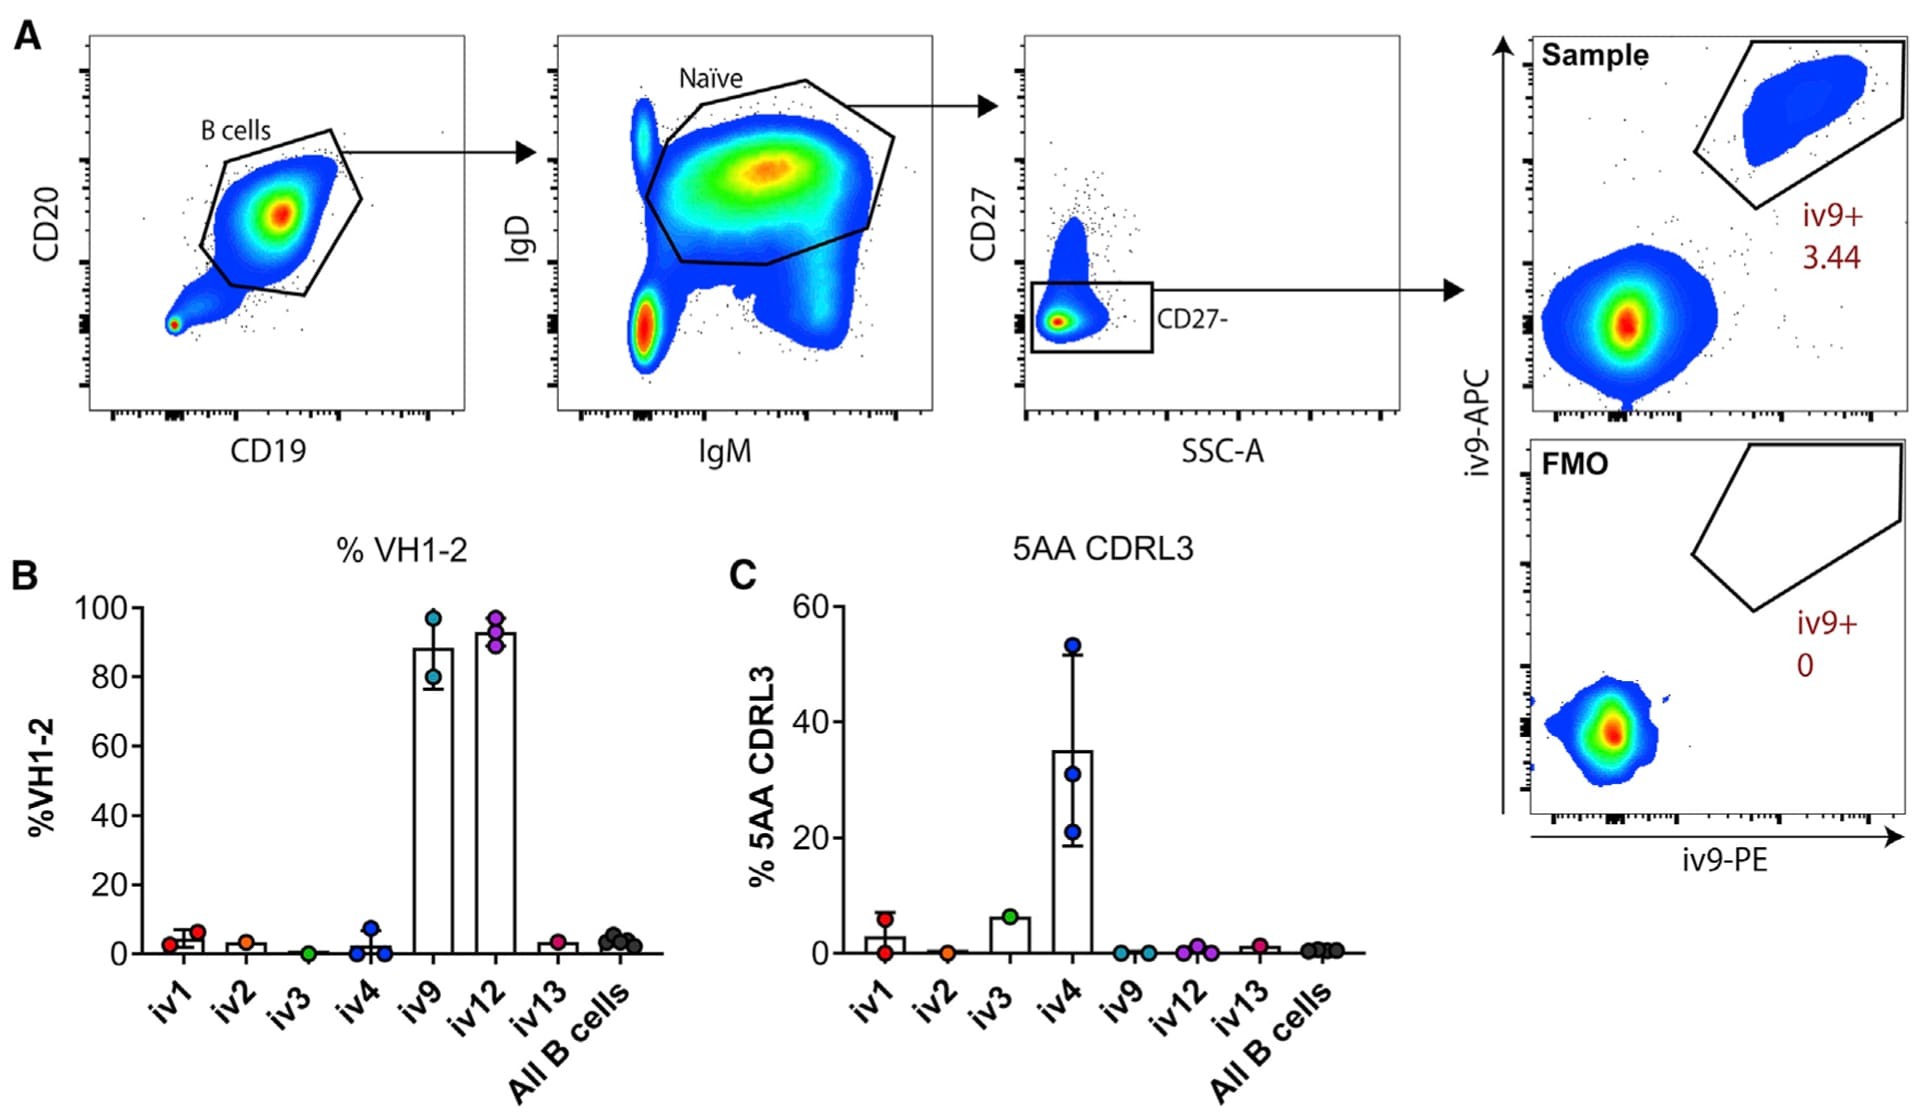
- Figure 2. ai-mAb-specific B cell sorting and sequencing (A) ai-mAbs fluorescently labeled with either phycoerythrin (PE) or allophycocyanin (APC) were used as bait to single-sort CD19 + CD20 + IgD + IgM + CD27 - B cells from PBMCs obtained from healthy, HIV-1-negative donors. VH and VL transcripts were recovered using RT-PCR, and amplicons were Sanger sequenced. (B and C) Frequencies of B cells expressing VH1-2 HC (B) and 5-aa CDRL3 (C) were compared between the different ai-mAbs. Frequencies in total unselected B cells were assessed as control. Data in (B) and (C) are presented as mean +- SD. All frequency data are given in Table S2 .
- Submitted by
- Invitrogen Antibodies (provider)
- Main image
- Experimental details
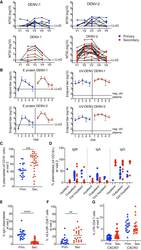
- Figure 6 Primary and secondary status of infection is linked to B cell/antibody readouts (A) NT 50 values of plasma collected at V1-V5 against DENV-1 (left column) or DENV-2 (right column) and for primary patients (top row, blue) or secondary patients (bottom row, red). Each set of connected dots represents 1 patient. (B) Binding of plasma antibodies from V1-V5. ELISA plates were coated with E protein (mostly monomeric, top row) or with UV-inactivated polyethylene glycol (PEG)-precipitated DENV (UV-DENV) (bottom row). E protein ELISA: line indicates the lowest dilution tested (1:500). Endpoint titers for the negative control plasma were 500. UV-DENV ELISA: line indicates the endpoint titer of the negative control plasma (2,500). Lowest dilution tested was 1:100. Primary: blue, secondary: red. Means +- SD are indicated. (C) Frequency of plasmablasts (CD27 + CD38 + ) among CD19 + B cells at V2 for primary and secondary patients. ***p = 0.0007, unpaired t test. Bars indicate the mean. (D) Frequencies of IgA + , IgM + , and IgG + (IgA - IgM - ) plasmablasts during acute disease, stratified according to hospitalization status. Bars indicate the median. (E) IgA expressed at the surface by the plasmablasts in (C); ****p < 0.0001, unpaired t test. Bars indicate the mean (F) Frequency of HLA-DR + cells among CD8 T cells at V2 in primary and secondary patients. **p = 0.002, unpaired t test. Bars indicate the mean. (G) Frequency of CXCR3 + Tfh (circle) or CXCR3 - Tfh (triangle) among CD
- Submitted by
- Invitrogen Antibodies (provider)
- Main image
- Experimental details
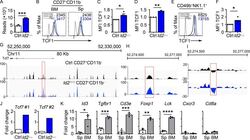
- Figure 2. Dysregulation of Tcf7 /TCF1 in Id2 Delta/Delta NK cells. (A) Tcf7 mRNA in Ctrl and Id2 Delta/Delta NK cells by RNA-seq expressed as normalized reads. Data are from three biological replicates. Error bars represent SD. (B) TCF1 in CD27 + CD11b - NK cells from BM and spleen from Ctrl and Id2 Delta/Delta mice determined by flow cytometry. The MFI of TCF1 is indicated for Ctrl (black) and Id2 Delta/Delta (blue; n = 4 for BM and n = 3 for spleen; data are from independent experiments). (C and D) Summary of relative TCF1 MFI from BM and spleen. MFI of Ctrl NK cells was set as 1 in each experiment. (E) CD49b + -enriched BM NK cells were cultured in IL-15 (20 ng/ml) for 6 d before flow cytometry analysis for TCF1 in NK1.1 + CD49b + cells. The MFI for TCF1 in Ctrl (black) and Id2 Delta/Delta (blue) is shown. (F) Summary of relative TCF1 MFI in IL-15-cultured NK cells. MFI of Ctrl NK cells was set as 1 in each experiment ( n = 4; data are from independent experiments). Error bars represent SEM (C, D, and F). (G) Chromatin accessibility surrounding the Tcf7 gene as determined by ATAC-seq on CD27 + CD11b - NK cells (). Ctrl (black) and ID2-deficient (blue) NK cells. (H) Enhanced view of the indicated region of the Tcf7 intron showing increased chromatin accessibility in ID2-deficient CD27 + CD11b - NK cells. (I) The same region as in H but showing nucleosome depletion. (J) E protein ChIP was performed on chromatin isolated from Ctrl or Id2 Delta/Delta BM NK cells and amplified
- Submitted by
- Invitrogen Antibodies (provider)
- Main image
- Experimental details
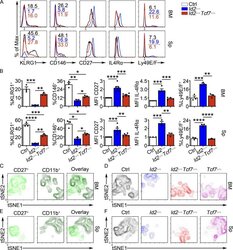
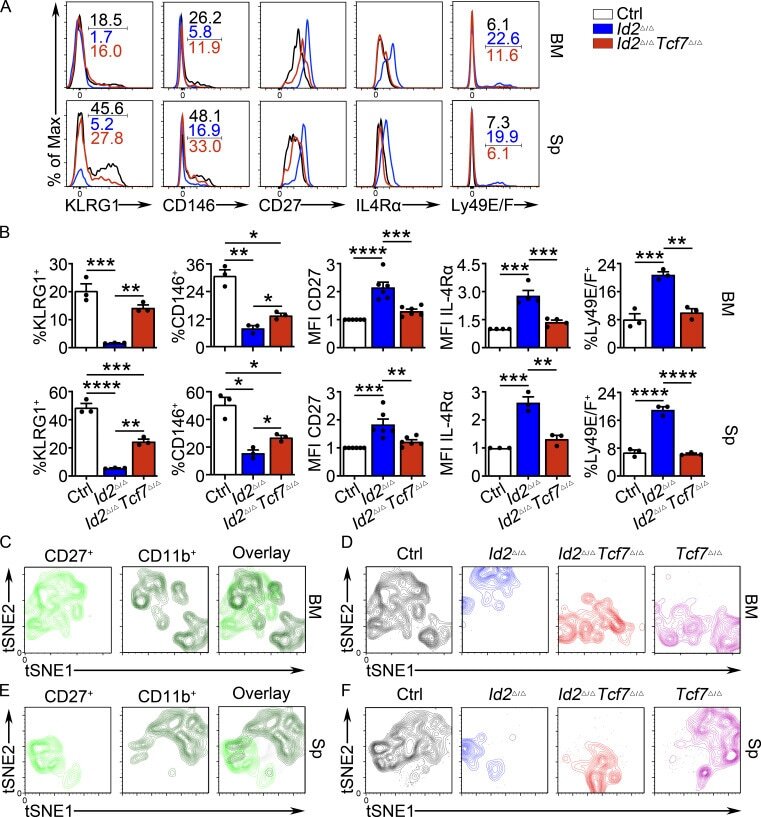
- Figure 6. TCF1 deficiency restores NK cell surface receptor expression in Id2 Delta/Delta NK cells. (A) Flow cytometry plots of different receptors on NK cells of BM (top) and spleen (Sp; bottom) from Id2 Delta/Delta Tcf7 Delta/Delta (red), Id2 Delta/Delta (blue), and Ctrl (black) mice. Numbers are the percentage of cells in the indicated gates. Data represent three to six independent experiments ( n = 3-6 for each group). (B) Summary of data shown in A. MFI of Ctrl NK cells was set as 1 in each experiment for CD27 and IL-4Ralpha. Error bars represent SEM. Statistical significance was determined by one-way ANOVA with Tukey's multiple comparisons test. *, P < 0.05; **, P < 0.01; ***, P < 0.005; ****, P < 0.001. (C and E) BM and spleen tSNE analysis showing expression of CD27 or CD11b on Ctrl NK1.1 + CD49b + NK cells and the overlay of the two markers. Data are representative of two experiments. (D and F) BM and spleen tSNE analysis on NK1.1 + CD49b + NK cells for each of the indicated genotypes. Plots were generated using surface receptors (NK1.1, CD49b, CD27, CD11b, CD49a, KLRG1, CD146, SLAMF6, CD226, IL4Ra, and CXCR3). Data are representative of two experiments.
- Submitted by
- Invitrogen Antibodies (provider)
- Main image
- Experimental details
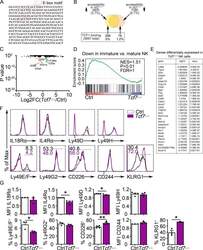
- Figure S2. Altered gene expression in Tcf7 Delta/Delta BM NK cells. (A) Sequence of the intronic region of Tcf7 that shows increased accessibility in ID2-deficient BM CD27 + CD11b - NK cells. (B) Schematic representation of the overlap between regions with altered chromatin accessibility in ID2-deficient CD27 + CD11b - NK cells by ATAC-seq and TCF1 binding sites in CD8 T cells determined by ChIP-seq (Gene Expression Omnibus accession no. GSE73239 ). Regions with increased accessibility by ATAC-seq are shown in yellow, decreased accessibility in peach, and no change in orange. TCF1 binding sites are significantly enriched in ATAC-seq regions that gain accessibility in ID2-deficient cells. P < 1.846 10-66 (Fisher's exact test). (C) Volcano plot showing Log2FC versus adj. P values for RNA-seq data from Tcf7 Delta/Delta and Ctrl NK cells. Data were generated from three biological replicates. (D) GSEA for Ctrl versus Tcf7 Delta/Delta NK cell RNA expression. (E) Table showing differentially expressed genes from RNA-seq data shown in C . (F) Flow cytometry plots of different proteins on NK cells of spleen from Tcf7 Delta/Delta and Ctrl mice ( n = 3-4 for each group from independent experiments). (G) Summary of the data in F. Error bars represent SEM. Statistical significance was determined by two-tailed unpaired t test. *, P < 0.05; **, P < 0.01. FDR, false discovery rate; NES, normalized enrichment score.

- Submitted by
- Invitrogen Antibodies (provider)
- Main image
- Experimental details
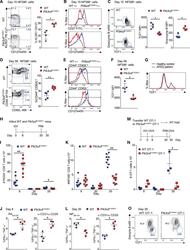
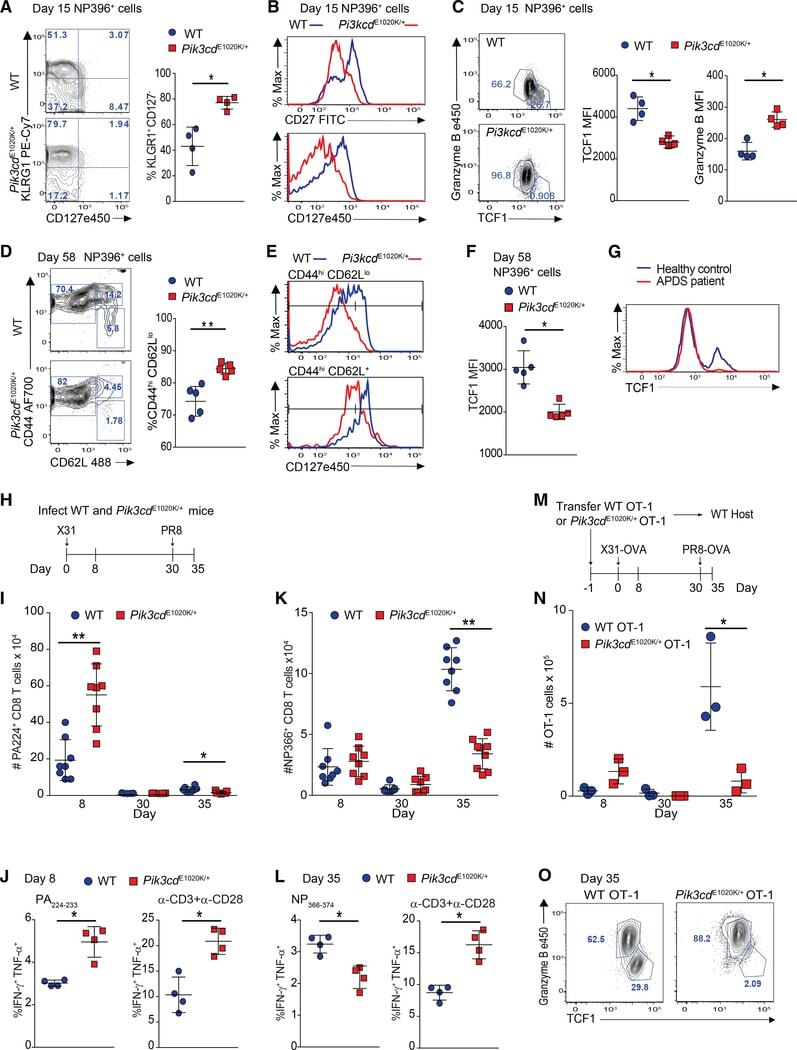
- Figure 3. Pik3cd E1020K/+ mice fail to develop a robust T CM population (A-F) Viable CD8 + splenocytes from mice infected with LCMV Armstrong (n = 2, 4-5/group/time point). (A-C) NP396-specific CD8 + cells day 15 p.i. (A) CD127 and KLRG1 expression (left: representative staining; right: %KLRG1 + CD127 - ). (B) Representative histogram of CD27 (top) and CD127 (bottom). (C) GzmB and TCF1 staining. Middle: TCF1 MFI; right: GzmB MFI. (D-F) NP396-specific CD8 + cells day 58 p.i. (D) CD44 and CD62L staining. Representative flow (left), % CD44 hi CD62L lo cells (right). (E) CD127 histograms: CD44 hi CD62L lo (top) and CD44 hi CD62L + (bottom). (F) TCF1 MFI. (G) TCF1 staining of allo-reactive CD8 + cells from healthy controls and patients with APDS (n = 2, representative histogram). (H-L) Mice were infected with X31 and challenged with PR8 (n = 2, 3-5 mice/genotype/time point). (H) Infection outline. (I) PA224-specific CD8 + cell numbers. (J) IFN-gamma and TNF-alpha from day 8 cells stimulated with either PA 224-233 (left) or anti-CD3 plus anti-CD28 (right). (K) NP366-specific CD8 + T cell numbers. (L) IFN-gamma and TNF-alpha from day 35 cells stimulated with either NP 366-374 (left) or anti-CD3 plus anti-CD28 (right). (M-O) OT-1 cells were transferred into congenic hosts, infected with influenza X31-OVA and challenged with PR8-OVA (n = 2, 3 mice/genotype/time point). (M) Outline. (N) Viable OT-1 cell numbers. (O) TCF1 and GzmB expression in OT-1 cells on day 35. Representative exper
- Submitted by
- Invitrogen Antibodies (provider)
- Main image
- Experimental details
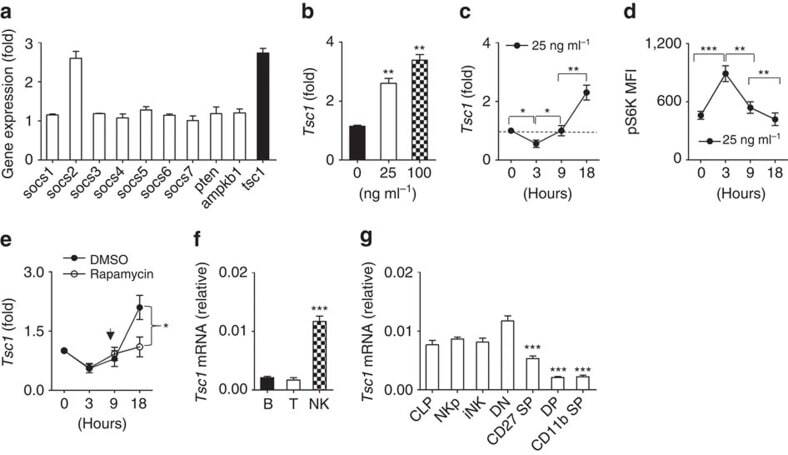
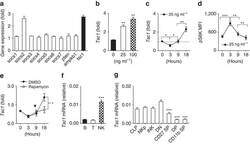
- Figure 1 Dynamic Tsc1 expression following IL-15 stimulation. ( a - c ) Quantitative reverse transcription-PCR (RT-PCR) analysis of the indicated genes in sorted CD3 - NK1.1 + cells from the spleen of WT mice before and after stimulation with 25 ng ml -1 IL-15 for 18 h ( a ), various concentration of IL-15 ( b ), or at the indicated time points ( c ). ( d ) Intracellular phosphorylated S6 in sorted NK cells after stimulation with 25 ng ml -1 IL-15 was detected by flow cytometry at the indicated time points, and the mean fluorescence intensity was calculated. ( e ) Tsc1 messenger RNA (mRNA) expression was analysed by quantitative RT-PCR in sorted CD3 - NK1.1 + cells after stimulation with 25 ng ml -1 IL-15 for 18 h in the presence of DMSO or rapamycin (10 nM). ( f ) Analysis of Tsc1 mRNA expression in sorted T, B and NK cells by quantitative PCR. (g) Analysis of Tsc1 mRNA expression in CLP, NKp and immature NK cells (iNK), and NK cell subsets, including CD27 - CD11b - (DN), CD27 + CD11b - (CD27 SP), CD27 + CD11b + (DP) and CD27 - CD11b + (CD11b SP), by quantitative PCR. The results were normalized to beta- actin ( f , g ) or are presented relative to expression in untreated cells, which was set as 1 ( a - c , e ). Value represent mean+-s.d. * P