Explore
 Validate
 Learn
Learn Flow cytometry
Antibody data
- Antibody Data
- Antigen structure
- References [45]
- Comments [0]
- Validations
- Flow cytometry [1]
- Other assay [15]
Submit
Validation data
Reference
Comment
Report error
- Product number
- 12-0271-83 - Provider product page

- Provider
- Invitrogen Antibodies
- Product name
- CD27 Monoclonal Antibody (LG.7F9), PE, eBioscience™
- Antibody type
- Monoclonal
- Antigen
- Other
- Description
- Description: The LG.7F9 monoclonal antibody reacts with mouse CD27, a lymphocyte-specific member of the TNFR superfamily. CD27 is expressed by virtually all mature T cells and by a subpopulation of B cells, mainly memory B cells. In mouse, CD27 has been found on nearly all thymocytes excluding a population of CD46-CD8- precursors. CD27 binds to CD70 and, through this interaction, plays an important role in T cell-B cell interaction. It has been reported that triggering CD27 plays an important role in the maturation of CD4+ and CD8+ effector cells. LG.7F9 cross-reacts with human and rat CD27. Applications Reported: The LG.7F9 antibody has been reported for use in flow cytometric analysis. Applications Tested: The LG.7F9 antibody has been tested by flow cytometric analysis of mouse splenocytes. This can be used at less than or equal to 0.125 µg per test. A test is defined as the amount (µg) of antibody that will stain a cell sample in a final volume of 100 µL. Cell number should be determined empirically but can range from 10^5 to 10^8 cells/test. It is recommended that the antibody be carefully titrated for optimal performance in the assay of interest. Excitation: 488-561 nm; Emission: 578 nm; Laser: Blue Laser, Green Laser, Yellow-Green Laser. Filtration: 0.2 µm post-manufacturing filtered.
- Reactivity
- Human, Mouse, Rat
- Conjugate
- Yellow dye
- Isotype
- IgG
- Antibody clone number
- LG.7F9
- Vial size
- 200 µg
- Concentration
- 0.2 mg/mL
- Storage
- 4° C, store in dark, DO NOT FREEZE!
Submitted references Perinatal murine cytomegalovirus infection reshapes the transcriptional profile and functionality of NK cells.
The transcription factor Bach2 negatively regulates murine natural killer cell maturation and function.
PI3Kδ coordinates transcriptional, chromatin, and metabolic changes to promote effector CD8(+) T cells at the expense of central memory.
Effect of Subcutaneous Anti-CD20 Antibody-Mediated B Cell Depletion on Susceptibility to Pneumocystis Infection in Mice.
Development of a VRC01-class germline targeting immunogen derived from anti-idiotypic antibodies.
Immune cell phenotypes associated with disease severity and long-term neutralizing antibody titers after natural dengue virus infection.
Ontogenic timing, T cell receptor signal strength, and Notch signaling direct γδ T cell functional differentiation in vivo.
The transcriptional repressor ID2 supports natural killer cell maturation by controlling TCF1 amplitude.
Chronic T cell proliferation in brains after stroke could interfere with the efficacy of immunotherapies.
Th2 Biased Immunity With Altered B Cell Profiles in Circulation of Patients With Sporotrichosis Caused by Sporothrix globosa.
SRC-3 Functions as a Coactivator of T-bet by Regulating the Maturation and Antitumor Activity of Natural Killer Cells.
Heterogenous Populations of Tissue-Resident CD8(+) T Cells Are Generated in Response to Infection and Malignancy.
Diverse CD8 T Cell Responses to Viral Infection Revealed by the Collaborative Cross.
Synergized regulation of NK cell education by NKG2A and specific Ly49 family members.
Persistence of Integrase-Deficient Lentiviral Vectors Correlates with the Induction of STING-Independent CD8(+) T Cell Responses.
The cis-Regulatory Atlas of the Mouse Immune System.
Qa-1-Restricted CD8(+) T Cells Can Compensate for the Absence of Conventional T Cells during Viral Infection.
Crosstalks between mTORC1 and mTORC2 variagate cytokine signaling to control NK maturation and effector function.
BALDR: a computational pipeline for paired heavy and light chain immunoglobulin reconstruction in single-cell RNA-seq data.
Loss of HIF-1α in natural killer cells inhibits tumour growth by stimulating non-productive angiogenesis.
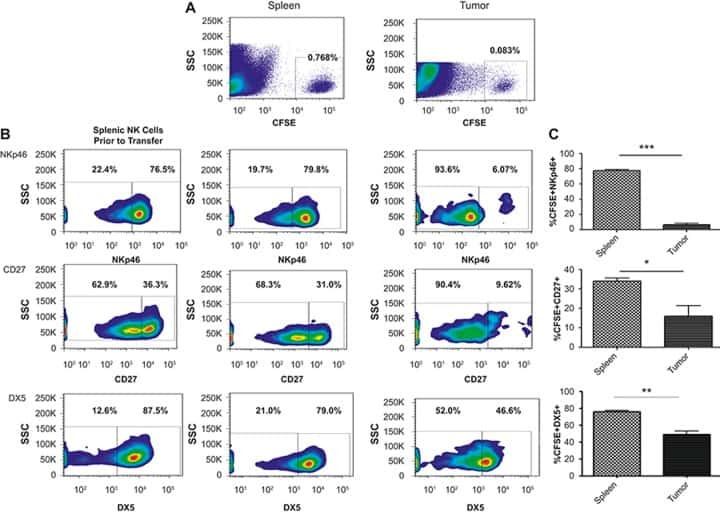
The breast tumor microenvironment alters the phenotype and function of natural killer cells.
NK cell development requires Tsc1-dependent negative regulation of IL-15-triggered mTORC1 activation.
Plasmodium suppresses expansion of T cell responses to heterologous infections.
Sm29, but not Sm22.6 retains its ability to induce a protective immune response in mice previously exposed to a Schistosoma mansoni infection.
Identification and characterization of latency-associated peptide-expressing γδ T cells.
Production of IL-10 by CD4(+) regulatory T cells during the resolution of infection promotes the maturation of memory CD8(+) T cells.
Viral MHC class I-like molecule allows evasion of NK cell effector responses in vivo.
The Menin-Bach2 axis is critical for regulating CD4 T-cell senescence and cytokine homeostasis.
Tumor necrosis factor induces tumor promoting and anti-tumoral effects on pancreatic cancer via TNFR1.
Role of NK cell subsets in organ-specific murine melanoma metastasis.
IL-33 signaling regulates innate and adaptive immunity to Cryptococcus neoformans.
Markers of nonselective and specific NK cell activation.
Nucleoside salvage pathway kinases regulate hematopoiesis by linking nucleotide metabolism with replication stress.
CD4 T cells play important roles in maintaining IL-17-producing γδ T-cell subsets in naive animals.
Plasmodium-host interactions directly influence the threshold of memory CD8 T cells required for protective immunity.
Cutting edge: attrition of Plasmodium-specific memory CD8 T cells results in decreased protection that is rescued by booster immunization.
Heterogeneity among viral antigen-specific CD4+ T cells and their de novo recruitment during persistent polyomavirus infection.
E47 controls the developmental integrity and cell cycle quiescence of multipotential hematopoietic progenitors.
E47 controls the developmental integrity and cell cycle quiescence of multipotential hematopoietic progenitors.
IL-7 and IL-15 differentially regulate CD8+ T-cell subsets during contraction of the immune response.
Late signals from CD27 prevent Fas-dependent apoptosis of primary CD8+ T cells.
Late signals from CD27 prevent Fas-dependent apoptosis of primary CD8+ T cells.
The latency-associated nuclear antigen of Kaposi sarcoma-associated herpesvirus induces B cell hyperplasia and lymphoma.
Delayed, asynchronous, and reversible T-lineage specification induced by Notch/Delta signaling.
Characterization of murine CD70, the ligand of the TNF receptor family member CD27.
Rožmanić C, Lisnić B, Pribanić Matešić M, Mihalić A, Hiršl L, Park E, Lesac Brizić A, Indenbirken D, Viduka I, Šantić M, Adler B, Yokoyama WM, Krmpotić A, Juranić Lisnić V, Jonjić S, Brizić I
Nature communications 2023 Oct 12;14(1):6412
Nature communications 2023 Oct 12;14(1):6412
The transcription factor Bach2 negatively regulates murine natural killer cell maturation and function.
Li S, Bern MD, Miao B, Fan C, Xing X, Inoue T, Piersma SJ, Wang T, Colonna M, Kurosaki T, Yokoyama WM
eLife 2022 Oct 3;11
eLife 2022 Oct 3;11
PI3Kδ coordinates transcriptional, chromatin, and metabolic changes to promote effector CD8(+) T cells at the expense of central memory.
Cannons JL, Villarino AV, Kapnick SM, Preite S, Shih HY, Gomez-Rodriguez J, Kaul Z, Shibata H, Reilley JM, Huang B, Handon R, McBain IT, Gossa S, Wu T, Su HC, McGavern DB, O'Shea JJ, McGuire PJ, Uzel G, Schwartzberg PL
Cell reports 2021 Oct 12;37(2):109804
Cell reports 2021 Oct 12;37(2):109804
Effect of Subcutaneous Anti-CD20 Antibody-Mediated B Cell Depletion on Susceptibility to Pneumocystis Infection in Mice.
Dai G, Noell K, Weckbecker G, Kolls JK
mSphere 2021 May 5;6(3)
mSphere 2021 May 5;6(3)
Development of a VRC01-class germline targeting immunogen derived from anti-idiotypic antibodies.
Seydoux E, Wan YH, Feng J, Wall A, Aljedani S, Homad LJ, MacCamy AJ, Weidle C, Gray MD, Brumage L, Taylor JJ, Pancera M, Stamatatos L, McGuire AT
Cell reports 2021 May 4;35(5):109084
Cell reports 2021 May 4;35(5):109084
Immune cell phenotypes associated with disease severity and long-term neutralizing antibody titers after natural dengue virus infection.
Rouers A, Chng MHY, Lee B, Rajapakse MP, Kaur K, Toh YX, Sathiakumar D, Loy T, Thein TL, Lim VWX, Singhal A, Yeo TW, Leo YS, Vora KA, Casimiro D, Lim B, Tucker-Kellogg L, Rivino L, Newell EW, Fink K
Cell reports. Medicine 2021 May 18;2(5):100278
Cell reports. Medicine 2021 May 18;2(5):100278
Ontogenic timing, T cell receptor signal strength, and Notch signaling direct γδ T cell functional differentiation in vivo.
Chen ELY, Lee CR, Thompson PK, Wiest DL, Anderson MK, Zúñiga-Pflücker JC
Cell reports 2021 Jun 8;35(10):109227
Cell reports 2021 Jun 8;35(10):109227
The transcriptional repressor ID2 supports natural killer cell maturation by controlling TCF1 amplitude.
Li ZY, Morman RE, Hegermiller E, Sun M, Bartom ET, Maienschein-Cline M, Sigvardsson M, Kee BL
The Journal of experimental medicine 2021 Jun 7;218(6)
The Journal of experimental medicine 2021 Jun 7;218(6)
Chronic T cell proliferation in brains after stroke could interfere with the efficacy of immunotherapies.
Heindl S, Ricci A, Carofiglio O, Zhou Q, Arzberger T, Lenart N, Franzmeier N, Hortobagyi T, Nelson PT, Stowe AM, Denes A, Edbauer D, Liesz A
The Journal of experimental medicine 2021 Aug 2;218(8)
The Journal of experimental medicine 2021 Aug 2;218(8)
Th2 Biased Immunity With Altered B Cell Profiles in Circulation of Patients With Sporotrichosis Caused by Sporothrix globosa.
Zu J, Yao L, Song Y, Cui Y, Guan M, Chen R, Zhen Y, Li S
Frontiers in immunology 2020;11:570888
Frontiers in immunology 2020;11:570888
SRC-3 Functions as a Coactivator of T-bet by Regulating the Maturation and Antitumor Activity of Natural Killer Cells.
Hu M, Lu Y, Qi Y, Zhang Z, Wang S, Xu Y, Chen F, Tang Y, Chen S, Chen M, Du C, Shen M, Wang F, Su Y, Deng Y, Wang J
Cancer immunology research 2020 Sep;8(9):1150-1162
Cancer immunology research 2020 Sep;8(9):1150-1162
Heterogenous Populations of Tissue-Resident CD8(+) T Cells Are Generated in Response to Infection and Malignancy.
Milner JJ, Toma C, He Z, Kurd NS, Nguyen QP, McDonald B, Quezada L, Widjaja CE, Witherden DA, Crowl JT, Shaw LA, Yeo GW, Chang JT, Omilusik KD, Goldrath AW
Immunity 2020 May 19;52(5):808-824.e7
Immunity 2020 May 19;52(5):808-824.e7
Diverse CD8 T Cell Responses to Viral Infection Revealed by the Collaborative Cross.
Martin MD, Sompallae R, Winborn CS, Harty JT, Badovinac VP
Cell reports 2020 Apr 14;31(2):107508
Cell reports 2020 Apr 14;31(2):107508
Synergized regulation of NK cell education by NKG2A and specific Ly49 family members.
Zhang X, Feng J, Chen S, Yang H, Dong Z
Nature communications 2019 Nov 1;10(1):5010
Nature communications 2019 Nov 1;10(1):5010
Persistence of Integrase-Deficient Lentiviral Vectors Correlates with the Induction of STING-Independent CD8(+) T Cell Responses.
Cousin C, Oberkampf M, Felix T, Rosenbaum P, Weil R, Fabrega S, Morante V, Negri D, Cara A, Dadaglio G, Leclerc C
Cell reports 2019 Jan 29;26(5):1242-1257.e7
Cell reports 2019 Jan 29;26(5):1242-1257.e7
The cis-Regulatory Atlas of the Mouse Immune System.
Yoshida H, Lareau CA, Ramirez RN, Rose SA, Maier B, Wroblewska A, Desland F, Chudnovskiy A, Mortha A, Dominguez C, Tellier J, Kim E, Dwyer D, Shinton S, Nabekura T, Qi Y, Yu B, Robinette M, Kim KW, Wagers A, Rhoads A, Nutt SL, Brown BD, Mostafavi S, Buenrostro JD, Benoist C, Immunological Genome Project
Cell 2019 Feb 7;176(4):897-912.e20
Cell 2019 Feb 7;176(4):897-912.e20
Qa-1-Restricted CD8(+) T Cells Can Compensate for the Absence of Conventional T Cells during Viral Infection.
Anderson CK, Reilly EC, Lee AY, Brossay L
Cell reports 2019 Apr 9;27(2):537-548.e5
Cell reports 2019 Apr 9;27(2):537-548.e5
Crosstalks between mTORC1 and mTORC2 variagate cytokine signaling to control NK maturation and effector function.
Wang F, Meng M, Mo B, Yang Y, Ji Y, Huang P, Lai W, Pan X, You T, Luo H, Guan X, Deng Y, Yuan S, Chu J, Namaka M, Hughes T, Ye L, Yu J, Li X, Deng Y
Nature communications 2018 Nov 19;9(1):4874
Nature communications 2018 Nov 19;9(1):4874
BALDR: a computational pipeline for paired heavy and light chain immunoglobulin reconstruction in single-cell RNA-seq data.
Upadhyay AA, Kauffman RC, Wolabaugh AN, Cho A, Patel NB, Reiss SM, Havenar-Daughton C, Dawoud RA, Tharp GK, Sanz I, Pulendran B, Crotty S, Lee FE, Wrammert J, Bosinger SE
Genome medicine 2018 Mar 20;10(1):20
Genome medicine 2018 Mar 20;10(1):20
Loss of HIF-1α in natural killer cells inhibits tumour growth by stimulating non-productive angiogenesis.
Krzywinska E, Kantari-Mimoun C, Kerdiles Y, Sobecki M, Isagawa T, Gotthardt D, Castells M, Haubold J, Millien C, Viel T, Tavitian B, Takeda N, Fandrey J, Vivier E, Sexl V, Stockmann C
Nature communications 2017 Nov 17;8(1):1597
Nature communications 2017 Nov 17;8(1):1597
The breast tumor microenvironment alters the phenotype and function of natural killer cells.
Krneta T, Gillgrass A, Chew M, Ashkar AA
Cellular & molecular immunology 2016 Sep;13(5):628-39
Cellular & molecular immunology 2016 Sep;13(5):628-39
NK cell development requires Tsc1-dependent negative regulation of IL-15-triggered mTORC1 activation.
Yang M, Chen S, Du J, He J, Wang Y, Li Z, Liu G, Peng W, Zeng X, Li D, Xu P, Guo W, Chang Z, Wang S, Tian Z, Dong Z
Nature communications 2016 Sep 7;7:12730
Nature communications 2016 Sep 7;7:12730
Plasmodium suppresses expansion of T cell responses to heterologous infections.
White CE, Villarino NF, Sloan SS, Ganusov VV, Schmidt NW
Journal of immunology (Baltimore, Md. : 1950) 2015 Jan 15;194(2):697-708
Journal of immunology (Baltimore, Md. : 1950) 2015 Jan 15;194(2):697-708
Sm29, but not Sm22.6 retains its ability to induce a protective immune response in mice previously exposed to a Schistosoma mansoni infection.
Alves CC, Araujo N, dos Santos VC, Couto FB, Assis NR, Morais SB, Oliveira SC, Fonseca CT
PLoS neglected tropical diseases 2015 Feb;9(2):e0003537
PLoS neglected tropical diseases 2015 Feb;9(2):e0003537
Identification and characterization of latency-associated peptide-expressing γδ T cells.
Rezende RM, da Cunha AP, Kuhn C, Rubino S, M'Hamdi H, Gabriely G, Vandeventer T, Liu S, Cialic R, Pinheiro-Rosa N, Oliveira RP, Gaublomme JT, Obholzer N, Kozubek J, Pochet N, Faria AMC, Weiner HL
Nature communications 2015 Dec 8;6:8726
Nature communications 2015 Dec 8;6:8726
Production of IL-10 by CD4(+) regulatory T cells during the resolution of infection promotes the maturation of memory CD8(+) T cells.
Laidlaw BJ, Cui W, Amezquita RA, Gray SM, Guan T, Lu Y, Kobayashi Y, Flavell RA, Kleinstein SH, Craft J, Kaech SM
Nature immunology 2015 Aug;16(8):871-9
Nature immunology 2015 Aug;16(8):871-9
Viral MHC class I-like molecule allows evasion of NK cell effector responses in vivo.
Pyzik M, Dumaine A, Charbonneau B, Fodil-Cornu N, Jonjic S, Vidal SM
Journal of immunology (Baltimore, Md. : 1950) 2014 Dec 15;193(12):6061-9
Journal of immunology (Baltimore, Md. : 1950) 2014 Dec 15;193(12):6061-9
The Menin-Bach2 axis is critical for regulating CD4 T-cell senescence and cytokine homeostasis.
Kuwahara M, Suzuki J, Tofukuji S, Yamada T, Kanoh M, Matsumoto A, Maruyama S, Kometani K, Kurosaki T, Ohara O, Nakayama T, Yamashita M
Nature communications 2014 Apr 2;5:3555
Nature communications 2014 Apr 2;5:3555
Tumor necrosis factor induces tumor promoting and anti-tumoral effects on pancreatic cancer via TNFR1.
Chopra M, Lang I, Salzmann S, Pachel C, Kraus S, Bäuerlein CA, Brede C, Garrote AL, Mattenheimer K, Ritz M, Schwinn S, Graf C, Schäfer V, Frantz S, Einsele H, Wajant H, Beilhack A
PloS one 2013;8(9):e75737
PloS one 2013;8(9):e75737
Role of NK cell subsets in organ-specific murine melanoma metastasis.
Ballas ZK, Buchta CM, Rosean TR, Heusel JW, Shey MR
PloS one 2013;8(6):e65599
PloS one 2013;8(6):e65599
IL-33 signaling regulates innate and adaptive immunity to Cryptococcus neoformans.
Flaczyk A, Duerr CU, Shourian M, Lafferty EI, Fritz JH, Qureshi ST
Journal of immunology (Baltimore, Md. : 1950) 2013 Sep 1;191(5):2503-13
Journal of immunology (Baltimore, Md. : 1950) 2013 Sep 1;191(5):2503-13
Markers of nonselective and specific NK cell activation.
Fogel LA, Sun MM, Geurs TL, Carayannopoulos LN, French AR
Journal of immunology (Baltimore, Md. : 1950) 2013 Jun 15;190(12):6269-76
Journal of immunology (Baltimore, Md. : 1950) 2013 Jun 15;190(12):6269-76
Nucleoside salvage pathway kinases regulate hematopoiesis by linking nucleotide metabolism with replication stress.
Austin WR, Armijo AL, Campbell DO, Singh AS, Hsieh T, Nathanson D, Herschman HR, Phelps ME, Witte ON, Czernin J, Radu CG
The Journal of experimental medicine 2012 Nov 19;209(12):2215-28
The Journal of experimental medicine 2012 Nov 19;209(12):2215-28
CD4 T cells play important roles in maintaining IL-17-producing γδ T-cell subsets in naive animals.
Do JS, Visperas A, O'Brien RL, Min B
Immunology and cell biology 2012 Apr;90(4):396-403
Immunology and cell biology 2012 Apr;90(4):396-403
Plasmodium-host interactions directly influence the threshold of memory CD8 T cells required for protective immunity.
Schmidt NW, Butler NS, Harty JT
Journal of immunology (Baltimore, Md. : 1950) 2011 May 15;186(10):5873-84
Journal of immunology (Baltimore, Md. : 1950) 2011 May 15;186(10):5873-84
Cutting edge: attrition of Plasmodium-specific memory CD8 T cells results in decreased protection that is rescued by booster immunization.
Schmidt NW, Harty JT
Journal of immunology (Baltimore, Md. : 1950) 2011 Apr 1;186(7):3836-40
Journal of immunology (Baltimore, Md. : 1950) 2011 Apr 1;186(7):3836-40
Heterogeneity among viral antigen-specific CD4+ T cells and their de novo recruitment during persistent polyomavirus infection.
Lin E, Kemball CC, Hadley A, Wilson JJ, Hofstetter AR, Pack CD, Lukacher AE
Journal of immunology (Baltimore, Md. : 1950) 2010 Aug 1;185(3):1692-700
Journal of immunology (Baltimore, Md. : 1950) 2010 Aug 1;185(3):1692-700
E47 controls the developmental integrity and cell cycle quiescence of multipotential hematopoietic progenitors.
Yang Q, Kardava L, St Leger A, Martincic K, Varnum-Finney B, Bernstein ID, Milcarek C, Borghesi L
Journal of immunology (Baltimore, Md. : 1950) 2008 Nov 1;181(9):5885-94
Journal of immunology (Baltimore, Md. : 1950) 2008 Nov 1;181(9):5885-94
IL-7 and IL-15 differentially regulate CD8+ T-cell subsets during contraction of the immune response.
Rubinstein MP, Lind NA, Purton JF, Filippou P, Best JA, McGhee PA, Surh CD, Goldrath AW
Blood 2008 Nov 1;112(9):3704-12
Blood 2008 Nov 1;112(9):3704-12
Late signals from CD27 prevent Fas-dependent apoptosis of primary CD8+ T cells.
Dolfi DV, Boesteanu AC, Petrovas C, Xia D, Butz EA, Katsikis PD
Journal of immunology (Baltimore, Md. : 1950) 2008 Mar 1;180(5):2912-21
Journal of immunology (Baltimore, Md. : 1950) 2008 Mar 1;180(5):2912-21
Late signals from CD27 prevent Fas-dependent apoptosis of primary CD8+ T cells.
Dolfi DV, Boesteanu AC, Petrovas C, Xia D, Butz EA, Katsikis PD
Journal of immunology (Baltimore, Md. : 1950) 2008 Mar 1;180(5):2912-21
Journal of immunology (Baltimore, Md. : 1950) 2008 Mar 1;180(5):2912-21
The latency-associated nuclear antigen of Kaposi sarcoma-associated herpesvirus induces B cell hyperplasia and lymphoma.
Fakhari FD, Jeong JH, Kanan Y, Dittmer DP
The Journal of clinical investigation 2006 Mar;116(3):735-42
The Journal of clinical investigation 2006 Mar;116(3):735-42
Delayed, asynchronous, and reversible T-lineage specification induced by Notch/Delta signaling.
Taghon TN, David ES, Zúñiga-Pflücker JC, Rothenberg EV
Genes & development 2005 Apr 15;19(8):965-78
Genes & development 2005 Apr 15;19(8):965-78
Characterization of murine CD70, the ligand of the TNF receptor family member CD27.
Tesselaar K, Gravestein LA, van Schijndel GM, Borst J, van Lier RA
Journal of immunology (Baltimore, Md. : 1950) 1997 Nov 15;159(10):4959-65
Journal of immunology (Baltimore, Md. : 1950) 1997 Nov 15;159(10):4959-65
No comments: Submit comment
Supportive validation
- Submitted by
- Invitrogen Antibodies (provider)
- Main image
- Experimental details
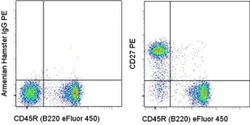
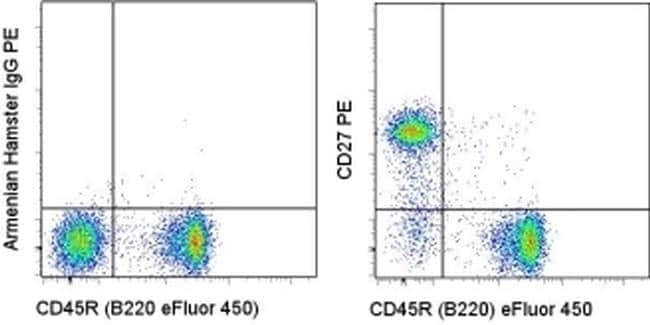
- Staining of C57Bl/6 splenocytes with Anti-Human/Mouse CD45R (B220) eFluor® 450 (Product # 48-0452-82) and 0.06 µg of Armenian Hamster IgG Isotype Control PE (Product # 12-4888-81) (left) or 0.06 µg of Anti-CD27 PE (right). Total viable cells were used for analysis.
- Conjugate
- Yellow dye
Supportive validation
- Submitted by
- Invitrogen Antibodies (provider)
- Main image
- Experimental details
- NULL
- Conjugate
- Yellow dye
- Submitted by
- Invitrogen Antibodies (provider)
- Main image

- Experimental details
- NULL
- Conjugate
- Yellow dye
- Submitted by
- Invitrogen Antibodies (provider)
- Main image
- Experimental details
- NULL
- Conjugate
- Yellow dye
- Submitted by
- Invitrogen Antibodies (provider)
- Main image

- Experimental details
- NULL
- Conjugate
- Yellow dye
- Submitted by
- Invitrogen Antibodies (provider)
- Main image
- Experimental details
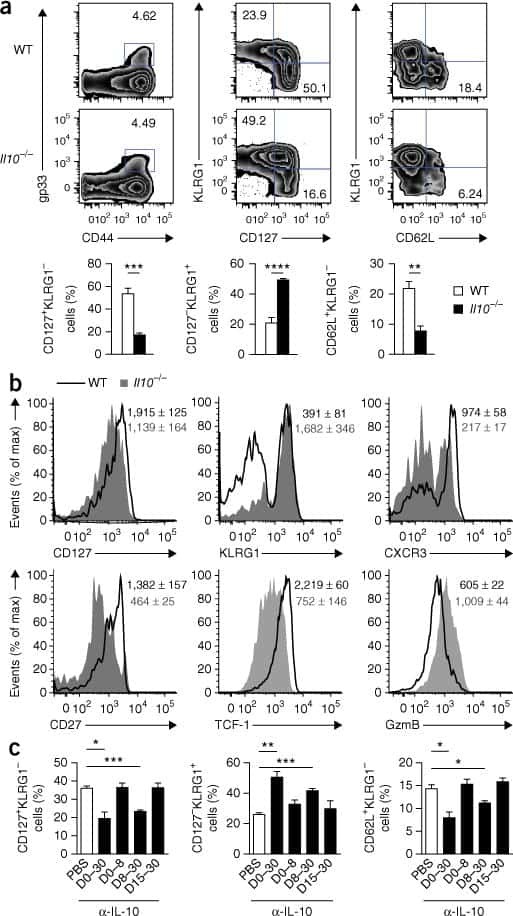
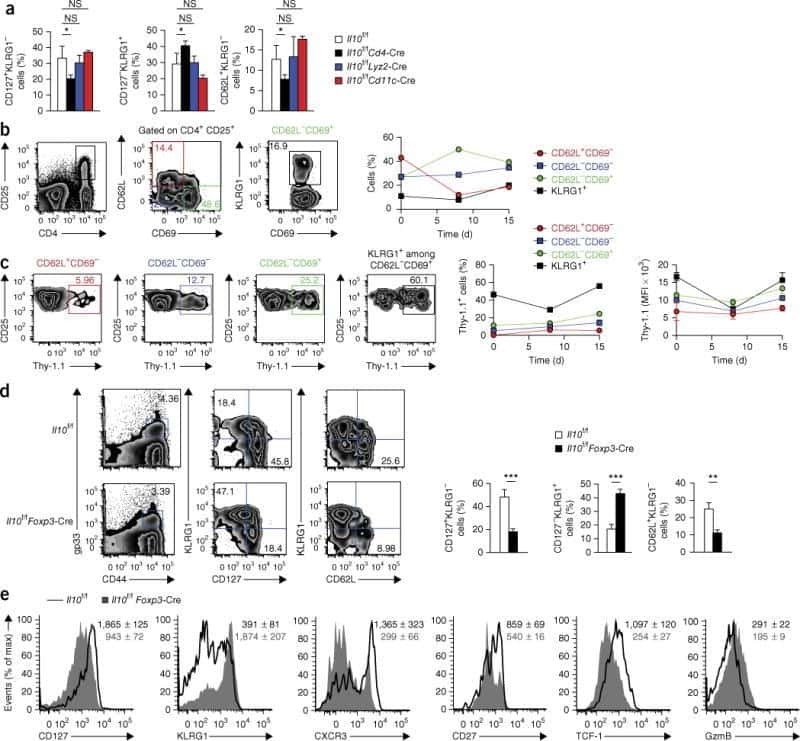
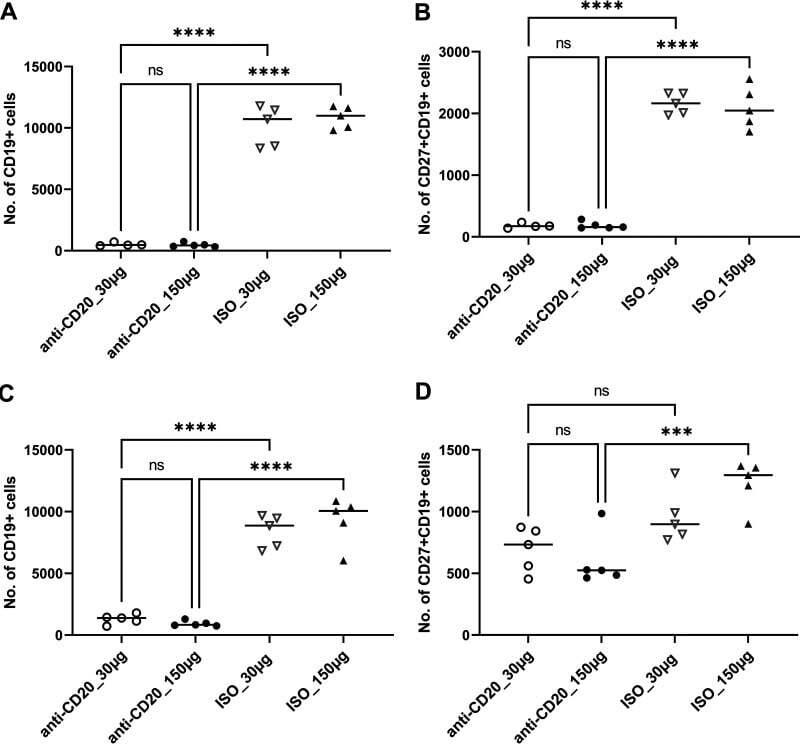
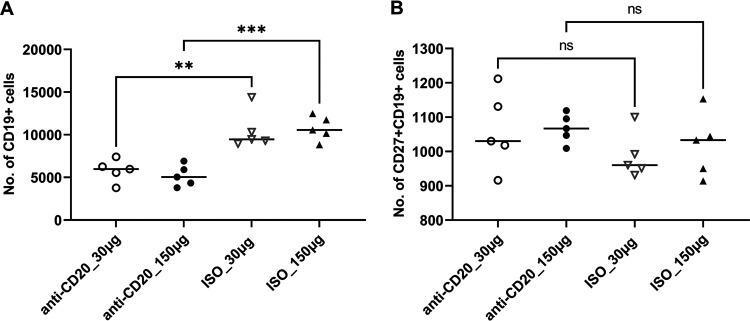
- FIG 1 Lung CD19 + and CD27 + CD19 + cells at day 14 (A and B) and day 28 (C and D) postinfection. C57BL/6 mice were subcutaneously given 30 or 150 mug of anti-CD20 or isotype control antibody weekly. Three days after the first injection, all mice were inoculated with approximately 2 x 10 5 asci of P. murina inoculum. Fourteen or 28 days postinfection, the right upper and lower lung lobes were harvested, and single cells were prepared and stimulated with Pneumocystis (PC) antigen for 6 h followed by staining for cell surface markers and intracellular cytokine staining. For CD19 + and CD27 + CD19 + cells, 100,000 cells were acquired. One-way ANOVA and Tukey's multiple-comparison tests indicated that there were significant differences between anti-CD20 and isotype control antibody (ISO)-treated groups. Statistical significance is indicated as follows: ***, P
- Conjugate
- Yellow dye
- Submitted by
- Invitrogen Antibodies (provider)
- Main image
- Experimental details
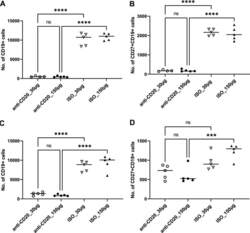
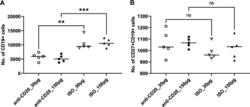
- FIG 6 Lung CD19 + and CD27 + CD19 + cells in secondary PC infection. All mice were inoculated with approximately 2 x 10 5 asci of P. murina inoculum. Six weeks later, the mice were subcutaneously given 30 or 150 mug of anti-CD20 or isotype control antibody weekly. Three days after the first injection, all mice were reinoculated with approximately 2 x 10 5 asci of P. murina inoculum. Fourteen days postinfection, the right upper and lower lung lobes were taken, and single cells were prepared and stimulated with PC antigen for 6 h for surface markers and intracellular cytokine staining. For both CD19 + and CD27 + CD19 + cells, 100,000 cells were acquired. One-way ANOVA and Tukey''s multiple-comparison tests indicated that there were significant differences between anti-CD20- and ISO-treated groups for CD19 + cells but not for CD27 + CD19 + cells. Statistical significance is indicated as follows: **, P
- Conjugate
- Yellow dye
- Submitted by
- Invitrogen Antibodies (provider)
- Main image
- Experimental details
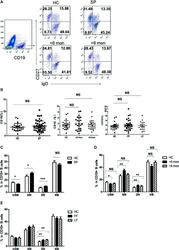
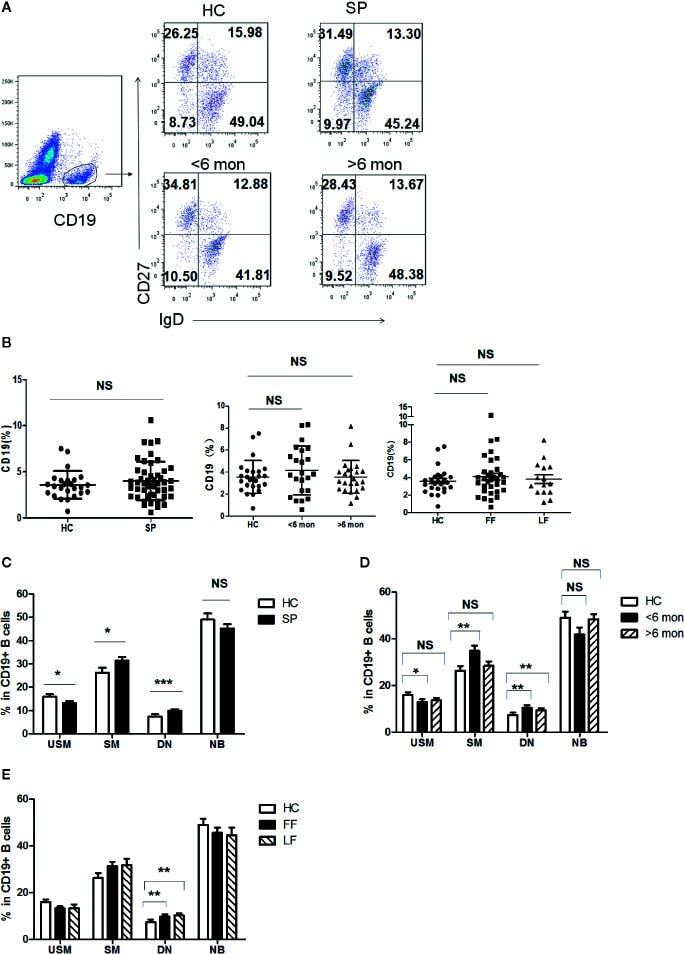
- Figure 3 Phenotypic characterization of circulating B cell subsets in patients and HC. (A) Gated by CD19 + B cells, IgD + CD27 - NB, IgD + CD27 + USM B cells, IgD - CD27 + SM B cells, and IgD - CD27 - DN B cells were identified. The graphs are representative for HC and patients with different duration. Mean value of each B cell subset's percentage is shown in the quadrants. (B) Statistical graphs for comparison of CD19 + B cells' percentages between patient groups and HC. (C-E) Statistical graphs for distinct CD19 + B cells subsets between patients (SP, n = 48; SD, n = 23; LD, n = 25; FF, n = 33; LF, n = 15.) and HC (n = 25). Error bars represent mean+-SD. * P < 0.05, ** P < 0.01, *** P < 0.001, and NS P >= 0.05.
- Conjugate
- Yellow dye
- Submitted by
- Invitrogen Antibodies (provider)
- Main image
- Experimental details
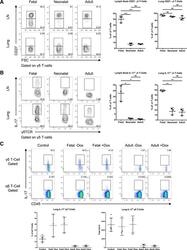
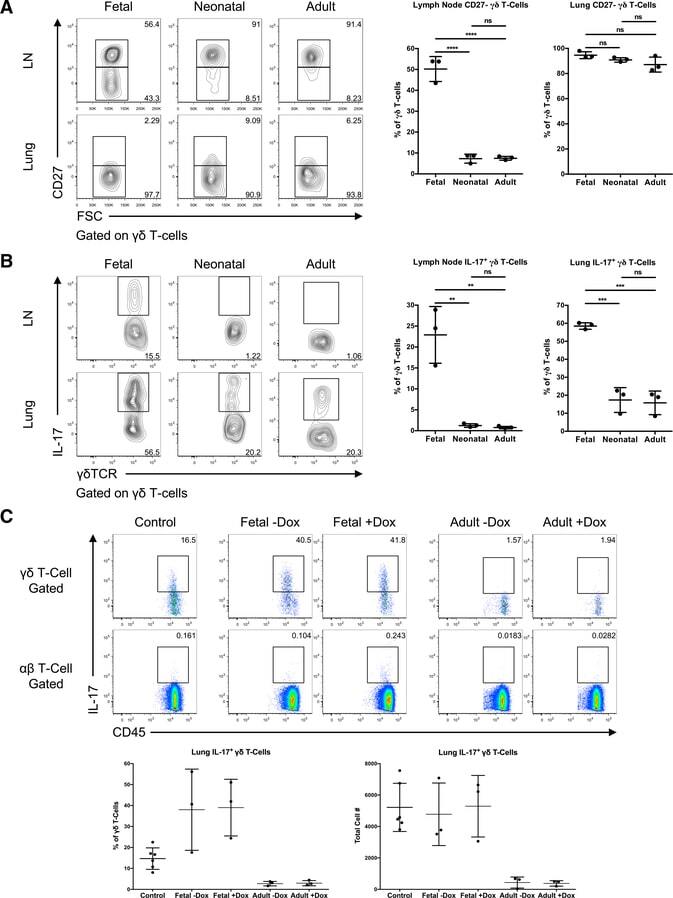
- Figure 3. Ontogenic timing influences gammadeltaT17 generation (A) Flow cytometry analysis of CD27 expression by gammadelta T cells in lymph nodes and lung of fetal-, neonatal-, or adult-induced RBPJ ind mice (left); right panels show percentages. (B) Flow cytometry analysis of IL-17 production by gammadelta T cells in lymph nodes and lung of mice as in (A) stimulated with PMA and ionomycin in vitro (left); right panels show percentages. Data are representative of three independent experiments. Data are presented as means +- standard deviation of three independent experiments. n = 3 mice per group. **p < 0.01, ***p < 0.001, ****p < 0.0001 (one-way ANOVA). (C) Flow cytometry analysis of IL-17 production by gammadelta T cells in lung of control, fetal-, or adult-induced RBPJ ind mice after TDM challenge (top); bottom panels show percentages and numbers. Data are representative of three independent experiments. Data are presented as means +- standard deviation of three independent experiments. n = 6 mice for control; n = 3 mice per fetal- and adult-induced groups. Statistical analyses between groups are found in Figure S2D .
- Conjugate
- Yellow dye
- Submitted by
- Invitrogen Antibodies (provider)
- Main image

- Experimental details
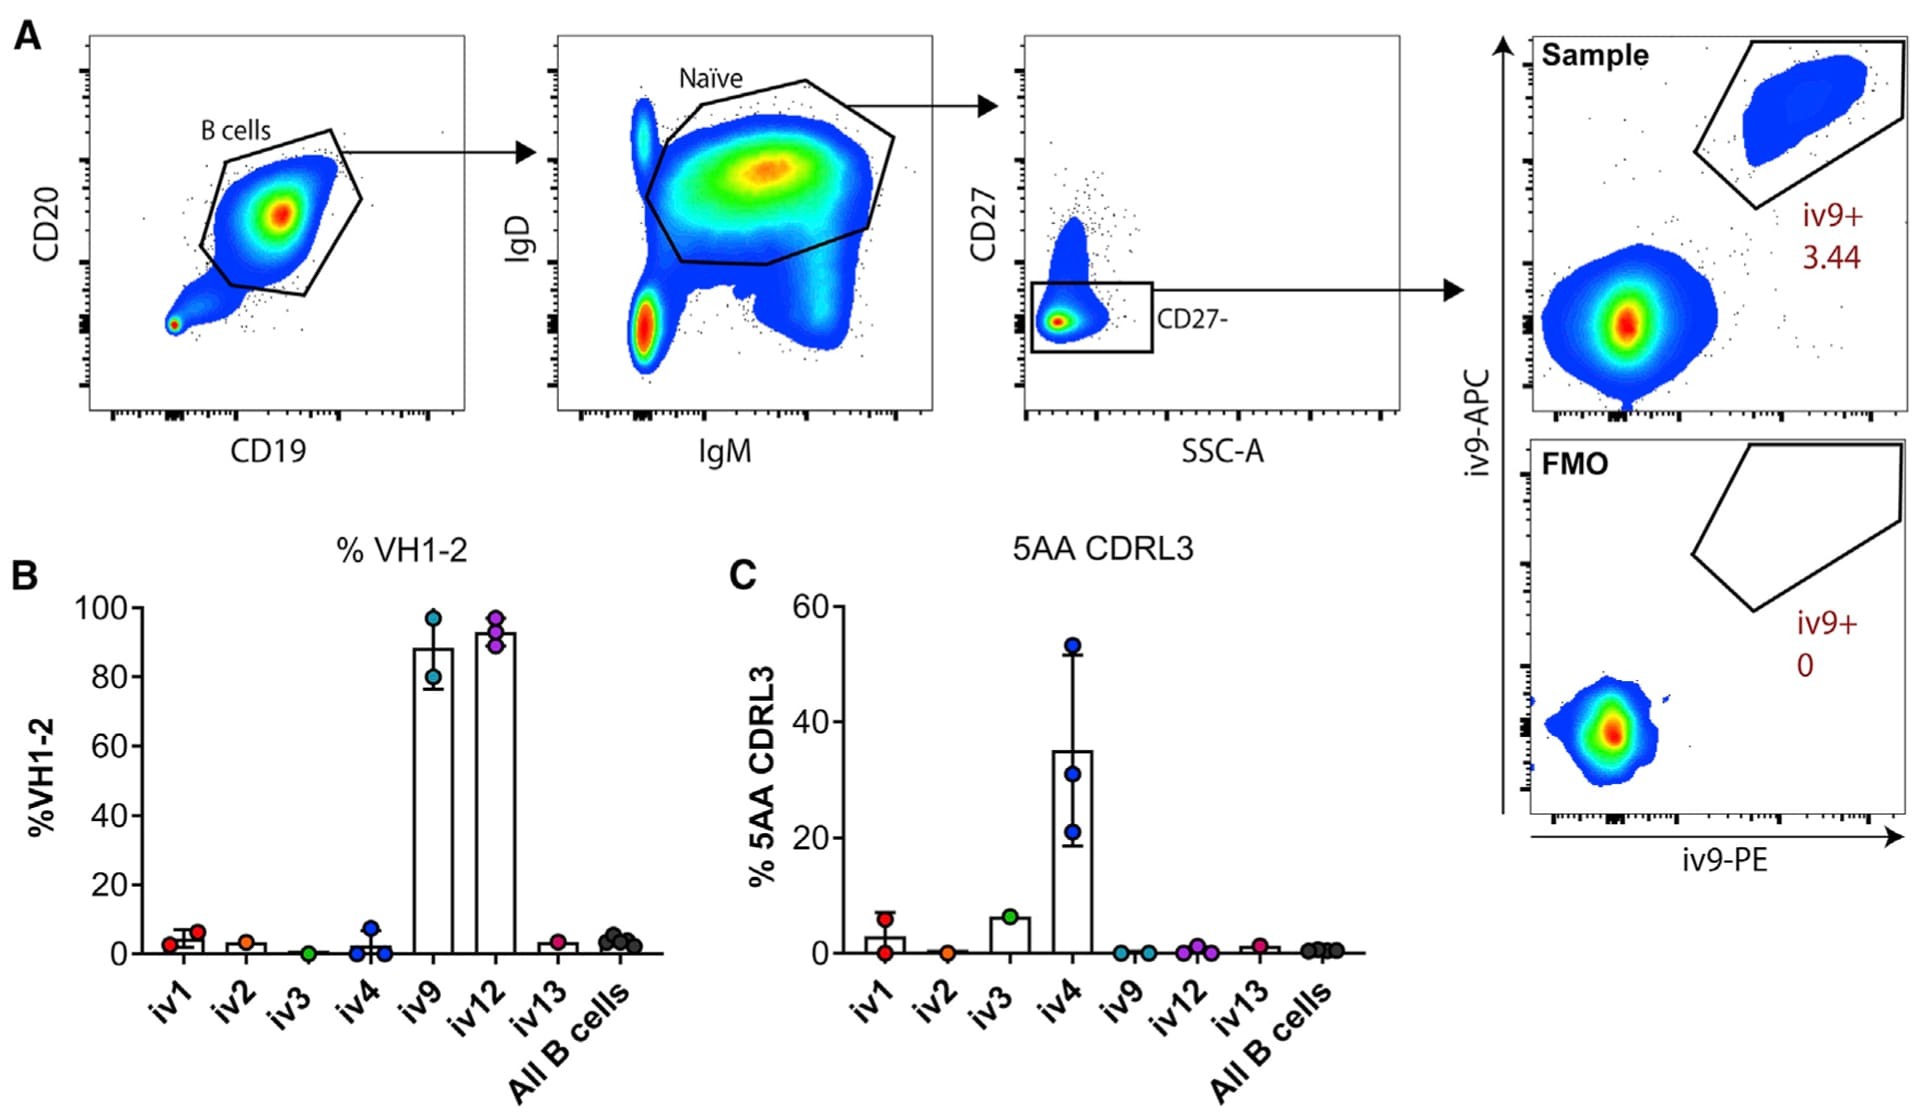
- Figure 2. ai-mAb-specific B cell sorting and sequencing (A) ai-mAbs fluorescently labeled with either phycoerythrin (PE) or allophycocyanin (APC) were used as bait to single-sort CD19 + CD20 + IgD + IgM + CD27 - B cells from PBMCs obtained from healthy, HIV-1-negative donors. VH and VL transcripts were recovered using RT-PCR, and amplicons were Sanger sequenced. (B and C) Frequencies of B cells expressing VH1-2 HC (B) and 5-aa CDRL3 (C) were compared between the different ai-mAbs. Frequencies in total unselected B cells were assessed as control. Data in (B) and (C) are presented as mean +- SD. All frequency data are given in Table S2 .
- Conjugate
- Yellow dye
- Submitted by
- Invitrogen Antibodies (provider)
- Main image
- Experimental details
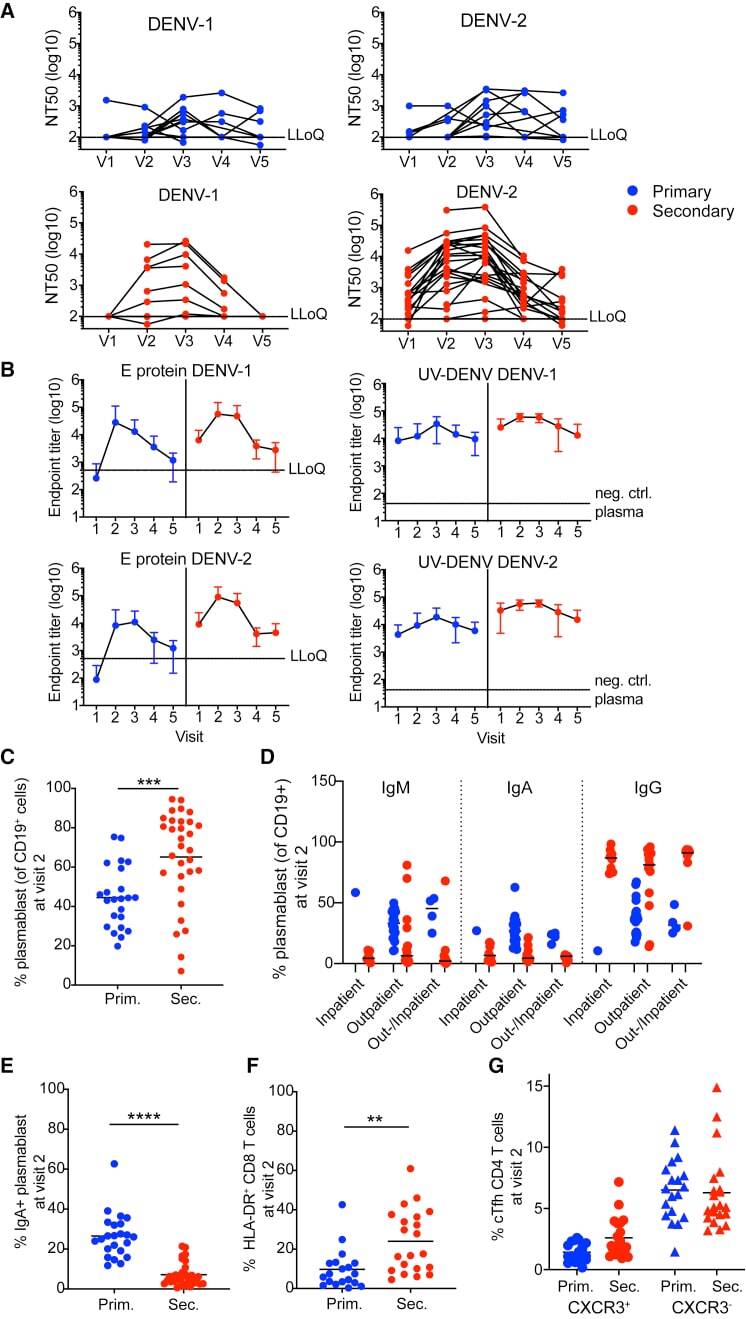
- Figure 6 Primary and secondary status of infection is linked to B cell/antibody readouts (A) NT 50 values of plasma collected at V1-V5 against DENV-1 (left column) or DENV-2 (right column) and for primary patients (top row, blue) or secondary patients (bottom row, red). Each set of connected dots represents 1 patient. (B) Binding of plasma antibodies from V1-V5. ELISA plates were coated with E protein (mostly monomeric, top row) or with UV-inactivated polyethylene glycol (PEG)-precipitated DENV (UV-DENV) (bottom row). E protein ELISA: line indicates the lowest dilution tested (1:500). Endpoint titers for the negative control plasma were 500. UV-DENV ELISA: line indicates the endpoint titer of the negative control plasma (2,500). Lowest dilution tested was 1:100. Primary: blue, secondary: red. Means +- SD are indicated. (C) Frequency of plasmablasts (CD27 + CD38 + ) among CD19 + B cells at V2 for primary and secondary patients. ***p = 0.0007, unpaired t test. Bars indicate the mean. (D) Frequencies of IgA + , IgM + , and IgG + (IgA - IgM - ) plasmablasts during acute disease, stratified according to hospitalization status. Bars indicate the median. (E) IgA expressed at the surface by the plasmablasts in (C); ****p < 0.0001, unpaired t test. Bars indicate the mean (F) Frequency of HLA-DR + cells among CD8 T cells at V2 in primary and secondary patients. **p = 0.002, unpaired t test. Bars indicate the mean. (G) Frequency of CXCR3 + Tfh (circle) or CXCR3 - Tfh (triangle) among CD
- Conjugate
- Yellow dye
- Submitted by
- Invitrogen Antibodies (provider)
- Main image
- Experimental details
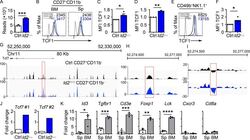
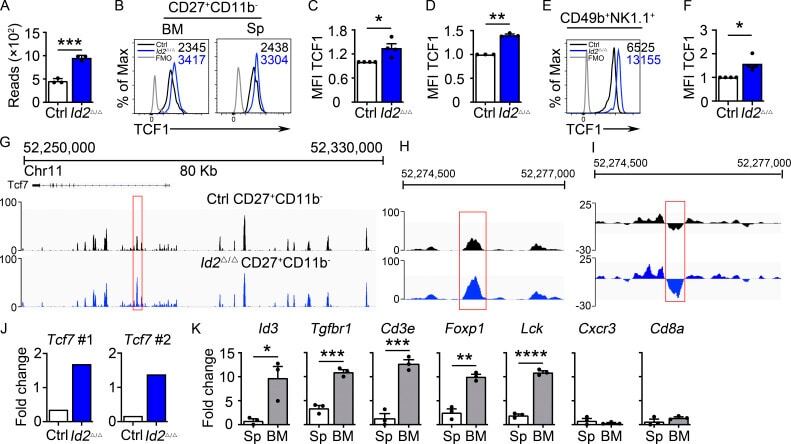
- Figure 2. Dysregulation of Tcf7 /TCF1 in Id2 Delta/Delta NK cells. (A) Tcf7 mRNA in Ctrl and Id2 Delta/Delta NK cells by RNA-seq expressed as normalized reads. Data are from three biological replicates. Error bars represent SD. (B) TCF1 in CD27 + CD11b - NK cells from BM and spleen from Ctrl and Id2 Delta/Delta mice determined by flow cytometry. The MFI of TCF1 is indicated for Ctrl (black) and Id2 Delta/Delta (blue; n = 4 for BM and n = 3 for spleen; data are from independent experiments). (C and D) Summary of relative TCF1 MFI from BM and spleen. MFI of Ctrl NK cells was set as 1 in each experiment. (E) CD49b + -enriched BM NK cells were cultured in IL-15 (20 ng/ml) for 6 d before flow cytometry analysis for TCF1 in NK1.1 + CD49b + cells. The MFI for TCF1 in Ctrl (black) and Id2 Delta/Delta (blue) is shown. (F) Summary of relative TCF1 MFI in IL-15-cultured NK cells. MFI of Ctrl NK cells was set as 1 in each experiment ( n = 4; data are from independent experiments). Error bars represent SEM (C, D, and F). (G) Chromatin accessibility surrounding the Tcf7 gene as determined by ATAC-seq on CD27 + CD11b - NK cells (). Ctrl (black) and ID2-deficient (blue) NK cells. (H) Enhanced view of the indicated region of the Tcf7 intron showing increased chromatin accessibility in ID2-deficient CD27 + CD11b - NK cells. (I) The same region as in H but showing nucleosome depletion. (J) E protein ChIP was performed on chromatin isolated from Ctrl or Id2 Delta/Delta BM NK cells and amplified
- Conjugate
- Yellow dye
- Submitted by
- Invitrogen Antibodies (provider)
- Main image
- Experimental details
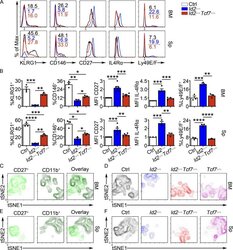
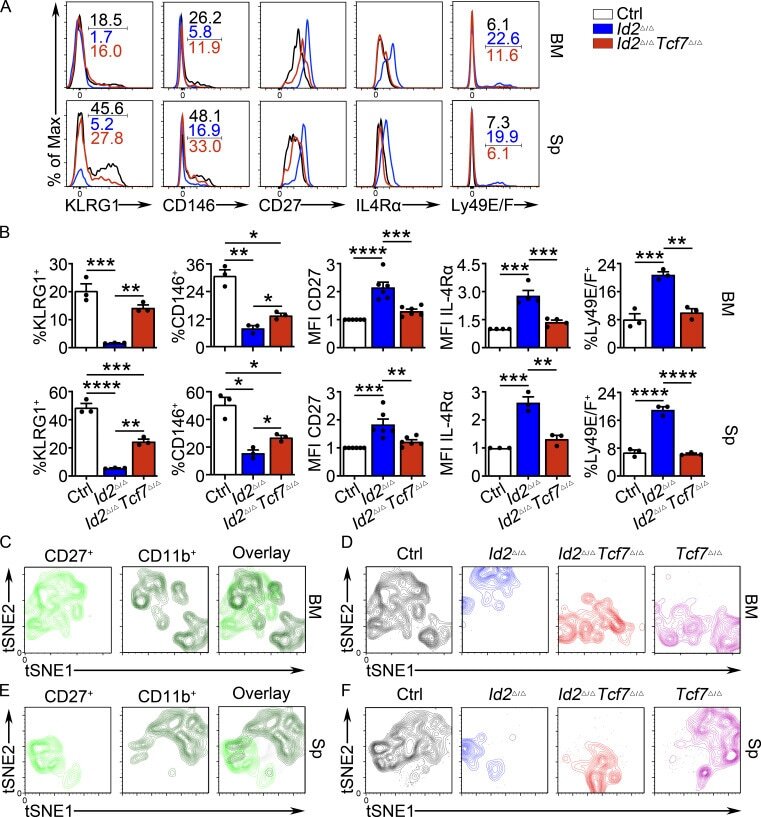
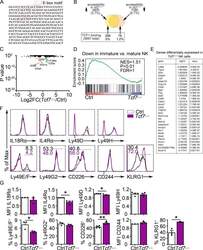
- Figure 6. TCF1 deficiency restores NK cell surface receptor expression in Id2 Delta/Delta NK cells. (A) Flow cytometry plots of different receptors on NK cells of BM (top) and spleen (Sp; bottom) from Id2 Delta/Delta Tcf7 Delta/Delta (red), Id2 Delta/Delta (blue), and Ctrl (black) mice. Numbers are the percentage of cells in the indicated gates. Data represent three to six independent experiments ( n = 3-6 for each group). (B) Summary of data shown in A. MFI of Ctrl NK cells was set as 1 in each experiment for CD27 and IL-4Ralpha. Error bars represent SEM. Statistical significance was determined by one-way ANOVA with Tukey's multiple comparisons test. *, P < 0.05; **, P < 0.01; ***, P < 0.005; ****, P < 0.001. (C and E) BM and spleen tSNE analysis showing expression of CD27 or CD11b on Ctrl NK1.1 + CD49b + NK cells and the overlay of the two markers. Data are representative of two experiments. (D and F) BM and spleen tSNE analysis on NK1.1 + CD49b + NK cells for each of the indicated genotypes. Plots were generated using surface receptors (NK1.1, CD49b, CD27, CD11b, CD49a, KLRG1, CD146, SLAMF6, CD226, IL4Ra, and CXCR3). Data are representative of two experiments.
- Conjugate
- Yellow dye
- Submitted by
- Invitrogen Antibodies (provider)
- Main image
- Experimental details
- Figure S2. Altered gene expression in Tcf7 Delta/Delta BM NK cells. (A) Sequence of the intronic region of Tcf7 that shows increased accessibility in ID2-deficient BM CD27 + CD11b - NK cells. (B) Schematic representation of the overlap between regions with altered chromatin accessibility in ID2-deficient CD27 + CD11b - NK cells by ATAC-seq and TCF1 binding sites in CD8 T cells determined by ChIP-seq (Gene Expression Omnibus accession no. GSE73239 ). Regions with increased accessibility by ATAC-seq are shown in yellow, decreased accessibility in peach, and no change in orange. TCF1 binding sites are significantly enriched in ATAC-seq regions that gain accessibility in ID2-deficient cells. P < 1.846 10-66 (Fisher's exact test). (C) Volcano plot showing Log2FC versus adj. P values for RNA-seq data from Tcf7 Delta/Delta and Ctrl NK cells. Data were generated from three biological replicates. (D) GSEA for Ctrl versus Tcf7 Delta/Delta NK cell RNA expression. (E) Table showing differentially expressed genes from RNA-seq data shown in C . (F) Flow cytometry plots of different proteins on NK cells of spleen from Tcf7 Delta/Delta and Ctrl mice ( n = 3-4 for each group from independent experiments). (G) Summary of the data in F. Error bars represent SEM. Statistical significance was determined by two-tailed unpaired t test. *, P < 0.05; **, P < 0.01. FDR, false discovery rate; NES, normalized enrichment score.
- Conjugate
- Yellow dye

- Submitted by
- Invitrogen Antibodies (provider)
- Main image
- Experimental details
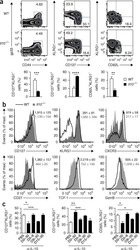
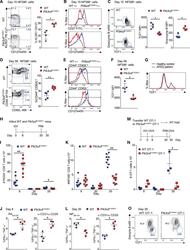
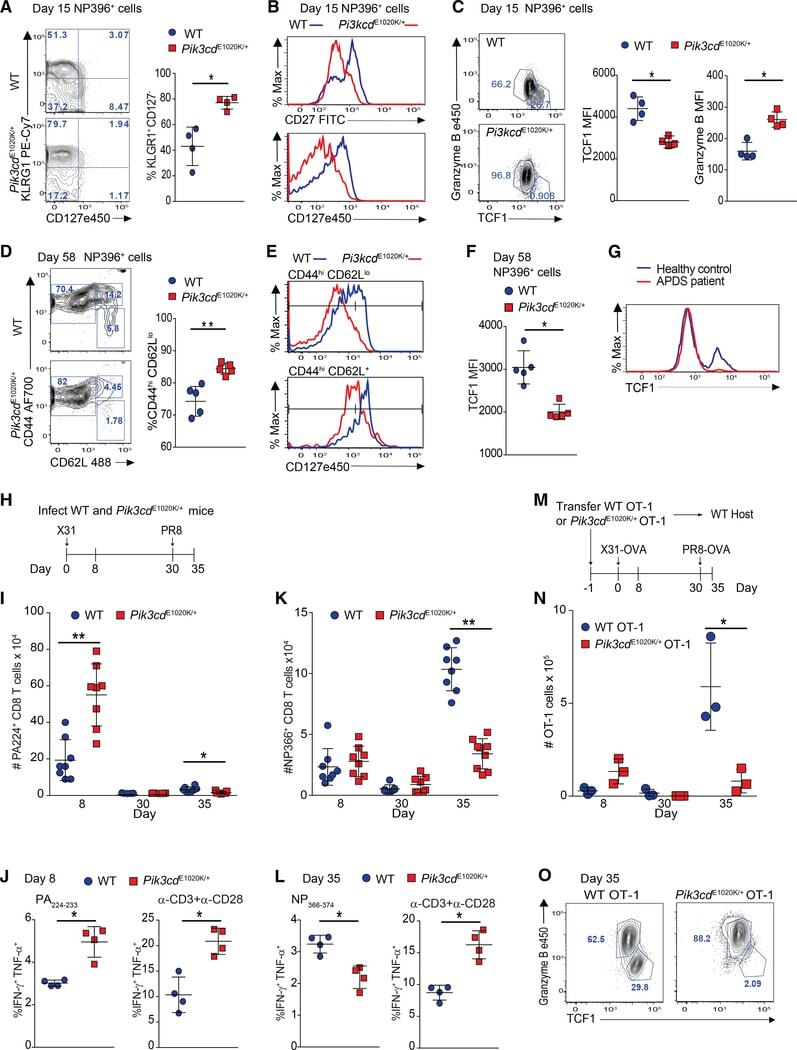
- Figure 3. Pik3cd E1020K/+ mice fail to develop a robust T CM population (A-F) Viable CD8 + splenocytes from mice infected with LCMV Armstrong (n = 2, 4-5/group/time point). (A-C) NP396-specific CD8 + cells day 15 p.i. (A) CD127 and KLRG1 expression (left: representative staining; right: %KLRG1 + CD127 - ). (B) Representative histogram of CD27 (top) and CD127 (bottom). (C) GzmB and TCF1 staining. Middle: TCF1 MFI; right: GzmB MFI. (D-F) NP396-specific CD8 + cells day 58 p.i. (D) CD44 and CD62L staining. Representative flow (left), % CD44 hi CD62L lo cells (right). (E) CD127 histograms: CD44 hi CD62L lo (top) and CD44 hi CD62L + (bottom). (F) TCF1 MFI. (G) TCF1 staining of allo-reactive CD8 + cells from healthy controls and patients with APDS (n = 2, representative histogram). (H-L) Mice were infected with X31 and challenged with PR8 (n = 2, 3-5 mice/genotype/time point). (H) Infection outline. (I) PA224-specific CD8 + cell numbers. (J) IFN-gamma and TNF-alpha from day 8 cells stimulated with either PA 224-233 (left) or anti-CD3 plus anti-CD28 (right). (K) NP366-specific CD8 + T cell numbers. (L) IFN-gamma and TNF-alpha from day 35 cells stimulated with either NP 366-374 (left) or anti-CD3 plus anti-CD28 (right). (M-O) OT-1 cells were transferred into congenic hosts, infected with influenza X31-OVA and challenged with PR8-OVA (n = 2, 3 mice/genotype/time point). (M) Outline. (N) Viable OT-1 cell numbers. (O) TCF1 and GzmB expression in OT-1 cells on day 35. Representative exper
- Conjugate
- Yellow dye
- Submitted by
- Invitrogen Antibodies (provider)
- Main image
- Experimental details
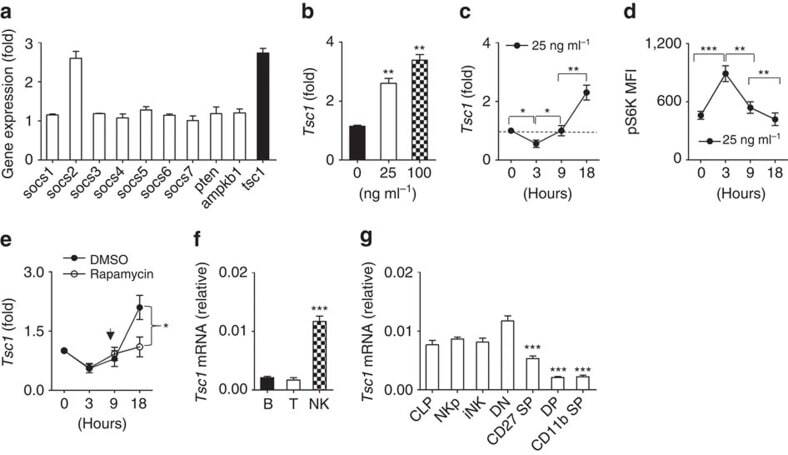
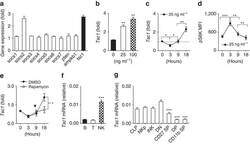
- Figure 1 Dynamic Tsc1 expression following IL-15 stimulation. ( a - c ) Quantitative reverse transcription-PCR (RT-PCR) analysis of the indicated genes in sorted CD3 - NK1.1 + cells from the spleen of WT mice before and after stimulation with 25 ng ml -1 IL-15 for 18 h ( a ), various concentration of IL-15 ( b ), or at the indicated time points ( c ). ( d ) Intracellular phosphorylated S6 in sorted NK cells after stimulation with 25 ng ml -1 IL-15 was detected by flow cytometry at the indicated time points, and the mean fluorescence intensity was calculated. ( e ) Tsc1 messenger RNA (mRNA) expression was analysed by quantitative RT-PCR in sorted CD3 - NK1.1 + cells after stimulation with 25 ng ml -1 IL-15 for 18 h in the presence of DMSO or rapamycin (10 nM). ( f ) Analysis of Tsc1 mRNA expression in sorted T, B and NK cells by quantitative PCR. (g) Analysis of Tsc1 mRNA expression in CLP, NKp and immature NK cells (iNK), and NK cell subsets, including CD27 - CD11b - (DN), CD27 + CD11b - (CD27 SP), CD27 + CD11b + (DP) and CD27 - CD11b + (CD11b SP), by quantitative PCR. The results were normalized to beta- actin ( f , g ) or are presented relative to expression in untreated cells, which was set as 1 ( a - c , e ). Value represent mean+-s.d. * P
- Conjugate
- Yellow dye