Explore
 Validate
 Learn
Learn Flow cytometry
Antibody data
- Antibody Data
- Antigen structure
- References [19]
- Comments [0]
- Validations
- Flow cytometry [1]
- Other assay [16]
Submit
Validation data
Reference
Comment
Report error
- Product number
- 14-0279-82 - Provider product page

- Provider
- Invitrogen Antibodies
- Product name
- CD27 Monoclonal Antibody (O323), eBioscience™
- Antibody type
- Monoclonal
- Antigen
- Other
- Description
- Description: The O323 monoclonal antibody reacts with human CD27, a lymphocyte-specific member of the TNFR superfamily. CD27 is expressed by a subset of thymocytes and virtually all mature T cells and is upregulated upon T-cell stimulation. CD27 binds to CD70, and through this interaction, plays an important role in T cell-B cell interaction. Applications Reported: The O323 antibody has been reported for use in flow cytometric analysis. Applications Tested: The O323 antibody has been tested by flow cytometric analysis of normal human peripheral blood cells. This can be used at less than or equal to 1 µg per test. A test is defined as the amount (µg) of antibody that will stain a cell sample in a final volume of 100 µL. Cell number should be determined empirically but can range from 10^5 to 10^8 cells/test. It is recommended that the antibody be carefully titrated for optimal performance in the assay of interest. Purity: Greater than 90%, as determined by SDS-PAGE. Aggregation: Less than 10%, as determined by HPLC. Filtration: 0.2 µm post-manufacturing filtered.
- Reactivity
- Human
- Host
- Mouse
- Isotype
- IgG
- Antibody clone number
- O323
- Vial size
- 100 µg
- Concentration
- 0.5 mg/mL
- Storage
- 4° C
Submitted references Expression of CD27 and CD28 on γδ T cells from the peripheral blood of patients with allergic rhinitis.
More than one antibody of individual B cells revealed by single-cell immune profiling.
The Calcineurin Inhibitor Tacrolimus Specifically Suppresses Human T Follicular Helper Cells.
Longitudinal transcriptomic characterization of the immune response to acute hepatitis C virus infection in patients with spontaneous viral clearance.
Perturbed CD8(+) T cell immunity across universal influenza epitopes in the elderly.
Clonally diverse CD38(+)HLA-DR(+)CD8(+) T cells persist during fatal H7N9 disease.
Antigen receptor-redirected T cells derived from hematopoietic precursor cells lack expression of the endogenous TCR/CD3 receptor and exhibit specific antitumor capacities.
Maintenance of the EBV-specific CD8(+) TCRαβ repertoire in immunosuppressed lung transplant recipients.
Abnormal phenotypic features of IgM+B cell subsets in patients with chronic hepatitis C virus infection.
Cord blood Vγ2Vδ2 T cells provide a molecular marker for the influence of pregnancy-associated malaria on neonatal immunity.
Long-lived Plasmodium falciparum specific memory B cells in naturally exposed Swedish travelers.
Rate of AIDS progression is associated with gastrointestinal dysfunction in simian immunodeficiency virus-infected pigtail macaques.
Follicular helper T cells serve as the major CD4 T cell compartment for HIV-1 infection, replication, and production.
Chronic exposure to Plasmodium falciparum is associated with phenotypic evidence of B and T cell exhaustion.
OMIP-013: differentiation of human T-cells.
Long-term immunologically competent human peripheral lymphoid tissue cultures in a 3D bioreactor.
Antigen-specific monoclonal antibodies isolated from B cells expressing constitutively active STAT5.
Gammadelta T cell immune manipulation during chronic phase of simian-human immunodeficiency virus infection [corrected] confers immunological benefits.
Wiskott-Aldrich syndrome protein is required for regulatory T cell homeostasis.
Wang Q, Sun Q, Chen Q, Li H, Liu D
Experimental and therapeutic medicine 2020 Dec;20(6):224
Experimental and therapeutic medicine 2020 Dec;20(6):224
More than one antibody of individual B cells revealed by single-cell immune profiling.
Shi Z, Zhang Q, Yan H, Yang Y, Wang P, Zhang Y, Deng Z, Yu M, Zhou W, Wang Q, Yang X, Mo X, Zhang C, Huang J, Dai H, Sun B, Zhao Y, Zhang L, Yang YG, Qiu X
Cell discovery 2019;5:64
Cell discovery 2019;5:64
The Calcineurin Inhibitor Tacrolimus Specifically Suppresses Human T Follicular Helper Cells.
Wallin EF, Hill DL, Linterman MA, Wood KJ
Frontiers in immunology 2018;9:1184
Frontiers in immunology 2018;9:1184
Longitudinal transcriptomic characterization of the immune response to acute hepatitis C virus infection in patients with spontaneous viral clearance.
Rosenberg BR, Depla M, Freije CA, Gaucher D, Mazouz S, Boisvert M, Bédard N, Bruneau J, Rice CM, Shoukry NH
PLoS pathogens 2018 Sep;14(9):e1007290
PLoS pathogens 2018 Sep;14(9):e1007290
Perturbed CD8(+) T cell immunity across universal influenza epitopes in the elderly.
Nguyen THO, Sant S, Bird NL, Grant EJ, Clemens EB, Koutsakos M, Valkenburg SA, Gras S, Lappas M, Jaworowski A, Crowe J, Loh L, Kedzierska K
Journal of leukocyte biology 2018 Feb;103(2):321-339
Journal of leukocyte biology 2018 Feb;103(2):321-339
Clonally diverse CD38(+)HLA-DR(+)CD8(+) T cells persist during fatal H7N9 disease.
Wang Z, Zhu L, Nguyen THO, Wan Y, Sant S, Quiñones-Parra SM, Crawford JC, Eltahla AA, Rizzetto S, Bull RA, Qiu C, Koutsakos M, Clemens EB, Loh L, Chen T, Liu L, Cao P, Ren Y, Kedzierski L, Kotsimbos T, McCaw JM, La Gruta NL, Turner SJ, Cheng AC, Luciani F, Zhang X, Doherty PC, Thomas PG, Xu J, Kedzierska K
Nature communications 2018 Feb 26;9(1):824
Nature communications 2018 Feb 26;9(1):824
Antigen receptor-redirected T cells derived from hematopoietic precursor cells lack expression of the endogenous TCR/CD3 receptor and exhibit specific antitumor capacities.
Van Caeneghem Y, De Munter S, Tieppo P, Goetgeluk G, Weening K, Verstichel G, Bonte S, Taghon T, Leclercq G, Kerre T, Debets R, Vermijlen D, Abken H, Vandekerckhove B
Oncoimmunology 2017;6(3):e1283460
Oncoimmunology 2017;6(3):e1283460
Maintenance of the EBV-specific CD8(+) TCRαβ repertoire in immunosuppressed lung transplant recipients.
Nguyen TH, Bird NL, Grant EJ, Miles JJ, Thomas PG, Kotsimbos TC, Mifsud NA, Kedzierska K
Immunology and cell biology 2017 Jan;95(1):77-86
Immunology and cell biology 2017 Jan;95(1):77-86
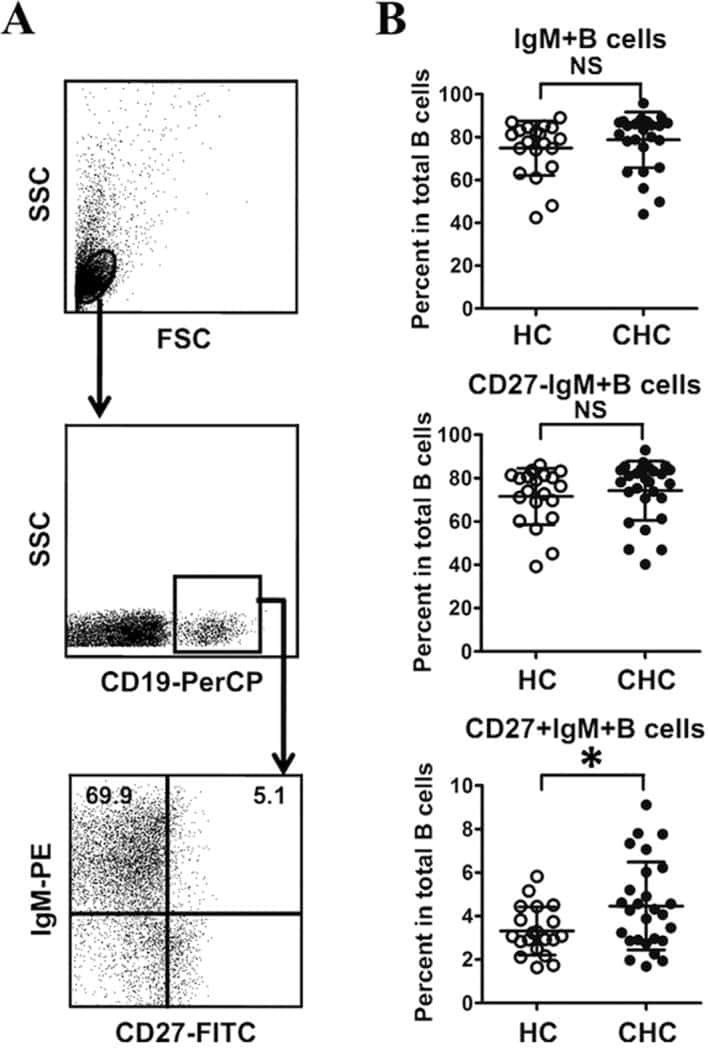
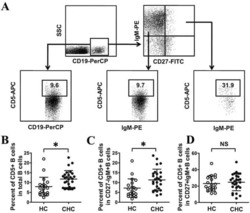
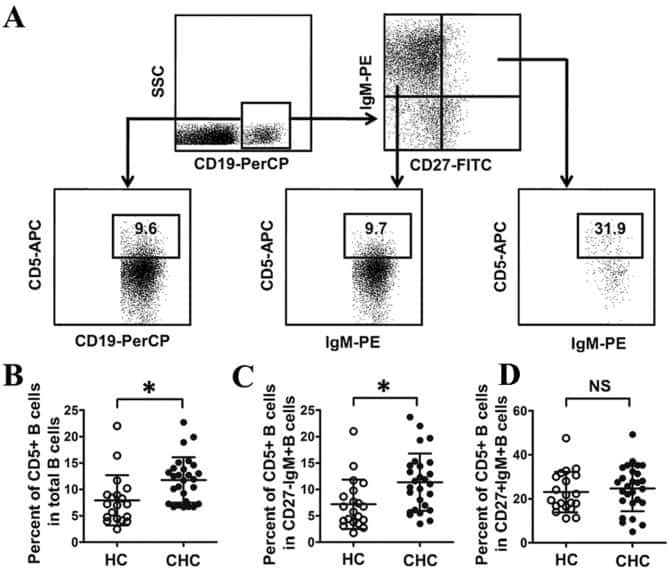
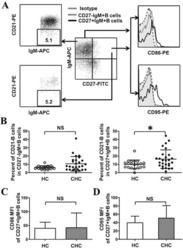
Abnormal phenotypic features of IgM+B cell subsets in patients with chronic hepatitis C virus infection.
Kong F, Feng B, Zhang H, Rao H, Wang J, Cong X, Wei L
Experimental and therapeutic medicine 2017 Aug;14(2):1846-1852
Experimental and therapeutic medicine 2017 Aug;14(2):1846-1852
Cord blood Vγ2Vδ2 T cells provide a molecular marker for the influence of pregnancy-associated malaria on neonatal immunity.
Cairo C, Longinaker N, Cappelli G, Leke RG, Ondo MM, Djokam R, Fogako J, Leke RJ, Sagnia B, Sosso S, Colizzi V, Pauza CD
The Journal of infectious diseases 2014 May 15;209(10):1653-62
The Journal of infectious diseases 2014 May 15;209(10):1653-62
Long-lived Plasmodium falciparum specific memory B cells in naturally exposed Swedish travelers.
Ndungu FM, Lundblom K, Rono J, Illingworth J, Eriksson S, Färnert A
European journal of immunology 2013 Nov;43(11):2919-29
European journal of immunology 2013 Nov;43(11):2919-29
Rate of AIDS progression is associated with gastrointestinal dysfunction in simian immunodeficiency virus-infected pigtail macaques.
Canary LA, Vinton CL, Morcock DR, Pierce JB, Estes JD, Brenchley JM, Klatt NR
Journal of immunology (Baltimore, Md. : 1950) 2013 Mar 15;190(6):2959-65
Journal of immunology (Baltimore, Md. : 1950) 2013 Mar 15;190(6):2959-65
Follicular helper T cells serve as the major CD4 T cell compartment for HIV-1 infection, replication, and production.
Perreau M, Savoye AL, De Crignis E, Corpataux JM, Cubas R, Haddad EK, De Leval L, Graziosi C, Pantaleo G
The Journal of experimental medicine 2013 Jan 14;210(1):143-56
The Journal of experimental medicine 2013 Jan 14;210(1):143-56
Chronic exposure to Plasmodium falciparum is associated with phenotypic evidence of B and T cell exhaustion.
Illingworth J, Butler NS, Roetynck S, Mwacharo J, Pierce SK, Bejon P, Crompton PD, Marsh K, Ndungu FM
Journal of immunology (Baltimore, Md. : 1950) 2013 Feb 1;190(3):1038-47
Journal of immunology (Baltimore, Md. : 1950) 2013 Feb 1;190(3):1038-47
OMIP-013: differentiation of human T-cells.
Mahnke YD, Beddall MH, Roederer M
Cytometry. Part A : the journal of the International Society for Analytical Cytology 2012 Nov;81(11):935-6
Cytometry. Part A : the journal of the International Society for Analytical Cytology 2012 Nov;81(11):935-6
Long-term immunologically competent human peripheral lymphoid tissue cultures in a 3D bioreactor.
Kuzin I, Sun H, Moshkani S, Feng C, Mantalaris A, Wu JH, Bottaro A
Biotechnology and bioengineering 2011 Jun;108(6):1430-40
Biotechnology and bioengineering 2011 Jun;108(6):1430-40
Antigen-specific monoclonal antibodies isolated from B cells expressing constitutively active STAT5.
Scheeren FA, van Geelen CM, Yasuda E, Spits H, Beaumont T
PloS one 2011 Apr 15;6(4):e17189
PloS one 2011 Apr 15;6(4):e17189
Gammadelta T cell immune manipulation during chronic phase of simian-human immunodeficiency virus infection [corrected] confers immunological benefits.
Ali Z, Yan L, Plagman N, Reichenberg A, Hintz M, Jomaa H, Villinger F, Chen ZW
Journal of immunology (Baltimore, Md. : 1950) 2009 Oct 15;183(8):5407-17
Journal of immunology (Baltimore, Md. : 1950) 2009 Oct 15;183(8):5407-17
Wiskott-Aldrich syndrome protein is required for regulatory T cell homeostasis.
Humblet-Baron S, Sather B, Anover S, Becker-Herman S, Kasprowicz DJ, Khim S, Nguyen T, Hudkins-Loya K, Alpers CE, Ziegler SF, Ochs H, Torgerson T, Campbell DJ, Rawlings DJ
The Journal of clinical investigation 2007 Feb;117(2):407-18
The Journal of clinical investigation 2007 Feb;117(2):407-18
No comments: Submit comment
Supportive validation
- Submitted by
- Invitrogen Antibodies (provider)
- Main image

- Experimental details
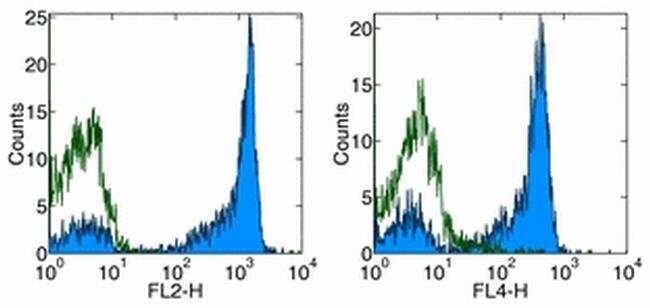
- Staining of normal human peripheral blood cells with Anti-Human CD27 PE (left) and APC (right). Appropriate isotype controls were used (open histogram). Cells in the lymphocyte population were used for analysis.
Supportive validation
- Submitted by
- Invitrogen Antibodies (provider)
- Main image
- Experimental details
- NULL
- Submitted by
- Invitrogen Antibodies (provider)
- Main image
- Experimental details
- NULL
- Submitted by
- Invitrogen Antibodies (provider)
- Main image
- Experimental details
- NULL
- Submitted by
- Invitrogen Antibodies (provider)
- Main image

- Experimental details
- NULL
- Submitted by
- Invitrogen Antibodies (provider)
- Main image
- Experimental details
- NULL
- Submitted by
- Invitrogen Antibodies (provider)
- Main image
- Experimental details
- NULL

- Submitted by
- Invitrogen Antibodies (provider)
- Main image
- Experimental details
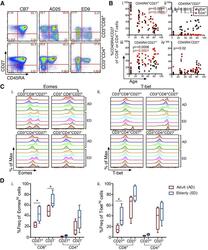
- Changes in CD8 + and CD4 + T cell compartments with aging . CD8 + and CD4 + T cell frequencies and phenotypes were compared among human CB, AD, and ED. (A) Representative FACS plots show 4 subsets of CD8 + and CD4 + T cell differentiation in a CB, AD, and ED, based on CD45RA vs. CD27 expression. (B) Frequency of (i) CD45RA + CD27 + , (ii) CD45RA + CD27 - , (iii) CD45RA - CD27 + , and (iv) CD45RA - CD27 - subsets plotted against age for CD8 + (black circles) and CD4 + T cells (red squares). P -values in black and red are shown for CD8 + and CD4 + T cells, respectively (Spearman rank correlation). (C) Histograms of (i) Eomes and (ii) T-bet expression on CD8 + (upper) and CD4 + T cells (lower) in the presence or absence of CD27 coexpression. (D) Box-and-whisker plots of (i) Eomes hi and (ii) T-bet hi populations in CD27 + and CD27 - subpopulations of CD8 + and CD4 + T cells in AD (red, n = 4) vs. ED (blue, n = 5) donors. Rectangles represent the second and third quartiles separated by the median horizontal line. Lower and upper quartiles are shown as vertical lines on either side of the rectangle (* P < 0.05, Mann-Whitney)

- Submitted by
- Invitrogen Antibodies (provider)
- Main image

- Experimental details
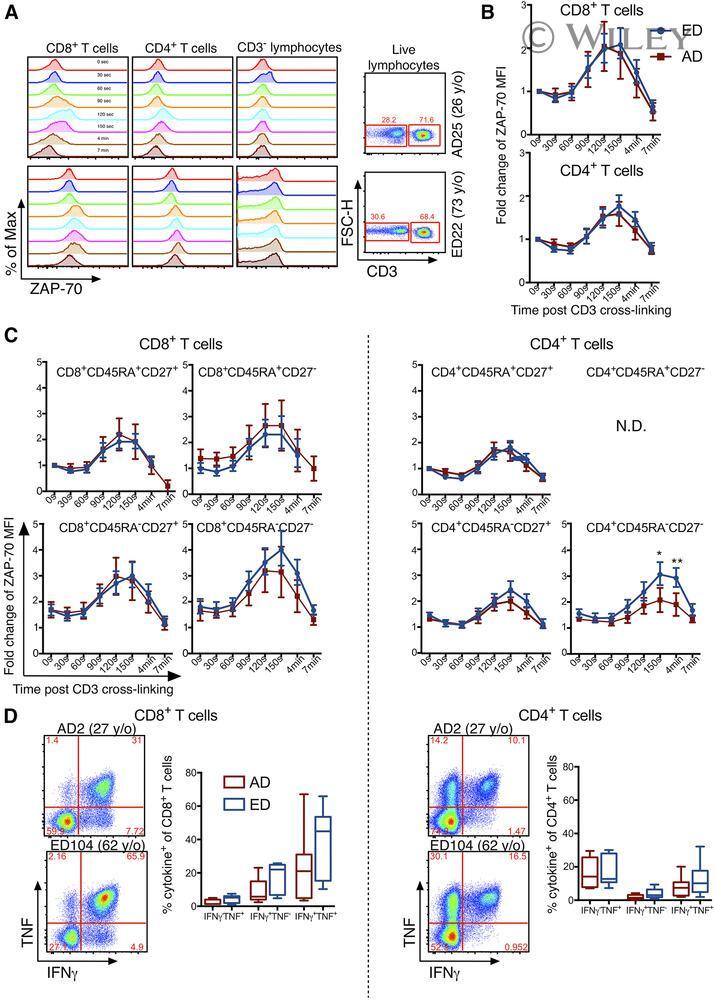
- Phosflow measurement of CD3-dependent ZAP-70 in T cell subsets . (A) Representative histograms are shown for ZAP-70 expression in T cell subsets and non-T cells following CD3 cross-linking in an AD and ED at indicated times. (Right) Representative FACS plots of CD3 - non-T cells and CD3 + T cells gated on viable lymphocytes. FSC-H, Forward-scatter-height. (B) Fold change in ZAP-70 geometric MFI from baseline (0 s) at indicated times in CD8 + and CD4 + T cells for ED (blue lines, n = 17) and AD (red lines, n = 4) donors and (C) within CD8 + and CD4 + T cell differentiation subsets based on CD45RA and CD27 expression. Of note, ZAP-70 measurement was not included for the effector (CD45RA + CD27 - ) CD4 + T cell population, as this subset was minimally expressed in CD4 + T cells. (D) IFN-gamma and TNF cytokine expression in CD8 + and CD4 + T cells after stimulation of younger adults (red, n = 7) and elderly adult (blue, n = 7) PBMCs for 6 h ex vivo with PMA and ionomycin. Error bars represent sem . Rectangles represent the second and third quartiles separated by the median horizontal line. Lower and upper quartiles are shown as vertical lines on either side of the rectangle. y/o, Years old
- Submitted by
- Invitrogen Antibodies (provider)
- Main image
- Experimental details
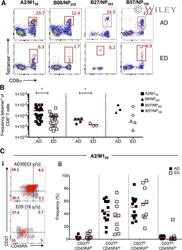
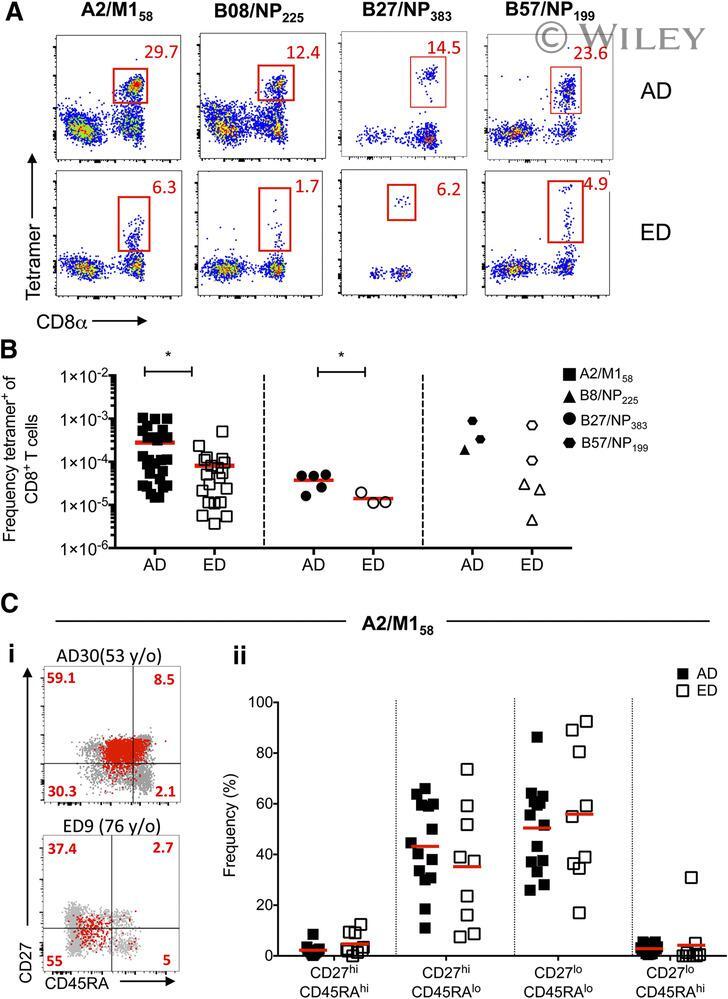
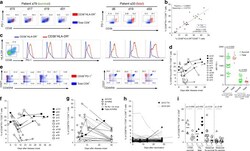
- Lower frequencies of elderly influenza-specific CD8 + T cells across universal influenza HLAs . PBMCs from EDs and ADs were enriched for antigen-specific CD8 + T cells using TAME. (A) Representative FACS plots of enriched fractions of epitope-specific CD8 + T cells in ADs and EDs. Cells were gated as viable CD14 - CD19 - CD3 + CD8 + tetramer + cells. (B) Precursor frequencies of epitope-specific CD8 + T cells of total CD8 + T cells in ADs (closed symbols) and EDs (open symbols) for A2/M1 58 + CD8 + T cells (AD: n = 27; ED: n = 20), B27/NP 383 + CD8 + (AD: n = 5; ED: n = 3), and combined B8/NP 225 + CD8 + (AD: n = 1; ED: n = 3) and B57/NP 199 + CD8 + (AD: n = 2; ED: n = 2) frequencies (as a result of a limited number of donors), where 1 x 10 -4 represents a frequency of 1 in 10,000 CD8 + T cells. Mean and P -value symbols (* P < 0.05; Student''s t test) are shown. (Ci) Representative FACS plots of CD27 and CD45RA profiling of TAME-enriched, A2/M1 58 -specific CD8 + T cells (in red) superimposed onto total CD8 + T cells (in gray) in ADs and EDs. (ii) CD45RA - CD27 +/- memory profiles of TAME-enriched, A2/M1 58 -specific CD8 + T cells in ADs and EDs are comparable
- Submitted by
- Invitrogen Antibodies (provider)
- Main image

- Experimental details
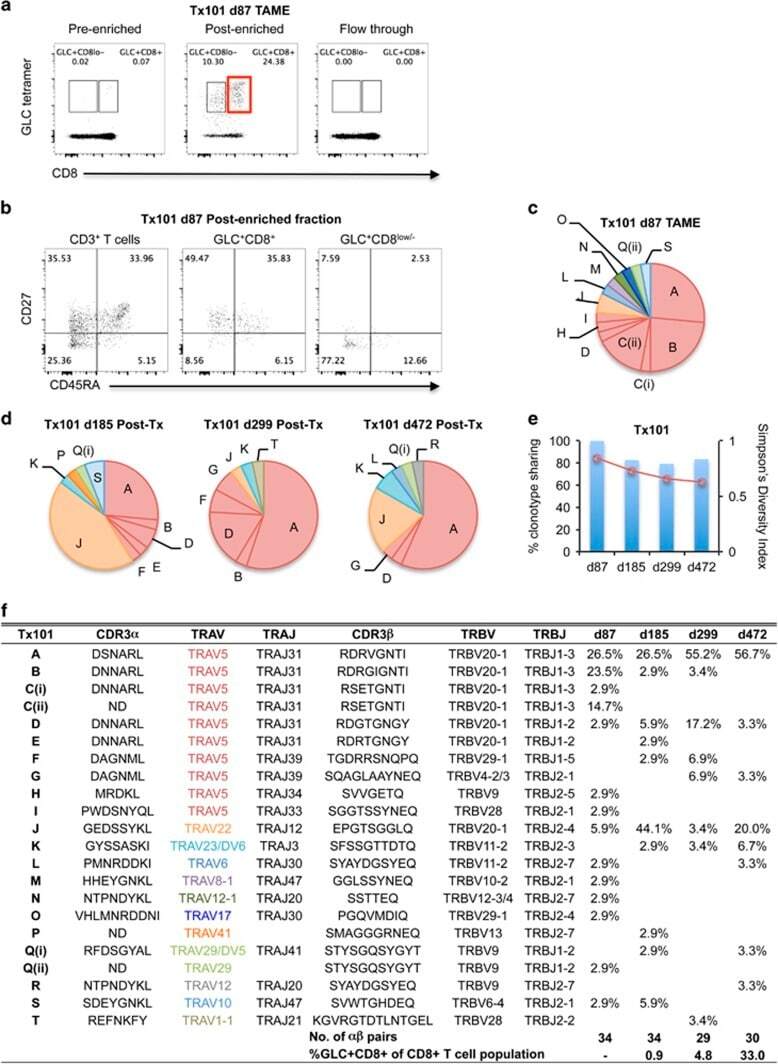
- Figure 4 Early detection of TRAV5-biased GLC-specific CD8 + T cells in patient Tx101. PBMC from patient Tx101 ( a ) at 87 days post transplant underwent tetramer-associated magnetic enrichment (TAME). Pre-enriched, post-enriched and the flowthrough fractions were collected and analyzed based on GLC-tetramer and anti-CD8 antibody staining. Percentages are based on CD3 + T cells. CD3 + T cells, GLC-tetramer + CD8 + and GLC-tetramer + CD8 low/- cells from the post-enriched fraction ( b ) were phenotypically analyzed based on CD45RA and CD27 expression. Pie charts of paired GLC-specific CD8 + TCRalphabeta clonotypes following TAME (d87) ( c ) or following in vitro expansion (d185, d299 and d472) ( d ) are shown. Pie chart area shaded in red represent TRAV5 clonotypes. Percentage of TCRalphabeta clonotypes shared compared to TAME (d87) (bar graph, left y axis) and SDI values (line graph, right y axis) are shown in e . Frequencies of GLC + CD8 + T cells following expansion and clonotype details are listed in f (ND; not determined).
- Submitted by
- Invitrogen Antibodies (provider)
- Main image

- Experimental details
- 1 Example staining and gating. A : Identification of T-cell subsets. After selecting live CD3 + single cells, eventual dye aggregates are excluded (gray box) and a lymphocyte gate set. CD4 + and CD8 + T-cells are then selected for further analysis. B : Identification of T-cell differentiation stages in both CD4 + and CD8 + T-cells. CD45RA, CCR7, and CD27 are used to identify T CM , T TM , T EM , and T TE . Within CD45RA + CCR7 + CD27 + (naive-like) cells, CD95 + CD28 + CD57 - CD127 + cells are T SCM , while CD95 - cells are T NV . Within these, the CD31 + fraction comprises recent thymic emigrants (RTE, CD4 + T-cells only). Overlay plots show total CD4 + or CD8 + T-cells in gray, with fuchsia (CD45RA + CCR7 + CD95 + ) or red events (T SCM ) gated as shown.

- Submitted by
- Invitrogen Antibodies (provider)
- Main image
- Experimental details
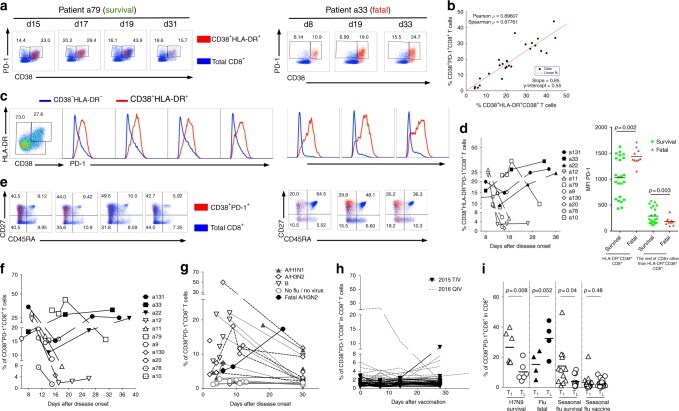
- Fig. 2 Dynamics of CD38 + HLA-DR + PD-1 + CD8 + cells segregate H7N9 disease outcome. a Representative FACS plots of PD-1 expression within the CD38 + HLA-DR + CD8 + T cells (in red) and the total CD8 + T cells (in blue) in patient a79 (recovered from H7N9) and patient a33 (died from H7N9). b Correlation between the frequency of CD38 + PD-1 + CD8 + T cells and a proportion of CD38 + HLA-DR + CD8 + T cells, as measured by Spearman test. c Representative histograms of PD-1 expression within CD38 + HLA-DR + CD8 + T cells (red) and the remaining non-CD38 + HLA-DR + CD8 + T cells (blue). d High and prolonged expression of PD-1 in patients who died, as triple-positive CD38 + HLA-DR + PD-1 + and mean fluorescence intensity (MFI) of PD-1 expression within CD38 + HLA-DR + CD8 + T cells and non-CD38 + HLA-DR + CD8 + T cells for survivals and fatal cases (a standard two-tail Student''s t -test), with samples from individual patients being acquired on an LSR Fortessa on different days. e CD45RA and CD27 profiles on CD38 + PD-1 + CD8 + T cells (in red) and on total CD8 + T cells (in blue). f Similar to CD38 + HLA-DR + CD8 + T cells, the frequency of CD38 + PD-1 + CD8 + T cells declined with time in the H7N9 survival group, which was maintained or increased in H7N9 patients who died. The frequency of CD38 + PD-1 + CD8 + T cells was also analyzed in g patients hospitalized with seasonal pH1N1 (5 patients; dotted lines, solid triangles), H3N2 (10 patients in dashed lines, open diamonds), inf
- Submitted by
- Invitrogen Antibodies (provider)
- Main image
- Experimental details
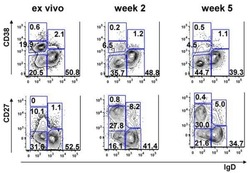
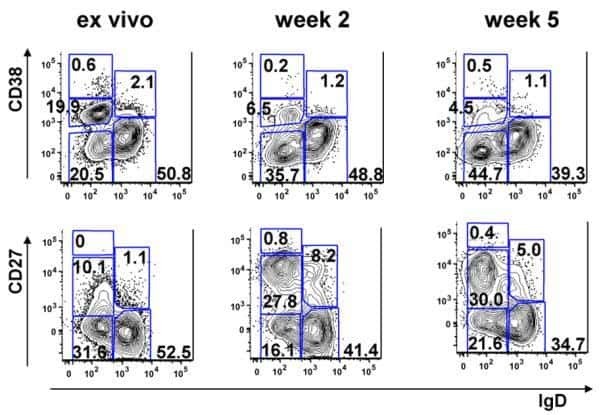
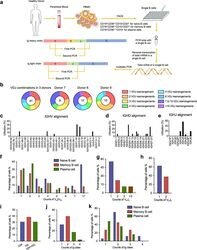
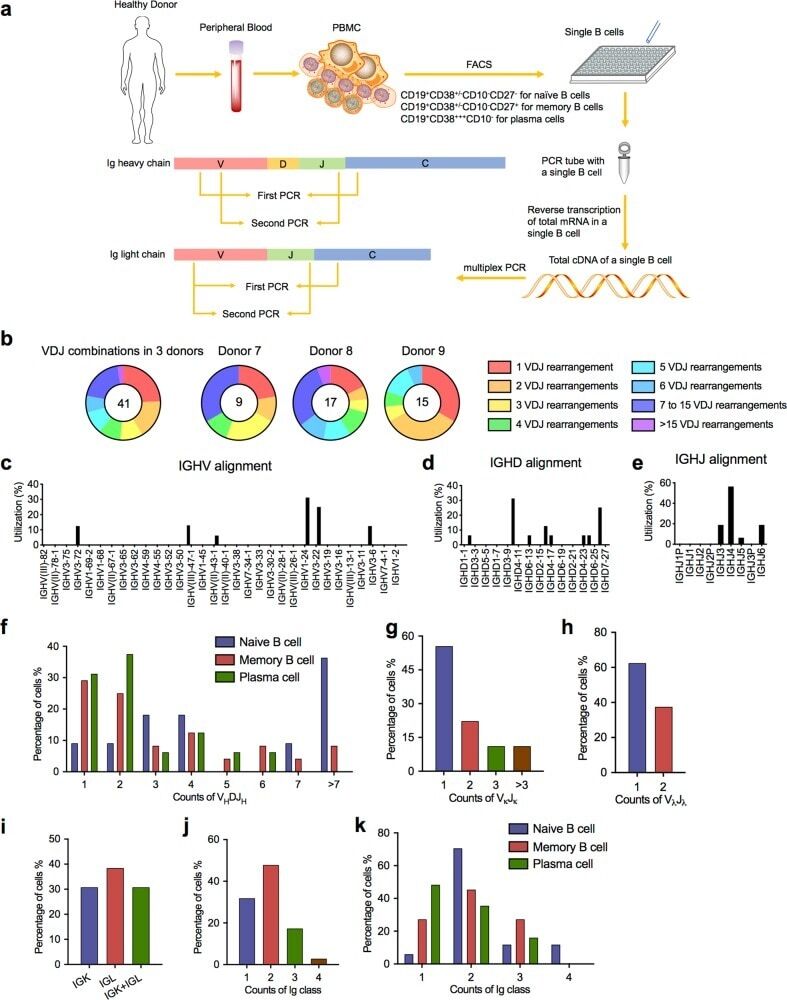
- Fig. 4 Sanger sequencing validation of multiple V(D)J recombination patterns in single B cells. a Sketching diagram of the single-cell sequencing procedure. We isolated peripheral blood from healthy donors and separated peripheral blood mononuclear cells (PBMCs). Naive B cells (CD19 + CD38 +/- CD10 - CD27 - ), memory B cells (CD19 + CD38 +/- CD10 - CD27 + ), and plasma cells (CD19 + CD38 +++ CD10 - ) were sorted by FACS. The total mRNA in single B cells was reverse transcribed, and the Ig heavy chain and light chain were amplified by multiplex PCR. FACS, fluorescence-activated cell sorting. b Proportions of cells expressing VDJ recombination patterns in single B cells from donor 7, donor 8, and donor 9. c - e Distribution and frequency of IGHV ( c ), IGHD ( d ), and IGHJ ( e ) segments in Ig germline genes in a single cell. f Proportions of single naive B cells, plasma cells, and memory B cells expressing one, two, or three V H DJ H segments. g , h Proportions of single B cells expressing one, two, or more V kappa J kappa segments ( g ) and V lamda J lamda segments ( h ). i Counts of single B cells expressing only Igkappa or Iglamda or expressing both Igkappa and Iglamda. j , k Proportions of naive B cells, plasma cells, and memory B cells expressing one, two, three, or four Ig classes
- Submitted by
- Invitrogen Antibodies (provider)
- Main image
- Experimental details
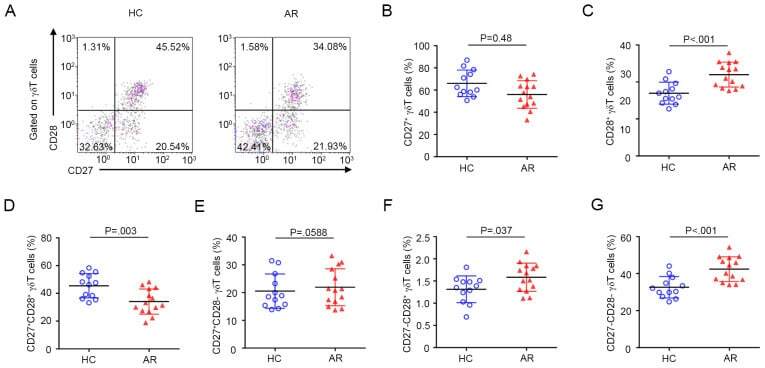
- Figure 3 Expression pattern of CD27 and CD28 on gammadelta T cells in AR. (A) Representative flow cytometry plots of the expression of CD27 and CD28 on gammadelta T cells among PBMCs from HC (n=12) and AR (n=14) subjects. (B-G) Quantification of the percentage of (B) CD27+, (C) CD28+, (D) CD27 + CD28 + , (E) CD27 + CD28 - , (F) CD27 - CD28 + and (G) CD27 - CD28 - gammadelta + T cells in PBMCs. Values are expressed as the mean +- standard deviation. AR, allergic rhinitis; HC, healthy controls; PBMCs, peripheral blood mononuclear cells.
- Submitted by
- Invitrogen Antibodies (provider)
- Main image
- Experimental details
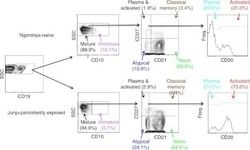
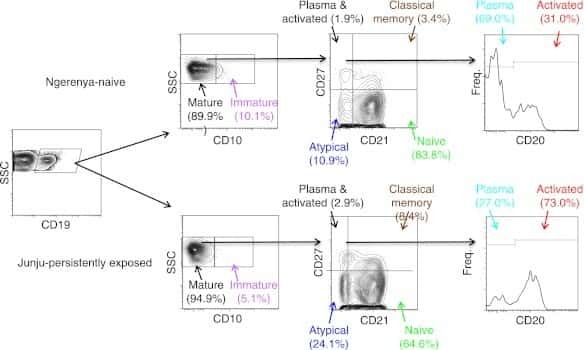
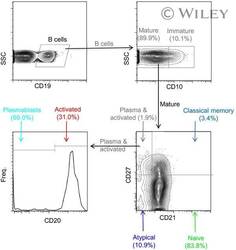
- Gating strategy for flow cytometric phenotyping of B cells. Total B cells were identified by CD 19 expression (top left) and then subsets were identified by the expression of CD 10, CD 20, CD 21, and CD27. All numbers represent the percentage of the parent gate.

- Submitted by
- Invitrogen Antibodies (provider)
- Main image
- Experimental details
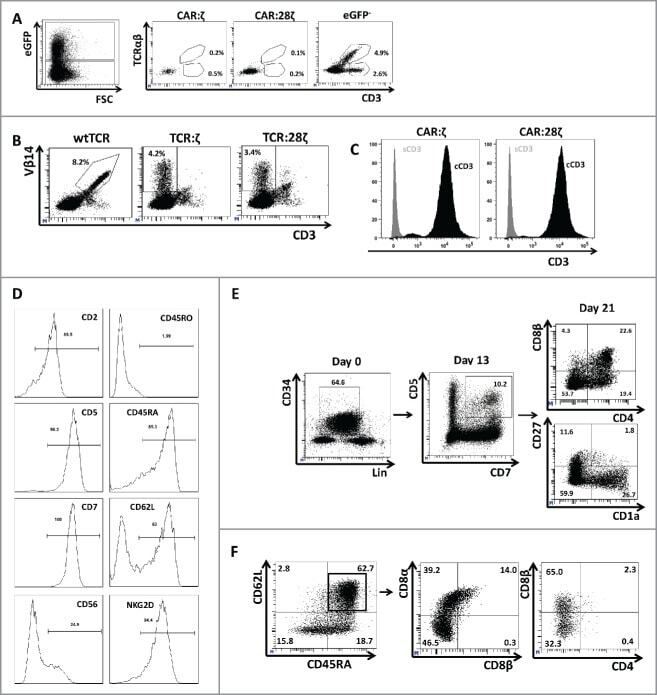
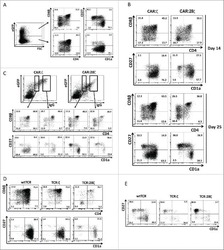
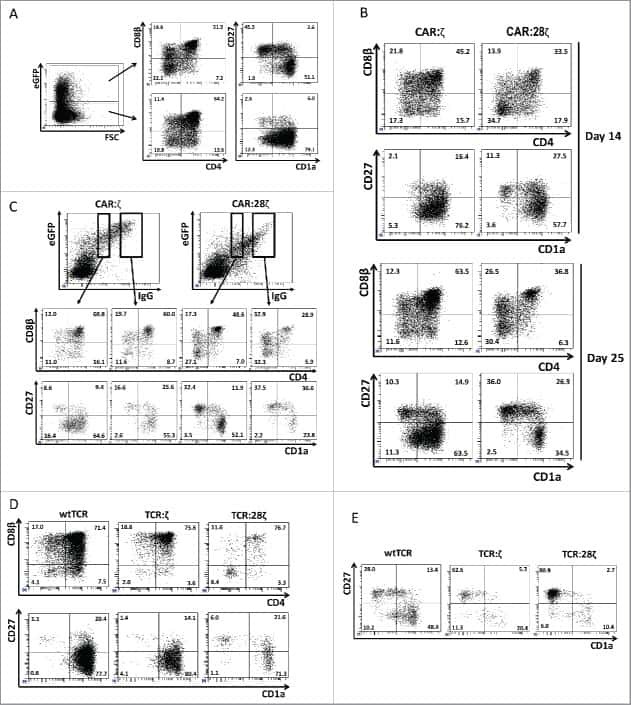
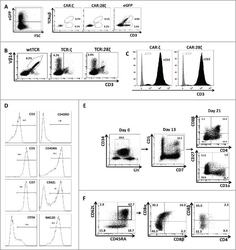
- Figure 3. Phenotype and endogenous TCR expression of CD34 + HPC-derived transgenic AR + T cells. Flow cytometric analysis of the AR-transgenic T cells. (A) CAR-transgenic GFP + cells of cultures transduced to express either the CAR:zeta or the CAR:28zeta were analyzed on day 26 of OP9-DL1 culture for CD3 and TCRalphabeta expression. As a control, GFP - cells are shown from the OP9-DL1 culture transduced to express the CAR:zeta ( N = 5). (B) Dot plots show CD3 expression of cells from the OP9-DL1 cultures transgenic for the wtTCR, TCR:zeta and TCR:28zeta. Vbeta14 staining is used to mark transgene expression, as no GFP is expressed by the transgenic cells ( N = 5). (C) Surface and cytoplasmic staining for CD3 of in vitro generated mature T cells that were expanded for one cycle on feeder cells in the presence of cytokines. (D) Expression of various membrane markers by the CD27 + CD1a - mature T cells at the end of OP9-DL1 culture (46 d) ( N = 2). (E) Day 0: fresh cord blood after MACS CD34 enrichment sorted using the sorting window shown. Day 13: cord blood cells cultured on OP9-DL1 were sorted for CD5 CD7 double positive cells, using the indicated sorting window. The cells were then transduced to express CAR:28zeta and further differentiated on OP9-DL1 feeder layer. Day 21: analysis of the transgenic GFP + cultured cells for DP cells and CD27 + CD1a - mature cells. (F) Flow cytometric analysis of GFP + CAR:28zeta-transgenic cultures, gated on GFP + CD27 + CD1a - mature AR + c