Explore
 Validate
 Learn
Learn Western blot
 ELISA
ELISA Immunocytochemistry
Antibody data
- Antibody Data
- Antigen structure
- References [23]
- Comments [0]
- Validations
- Immunocytochemistry [2]
- Immunohistochemistry [1]
- Other assay [21]
Submit
Validation data
Reference
Comment
Report error
- Product number
- 36-1900 - Provider product page

- Provider
- Invitrogen Antibodies
- Product name
- VE-cadherin Polyclonal Antibody
- Antibody type
- Polyclonal
- Antigen
- Synthetic peptide
- Description
- This antibody has been successfully used in western blot, immunofluorescence, immunohistochemistry, and ELISA.
- Reactivity
- Human, Mouse, Rat
- Host
- Rabbit
- Isotype
- IgG
- Vial size
- 50 μg
- Concentration
- 0.25 mg/mL
- Storage
- -20°C
Submitted references Extracellular Alterations in pH and K+ Modify the Murine Brain Endothelial Cell Total and Phospho-Proteome.
CU06-1004 enhances vascular integrity and improves cardiac remodeling by suppressing edema and inflammation in myocardial ischemia-reperfusion injury.
Wnt Site Signaling Inhibitor Secreted Frizzled-Related Protein 3 Protects Mitral Valve Endothelium From Myocardial Infarction-Induced Endothelial-to-Mesenchymal Transition.
A Pulmonary Vascular Model From Endothelialized Whole Organ Scaffolds.
Recombinant Annexin A2 Administration Improves Neurological Outcomes After Traumatic Brain Injury in Mice.
Calciprotein Particles Link Disturbed Mineral Homeostasis with Cardiovascular Disease by Causing Endothelial Dysfunction and Vascular Inflammation.
Alzheimer amyloid-β- peptide disrupts membrane localization of glucose transporter 1 in astrocytes: implications for glucose levels in brain and blood.
Mitomycin C induces pulmonary vascular endothelial-to-mesenchymal transition and pulmonary veno-occlusive disease via Smad3-dependent pathway in rats.
Hemovasculogenic origin of blood vessels in the developing mouse brain.
Dexmedetomidine protects against endothelial injury in septic rats induced by cecal ligation and puncture by decreasing angiopoietin 2 and increasing vascular endothelial cadherin levels.
Diammonium glycyrrhizinate lipid ligand ameliorates lipopolysaccharide-induced acute lung injury by modulating vascular endothelial barrier function.
The Role of Heparan Sulfate and Neuropilin 2 in VEGFA Signaling in Human Endothelial Tip Cells and Non-Tip Cells during Angiogenesis In Vitro.
Co-Culture of Primary Human Coronary Artery and Internal Thoracic Artery Endothelial Cells Results in Mutually Beneficial Paracrine Interactions.
Calciprotein Particles Cause Endothelial Dysfunction under Flow.
Dedifferentiation of smooth muscle cells in intracranial aneurysms and its potential contribution to the pathogenesis.
α1AMP-Activated Protein Kinase Protects against Lipopolysaccharide-Induced Endothelial Barrier Disruption via Junctional Reinforcement and Activation of the p38 MAPK/HSP27 Pathway.
Human Peripheral Blood-Derived Endothelial Colony-Forming Cells Are Highly Similar to Mature Vascular Endothelial Cells yet Demonstrate a Transitional Transcriptomic Signature.
Vascular Tissue Engineering Using Scaffold-Free Prevascular Endothelial-Fibroblast Constructs.
VE-Cadherin Is Required for Lymphatic Valve Formation and Maintenance.
GPR55-mediated effects on brain microvascular endothelial cells and the blood-brain barrier.
Re-endothelialization of rat lung scaffolds through passive, gravity-driven seeding of segment-specific pulmonary endothelial cells.
The loss of sustained Ca(2+) signaling underlies suppressed endothelial nitric oxide production in preeclamptic pregnancies: implications for new therapy.
Interference with endothelial cell function by JG-03-14, an agent that binds to the colchicine site on microtubules.
Wahl JR, Vivek A, Palomino SM, Almuslim M, Cottier KE, Langlais PR, Streicher JM, Vanderah TW, Liktor-Busa E, Largent-Milnes TM
Pharmaceutics 2022 Jul 15;14(7)
Pharmaceutics 2022 Jul 15;14(7)
CU06-1004 enhances vascular integrity and improves cardiac remodeling by suppressing edema and inflammation in myocardial ischemia-reperfusion injury.
Zhang H, Kim H, Park BW, Noh M, Kim Y, Park J, Park JH, Kim JJ, Sim WS, Ban K, Park HJ, Kwon YG
Experimental & molecular medicine 2022 Jan;54(1):23-34
Experimental & molecular medicine 2022 Jan;54(1):23-34
Wnt Site Signaling Inhibitor Secreted Frizzled-Related Protein 3 Protects Mitral Valve Endothelium From Myocardial Infarction-Induced Endothelial-to-Mesenchymal Transition.
Alvandi Z, Nagata Y, Passos LSA, Hashemi Gheinani A, Guerrero JL, Wylie-Sears J, Romero DC, Morris BA, Sullivan SM, Yaghoubian KM, Alvandi A, Adam RM, Aikawa E, Levine RA, Bischoff J
Journal of the American Heart Association 2022 Apr 5;11(7):e023695
Journal of the American Heart Association 2022 Apr 5;11(7):e023695
A Pulmonary Vascular Model From Endothelialized Whole Organ Scaffolds.
Yuan Y, Leiby KL, Greaney AM, Raredon MSB, Qian H, Schupp JC, Engler AJ, Baevova P, Adams TS, Kural MH, Wang J, Obata T, Yoder MC, Kaminski N, Niklason LE
Frontiers in bioengineering and biotechnology 2021;9:760309
Frontiers in bioengineering and biotechnology 2021;9:760309
Recombinant Annexin A2 Administration Improves Neurological Outcomes After Traumatic Brain Injury in Mice.
Cheng C, Wang X, Jiang Y, Li Y, Liao Z, Li W, Yu Z, Whalen MJ, Lok J, Dumont AS, Liu N, Wang X
Frontiers in pharmacology 2021;12:708469
Frontiers in pharmacology 2021;12:708469
Calciprotein Particles Link Disturbed Mineral Homeostasis with Cardiovascular Disease by Causing Endothelial Dysfunction and Vascular Inflammation.
Shishkova DK, Velikanova EA, Bogdanov LA, Sinitsky MY, Kostyunin AE, Tsepokina AV, Gruzdeva OV, Mironov AV, Mukhamadiyarov RA, Glushkova TV, Krivkina EO, Matveeva VG, Hryachkova ON, Markova VE, Dyleva YA, Belik EV, Frolov AV, Shabaev AR, Efimova OS, Popova AN, Malysheva VY, Kolmykov RP, Sevostyanov OG, Russakov DM, Dolganyuk VF, Gutakovsky AK, Zhivodkov YA, Kozhukhov AS, Brusina EB, Ismagilov ZR, Barbarash OL, Yuzhalin AE, Kutikhin AG
International journal of molecular sciences 2021 Nov 18;22(22)
International journal of molecular sciences 2021 Nov 18;22(22)
Alzheimer amyloid-β- peptide disrupts membrane localization of glucose transporter 1 in astrocytes: implications for glucose levels in brain and blood.
Hendrix RD, Ou Y, Davis JE, Odle AK, Groves TR, Allen AR, Childs GV, Barger SW
Neurobiology of aging 2021 Jan;97:73-88
Neurobiology of aging 2021 Jan;97:73-88
Mitomycin C induces pulmonary vascular endothelial-to-mesenchymal transition and pulmonary veno-occlusive disease via Smad3-dependent pathway in rats.
Zhang C, Lu W, Luo X, Liu S, Li Y, Zheng Q, Liu W, Wu X, Chen Y, Jiang Q, Zhang Z, Gu G, Chen J, Chen H, Liao J, Liu C, Hong C, Tang H, Sun D, Yang K, Wang J
British journal of pharmacology 2021 Jan;178(1):217-235
British journal of pharmacology 2021 Jan;178(1):217-235
Hemovasculogenic origin of blood vessels in the developing mouse brain.
Gama Sosa MA, De Gasperi R, Perez GM, Hof PR, Elder GA
The Journal of comparative neurology 2021 Feb;529(2):340-366
The Journal of comparative neurology 2021 Feb;529(2):340-366
Dexmedetomidine protects against endothelial injury in septic rats induced by cecal ligation and puncture by decreasing angiopoietin 2 and increasing vascular endothelial cadherin levels.
Zhang P, Peng J, Ren YQ, Zheng H, Yan H
Experimental and therapeutic medicine 2021 Feb;21(2):111
Experimental and therapeutic medicine 2021 Feb;21(2):111
Diammonium glycyrrhizinate lipid ligand ameliorates lipopolysaccharide-induced acute lung injury by modulating vascular endothelial barrier function.
Liu MM, Zhou J, Ji D, Yang J, Huang YP, Wang Q
Experimental and therapeutic medicine 2021 Apr;21(4):303
Experimental and therapeutic medicine 2021 Apr;21(4):303
The Role of Heparan Sulfate and Neuropilin 2 in VEGFA Signaling in Human Endothelial Tip Cells and Non-Tip Cells during Angiogenesis In Vitro.
Dallinga MG, Habani YI, Schimmel AWM, Dallinga-Thie GM, van Noorden CJF, Klaassen I, Schlingemann RO
Cells 2021 Apr 16;10(4)
Cells 2021 Apr 16;10(4)
Co-Culture of Primary Human Coronary Artery and Internal Thoracic Artery Endothelial Cells Results in Mutually Beneficial Paracrine Interactions.
Shishkova D, Markova V, Sinitsky M, Tsepokina A, Frolov A, Zagorodnikov N, Bogdanov L, Kutikhin A
International journal of molecular sciences 2020 Oct 28;21(21)
International journal of molecular sciences 2020 Oct 28;21(21)
Calciprotein Particles Cause Endothelial Dysfunction under Flow.
Shishkova D, Markova V, Sinitsky M, Tsepokina A, Velikanova E, Bogdanov L, Glushkova T, Kutikhin A
International journal of molecular sciences 2020 Nov 20;21(22)
International journal of molecular sciences 2020 Nov 20;21(22)
Dedifferentiation of smooth muscle cells in intracranial aneurysms and its potential contribution to the pathogenesis.
Oka M, Shimo S, Ohno N, Imai H, Abekura Y, Koseki H, Miyata H, Shimizu K, Kushamae M, Ono I, Nozaki K, Kawashima A, Kawamata T, Aoki T
Scientific reports 2020 May 20;10(1):8330
Scientific reports 2020 May 20;10(1):8330
α1AMP-Activated Protein Kinase Protects against Lipopolysaccharide-Induced Endothelial Barrier Disruption via Junctional Reinforcement and Activation of the p38 MAPK/HSP27 Pathway.
Angé M, Castanares-Zapatero D, De Poortere J, Dufeys C, Courtoy GE, Bouzin C, Quarck R, Bertrand L, Beauloye C, Horman S
International journal of molecular sciences 2020 Aug 4;21(15)
International journal of molecular sciences 2020 Aug 4;21(15)
Human Peripheral Blood-Derived Endothelial Colony-Forming Cells Are Highly Similar to Mature Vascular Endothelial Cells yet Demonstrate a Transitional Transcriptomic Signature.
Kutikhin AG, Tupikin AE, Matveeva VG, Shishkova DK, Antonova LV, Kabilov MR, Velikanova EA
Cells 2020 Apr 3;9(4)
Cells 2020 Apr 3;9(4)
Vascular Tissue Engineering Using Scaffold-Free Prevascular Endothelial-Fibroblast Constructs.
Pattanaik S, Arbra C, Bainbridge H, Dennis SG, Fann SA, Yost MJ
BioResearch open access 2019;8(1):1-15
BioResearch open access 2019;8(1):1-15
VE-Cadherin Is Required for Lymphatic Valve Formation and Maintenance.
Yang Y, Cha B, Motawe ZY, Srinivasan RS, Scallan JP
Cell reports 2019 Aug 27;28(9):2397-2412.e4
Cell reports 2019 Aug 27;28(9):2397-2412.e4
GPR55-mediated effects on brain microvascular endothelial cells and the blood-brain barrier.
Leo LM, Familusi B, Hoang M, Smith R, Lindenau K, Sporici KT, Brailoiu E, Abood ME, Brailoiu GC
Neuroscience 2019 Aug 21;414:88-98
Neuroscience 2019 Aug 21;414:88-98
Re-endothelialization of rat lung scaffolds through passive, gravity-driven seeding of segment-specific pulmonary endothelial cells.
Scarritt ME, Pashos NC, Motherwell JM, Eagle ZR, Burkett BJ, Gregory AN, Mostany R, Weiss DJ, Alvarez DF, Bunnell BA
Journal of tissue engineering and regenerative medicine 2018 Feb;12(2):e786-e806
Journal of tissue engineering and regenerative medicine 2018 Feb;12(2):e786-e806
The loss of sustained Ca(2+) signaling underlies suppressed endothelial nitric oxide production in preeclamptic pregnancies: implications for new therapy.
Krupp J, Boeldt DS, Yi FX, Grummer MA, Bankowski Anaya HA, Shah DM, Bird IM
American journal of physiology. Heart and circulatory physiology 2013 Oct 1;305(7):H969-79
American journal of physiology. Heart and circulatory physiology 2013 Oct 1;305(7):H969-79
Interference with endothelial cell function by JG-03-14, an agent that binds to the colchicine site on microtubules.
Dalyot-Herman N, Delgado-Lopez F, Gewirtz DA, Gupton JT, Schwartz EL
Biochemical pharmacology 2009 Nov 1;78(9):1167-77
Biochemical pharmacology 2009 Nov 1;78(9):1167-77
No comments: Submit comment
Supportive validation
- Submitted by
- Invitrogen Antibodies (provider)
- Main image
- Experimental details
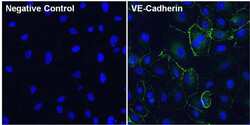
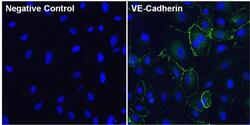
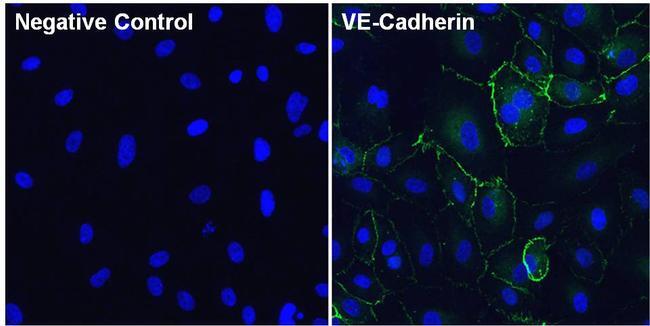
- Immunofluorescent analysis of VE-Cadherin (green) in Huvec cells. The cells were fixed with 4% paraformaldehyde for 15 minutes, permeabilized with 0.1% Triton X-100 in PBS for 10 minutes, and blocked with 3% BSA in PBS (Product # 37525) for 30 minutes at room temperature. Cells were stained with a VE-Cadherin polyclonal antibody (Product # 36-1900) at a dilution of 10 µg/mL in blocking buffer for 1 hour at room temperature, and then incubated with a Goat anti-Rabbit IgG (H+L) Superclonal Secondary Antibody, Alexa Fluor® 488 conjugate (Product # A27034) at a dilution of 1:1000 for 1 hour at room temperature (green). Nuclei (blue) were stained with Hoechst 33342 dye (Product # 62249). Images were taken on a Thermo Scientific ToxInsight Instrument at 20X magnification.

- Submitted by
- Invitrogen Antibodies (provider)
- Main image
- Experimental details
- Immunofluorescent analysis of VE-Cadherin (green) in Huvec cells. The cells were fixed with 4% paraformaldehyde for 15 minutes, permeabilized with 0.1% Triton X-100 in PBS for 10 minutes, and blocked with 3% BSA in PBS (Product # 37525) for 30 minutes at room temperature. Cells were stained with a VE-Cadherin polyclonal antibody (Product # 36-1900) at a dilution of 10 µg/mL in blocking buffer for 1 hour at room temperature, and then incubated with a Goat anti-Rabbit IgG (Heavy Chain) Superclonal Secondary Antibody, Alexa Fluor® 488 conjugate (Product # A27034) at a dilution of 1:1000 for 1 hour at room temperature (green). Nuclei (blue) were stained with Hoechst 33342 dye (Product # 62249). Images were taken on a Thermo Scientific ToxInsight Instrument at 20X magnification.
Supportive validation
- Submitted by
- Invitrogen Antibodies (provider)
- Main image
- Experimental details
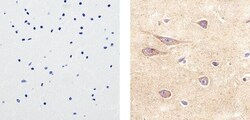
- Immunohistochemistry analysis of VE-Cadherin/CD144 showing staining in the membrane and cytoplasm of paraffin-embedded human brain tissue (right) compared to a negative control without primary antibody (left). To expose target proteins, antigen retrieval was performed using 10mM sodium citrate (pH 6.0), microwaved for 8-15 min. Following antigen retrieval, tissues were blocked in 3% H2O2-methanol for 15 min at room temperature, washed with ddH2O and PBS, and then probed with a VE-Cadherin/CD144 polyclonal antibody (Product # 36-1900) diluted in 3% BSA-PBS at a dilution of 1:20 overnight at 4°C in a humidified chamber. Tissues were washed extensively in PBST and detection was performed using an HRP-conjugated secondary antibody followed by colorimetric detection using a DAB kit. Tissues were counterstained with hematoxylin and dehydrated with ethanol and xylene to prep for mounting.
Supportive validation
- Submitted by
- Invitrogen Antibodies (provider)
- Main image
- Experimental details
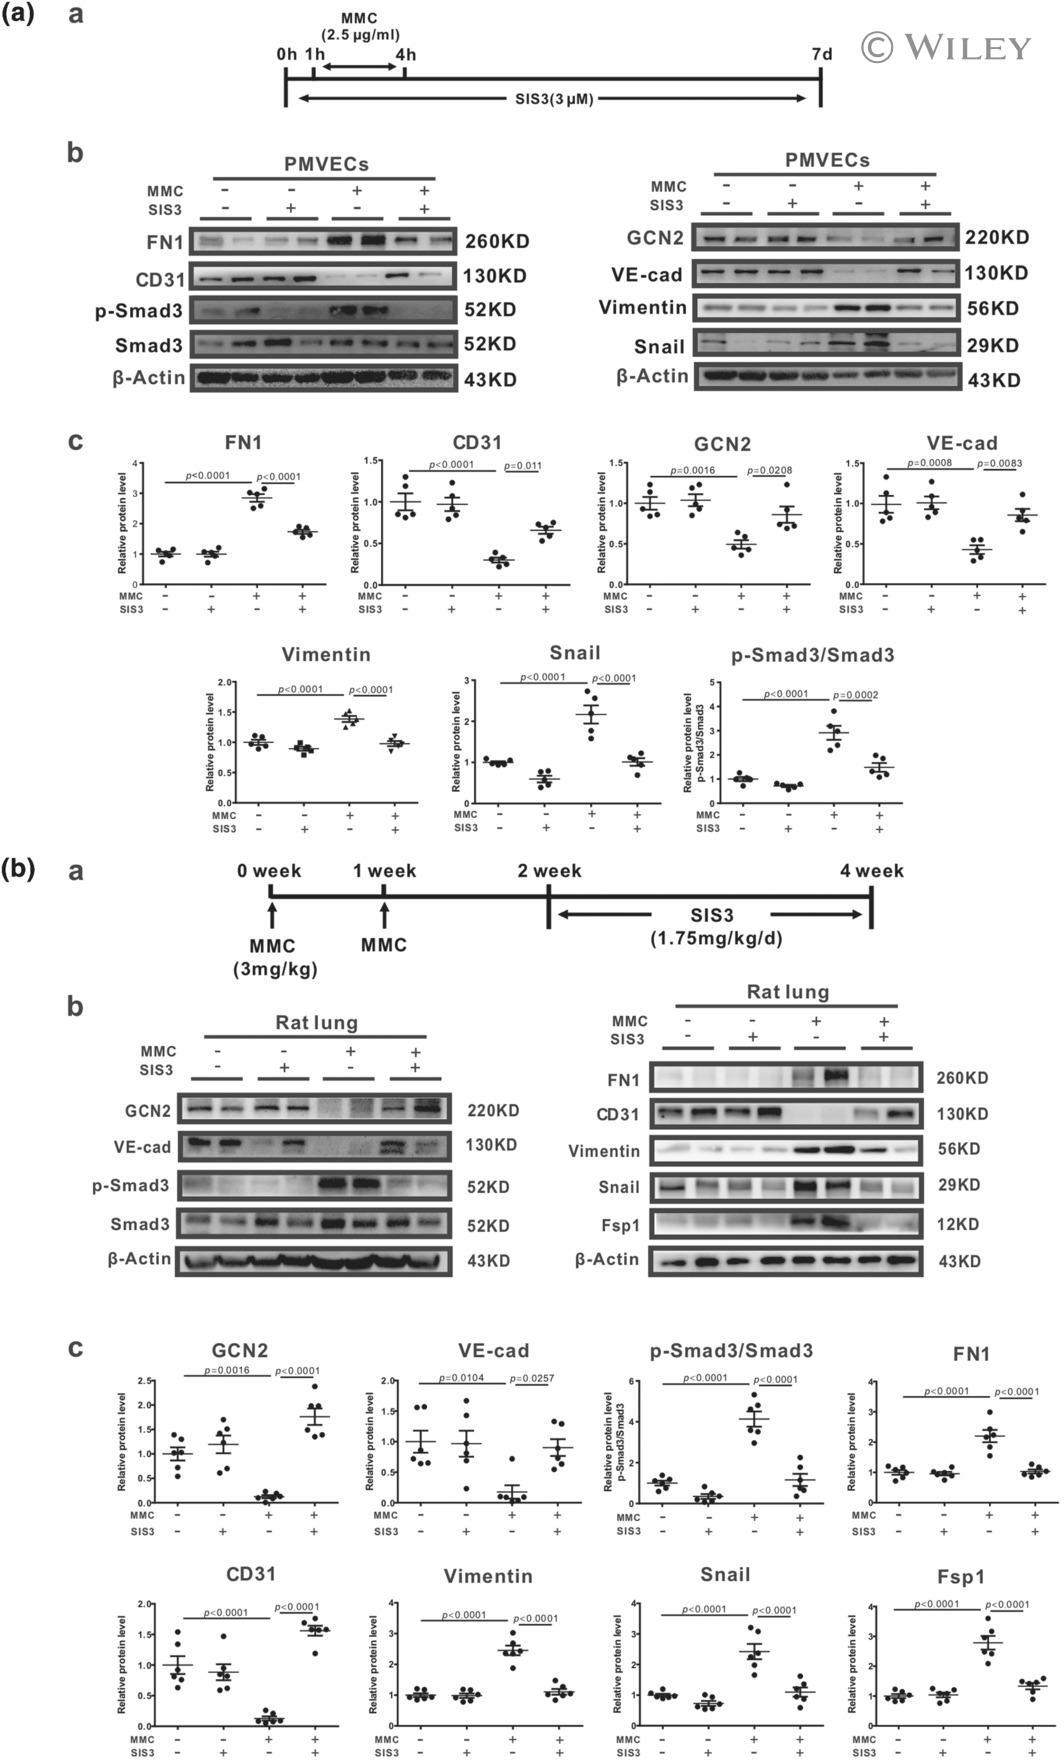
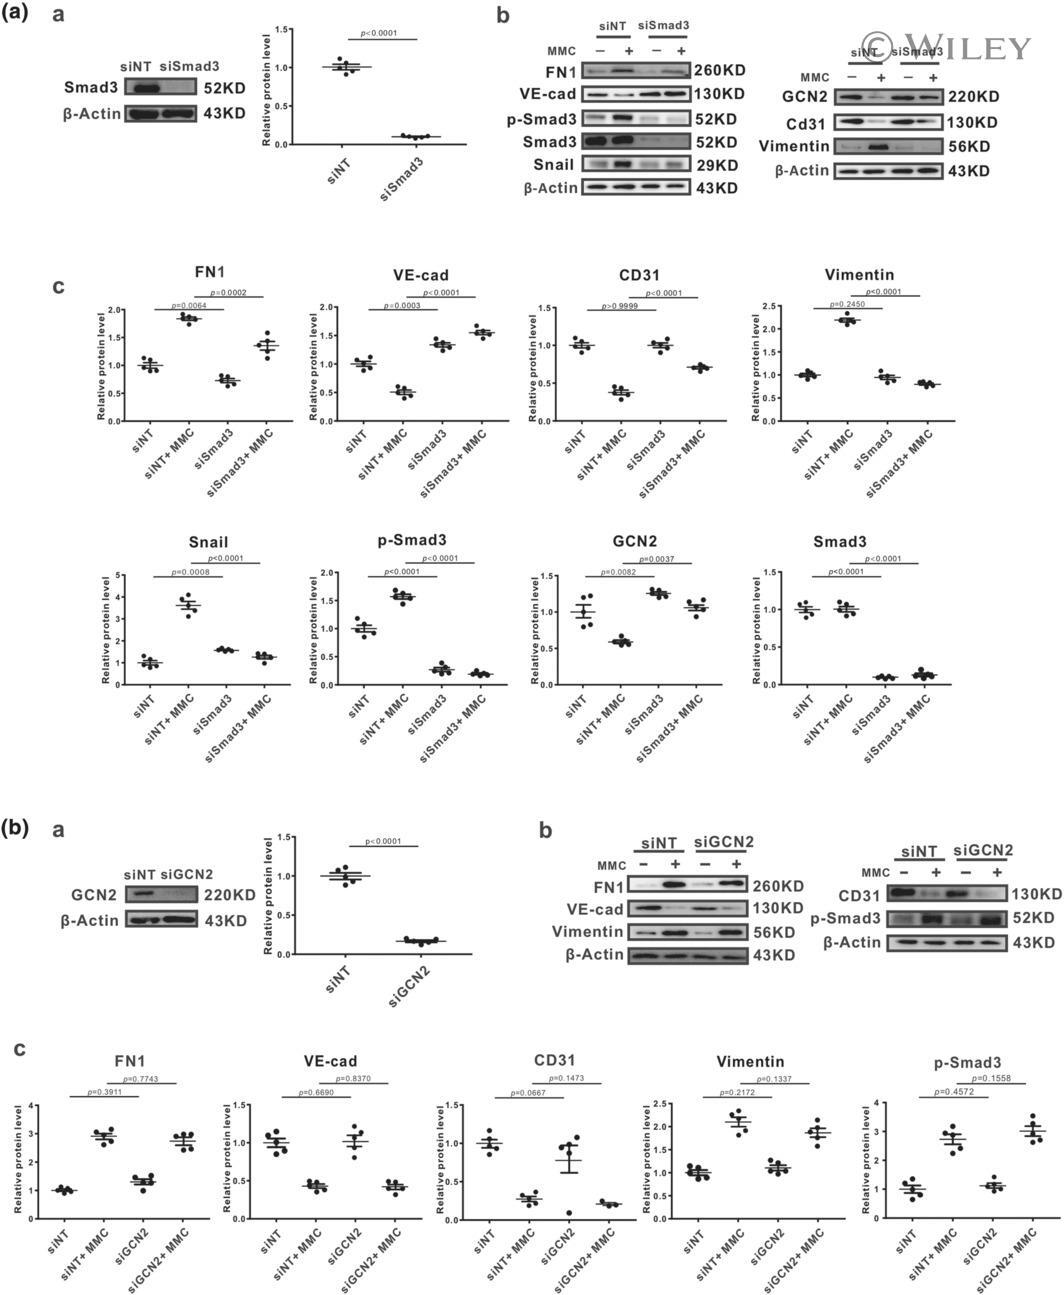
- 4 FIGURE Smad3 inhibitor SIS3 inhibits endothelial-to-mesenchymal transition (EndoMT) in both rat pulmonary microvascular endothelial cells (PMVECs) and mitomycin C (MMC)-induced pulmonary veno-occlusive disease (PVOD) rats. a: Schematic illustration (A), western blotting (B) and analysed bar graphs (C) showing the relative protein levels of VE-cadherin, CD31, fibronectin (FN1), vimentin, Snail, p-Smad3, Smad3 and GCN2 in rat PMVECs treated with either NC, SIS3, MMC or MMC + SIS3. n = 5 in each group. b: Schematic illustration (A), western blotting (B) and analysed bar graphs (C) showing the relative protein levels of VE-cadherin, CD31, FN1, vimentin, Snail, p-Smad3, Smad3, Fsp1 and GCN2 in the lungs of rats treated with either NC, SIS3, MMC or MMC + SIS3. Analysis of western blotting results normalized to beta-actin. Date are represented as means +- SEM, n = 6 in each group. Two-way ANOVA was used for comparison among three groups
- Submitted by
- Invitrogen Antibodies (provider)
- Main image

- Experimental details
- 5 FIGURE Knockdown of Smad3 attenuates mitomycin C (MMC)-induced endothelial-to-mesenchymal transition (EndoMT) in rat pulmonary microvascular endothelial cells (PMVECs). a-A: Representing effective knockdown of Smad3 protein. Western blotting (B) and analysed bar graphs (C) showing the relative protein levels of VE-cad, CD31, fibronectin (FN1), vimentin, Snail, p-Smad3, Smad3, GCN2 in either non-targeting siRNA (siNT) or Smad3 siRNA (siSmad3) treated groups, with/without MMC induction. b-A: Representing effective knockdown of GCN2 protein. Western blotting (B) and analysed bar graphs (C) showing the relative protein levels of VE-cadherin, CD31, FN1, vimentin, Snail, p-Smad3, Smad3, GCN2 in either non-targeting siRNA (siNT) or Eif2ak4 siRNA (siGCN2) treated groups, with/without MMC induction. Analysis of western blotting results normalized to beta-actin. Date are represented as means +- SEM, n = 5 in each group. Student's t -test was used for comparison between two groups and two-way ANOVA was used for comparison among four groups
- Submitted by
- Invitrogen Antibodies (provider)
- Main image
- Experimental details
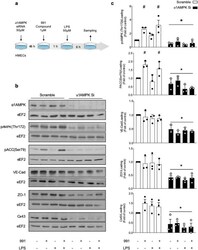
- Figure 1 Basal alpha1AMPK regulates VE-Cad, ZO-1, and Cx43 expression. ( a ) Schematic representation of the experimental design, in which HMECs were transfected with control non-targeting siRNA or alpha1AMPK siRNA (50 nM) for 48 h. Then, they were treated with 991 (1 muM) or DMSO for one hour and subsequently exposed or not exposed to lipopolysaccharide (LPS, 50 muM) for six hours; ( b , c ) Human dermal microvascular endothelial cells (HMECs) were treated according to the protocol detailed in ( a ). Cell lysates were submitted to Western blot analysis and probed with alpha1AMPK, phospho-AMPK (Thr172), phospho-ACC (Ser79), VE-Cad, ZO-1, and Cx43 antibodies (Abs). Anti-eukaryotic elongation factor 2 (eEF2) was used as a loading control. Representative western blots; ( b ) and quantifications ( c ) are shown. Data are expressed as mean +- standard deviation (SD) (three biological replicates for each condition). # p < 0.05 is relative to corresponding untreated HMECs and * p < 0.05 is relative to cells transfected with the scrambled siRNA. The data underwent two-way analysis of variance (ANOVA).
- Submitted by
- Invitrogen Antibodies (provider)
- Main image
- Experimental details
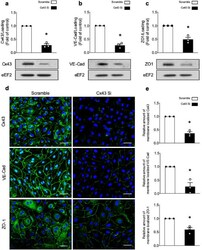
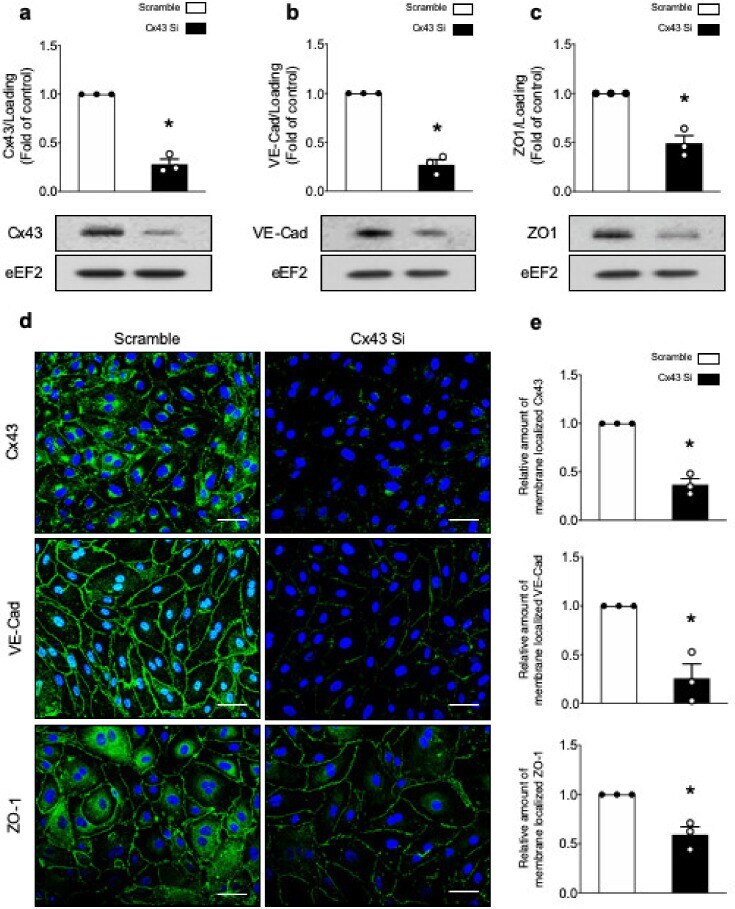
- Figure 2 Cx43 deficiency is associated with decreased VE-Cad and ZO-1 expression. ( a - e ) HMECs were transfected with control non-targeting siRNA or Cx43 siRNA (50 nm) for 48 h. ( a - c ) Cell lysates were submitted to Western blot analysis and probed with Cx43 ( a ), VE-Cad ( b ), and ZO-1 ( c ) Abs. eEF2 was used as a loading control. Representative Western blots ( top panel) and quantifications ( bottom panel) are shown; ( d , e ) Cx43, VE-Cad, and ZO-1 immunostainings. Nuclei are stained with DAPI. Scale bar, 50 mum. Representative images ( d ) and quantifications ( e ) are shown. Data are expressed as mean +- SD (three biological replicates for each condition). * p < 0.05 is relative to cells transfected with the scrambled siRNA. Analyses were performed using Student's t -test.
- Submitted by
- Invitrogen Antibodies (provider)
- Main image
- Experimental details
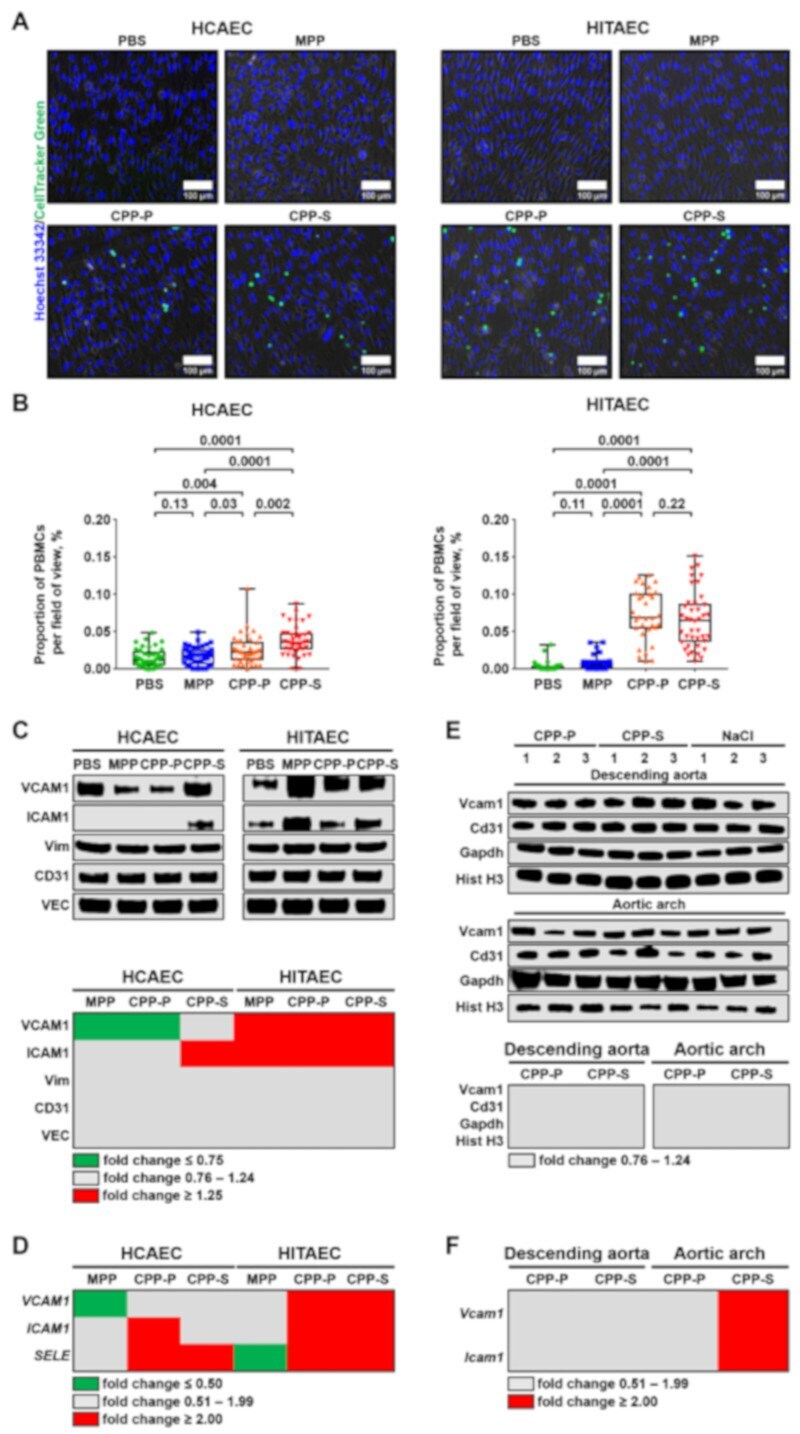
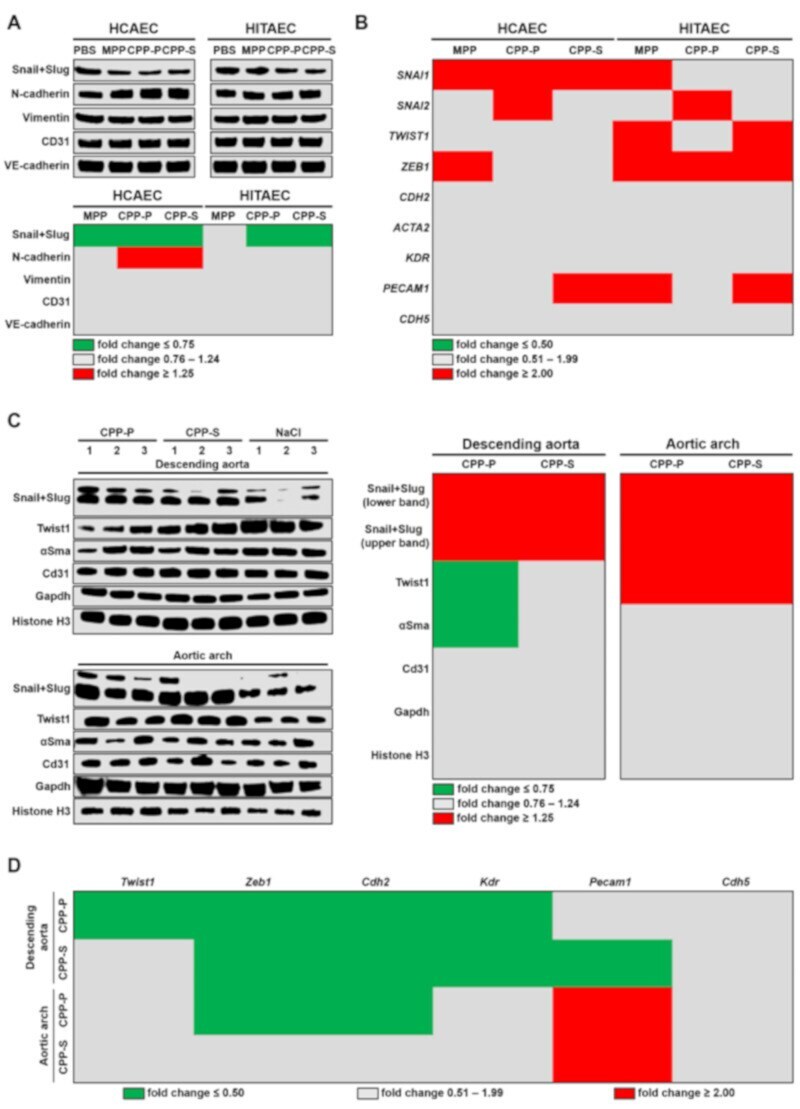
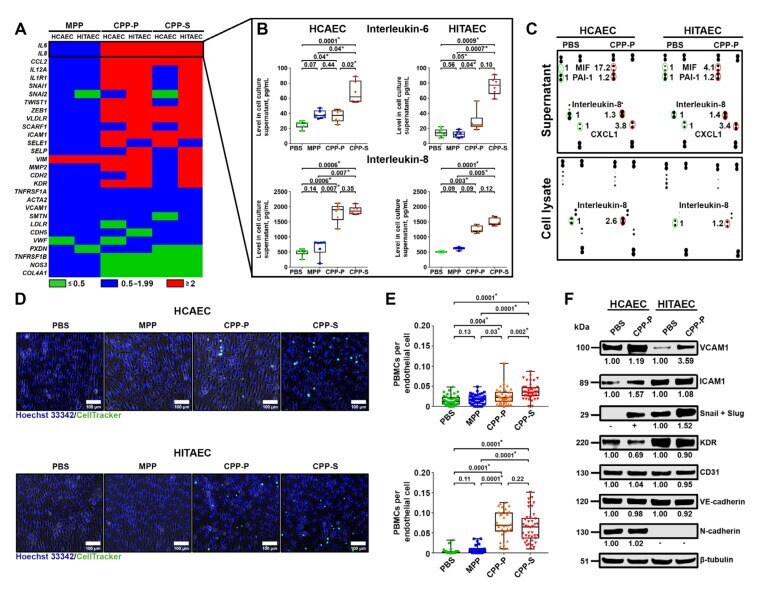
- Figure 3 Co-incubation of ECs, PBMCs and CPPs under flow induces adhesion of PBMCs to the ECs. ( A ) HCAEC and HITAEC were exposed to CPPs circulating in the flow culture system for 4 h with the co-incubation with CellTracker Green-labeled PBMCs during the last hour. Phase contrast visualisation coupled with Hoechst 33342 (ECs and PBMCs, blue colour) and CellTracker Green (PBMCs, green colour) staining, representative images, x200 magnification. Note the frequent adhesion of PBMCs to the CPP-P or CPP-S-treated ECs; ( B ) quantification of PBMCs attached to the ECs from the experiment in ( A ), each dot represents one field of view (40 fields of view in total, 20 per flow culture chamber, 2 flow culture chambers per group). Whiskers indicate range, boxes bounds indicate 25th-75th percentiles, center lines indicate median. p values provided above boxes, Kruskal-Wallis test with post hoc false discovery rate correction by two-stage linear step-up procedure of Benjamini, Krieger and Yekutieli; ( C ) Western blotting measurements of cell adhesion molecules VCAM1 and ICAM1 as compared to the expression of three EC housekeeping proteins (vimentin, CD31 and VE-cadherin) in HCAEC and HITAEC co-incubated with PBS, MPP, CPP-P or CPP-S in a flow system for 4 h. Blot scans (top) and band densitometry analysis (bottom). The results of the latter are represented by a heat map. Green, gray and red colours mean fold change =1.25, respectively, compared to PBS group; (
- Submitted by
- Invitrogen Antibodies (provider)
- Main image
- Experimental details
- Figure 4 Systemic treatment with CPPs probably provokes EndoMT in rat endothelium. ( A ) Western blotting measurements of EndoMT transcription factors Snail and Slug and EndoMT marker N-cadherin as compared to the expression of vimentin, CD31 and VE-cadherin in HCAEC and HITAEC co-incubated with PBS, MPP, CPP-P or CPP-S in a flow system for 4 h. Blot scans (top) and band densitometry analysis (bottom). The results of the latter are represented by a heat map. Green, gray and red colours mean fold change =1.25, respectively, compared to PBS group; ( B ) gene expression analysis of SNAI1 , SNAI2 , TWIST1 , ZEB1 , CDH2 , ACTA2 , KDR , PECAM1 and CDH5 genes in HCAEC and HITAEC co-incubated with PBS, MPP, CPP-P or CPP-S in a flow system for 4 h. RT-qPCR measurements, the results are represented by a heat map. Green, gray and red colours mean fold change =2.00, respectively, compared to PBS group; ( C ) Western blotting measurements of EndoMT transcription factors Snail, Slug and Twist1 and alpha-smooth muscle actin as compared to the expression of Cd31, Gapdh and histone H3 in the endothelial lysate collected from the descending aorta and aortic arch of Wistar rats which received consecutive tail vein injections of CPP-P, CPP-S or 0.9% NaCl (10 daily injections). Blot scans (left) and band densitometry analysis (right). The results of the latter are represented by a heat map. Green, gray and red colours mean fold change
- Submitted by
- Invitrogen Antibodies (provider)
- Main image
- Experimental details
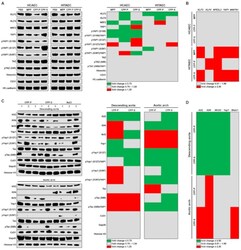
- Figure 5 CPPs may impair endothelial mechanotransduction. ( A ) Western blotting measurements of mechanosensitive transcription factors KLF2, KLF4, NRF2, YAP1 and TAZ and phosphorylated forms of YAP1 and TAZ as compared to the expression of vimentin, CD31 and VE-cadherin in HCAEC and HITAEC co-incubated with PBS, MPP, CPP-P or CPP-S in a flow system for 4 h. Blot scans (left) and band densitometry analysis (right). The results of the latter are represented by a heat map. Green, gray and red colours mean fold change =1.25, respectively, compared to PBS group; ( B ) gene expression analysis of KLF2 , KLF4 , NFE2L2 , YAP1 , and WWTR1 genes in HCAEC and HITAEC co-incubated with PBS, MPP, CPP-P or CPP-S in a flow system for 4 h. RT-qPCR measurements, the results are represented by a heat map. Gray and red colours mean fold change 0.51-1.99, and >=2.00, respectively, compared to PBS group; ( C ) Western blotting measurements of mechanosensitive transcription factors Klf2, Klf4, Nrf2, Yap1, Taz and phosphorylated forms of Yap1 and Taz as compared to the expression of Cd31, Gapdh and histone H3 in the endothelial lysate collected from the descending aorta and aortic arch of Wistar rats which received consecutive tail vein injections of CPP-P, CPP-S or 0.9% NaCl (10 daily injections). Blot scans (left) and band densitometry analysis (right). The results of the latter are represented by a heat map. Green, gray and red colours mean fold change

- Submitted by
- Invitrogen Antibodies (provider)
- Main image
- Experimental details
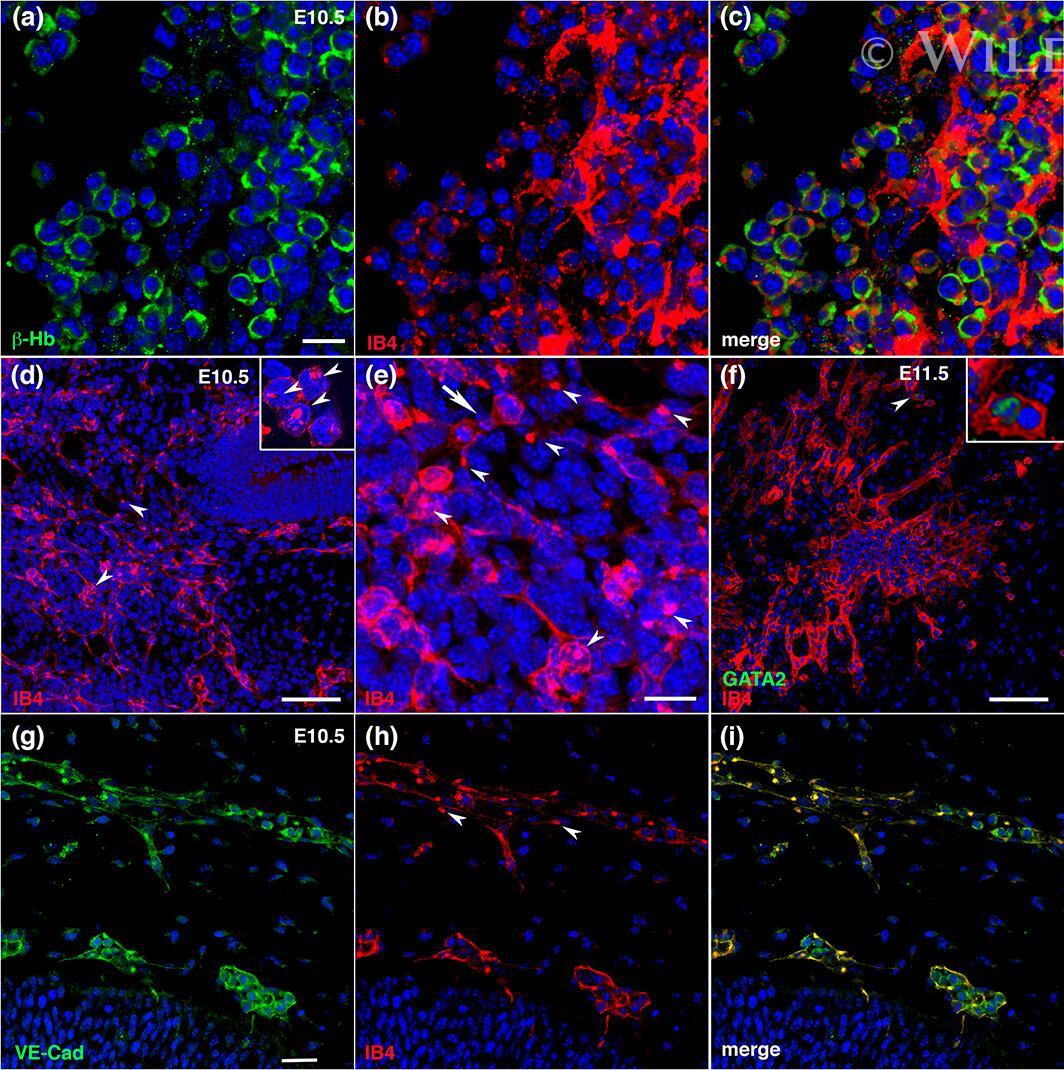
- 7 FIGURE Formation of the cephalic vascular plexus. (a-c) E10.5, primitive beta-Hb erythroid cells (a, green) within blood islands in the cephalic mesenchyme (CM) showed upregulated IB4+ staining (b, red) and were condensed within an IB4+ extracellular cell matrix, (c) the merged image of (a) and (b). (d,e) Formation of an IB4+ angioblast network in the CM adjacent to the neuroepithelium lining the fourth ventricle. Free IB4+ cells (inset in d) proliferated and formed a primordial vascular plexus. Arrowheads in (d,e) indicate the characteristic intracellular dense inclusion of IB4+ staining in angioblasts that stained strongly for this lectin. Arrow in (e) indicates an IB4+ angioblast undergoing mitosis. (f) E11.5, formation of the IB4+ cephalic vascular plexus (red). Inset shows a rare GATA2+ cell (green) in the developing cephalic plexus. (g-i) E10.5, vascular formation in the CM by IB4+ angioblasts. Staining with antibodies against VE-cadherin (VE-Cad, g, green) and IB4 (h, red) and merged image (i). Arrowheads in (h) indicate the intense IB4+ inclusion within the cells lining this vessel. DAPI, blue. Scale bars, 20 mum for (a-c) and (e), and 100 mum for (d) and (f)
- Submitted by
- Invitrogen Antibodies (provider)
- Main image
- Experimental details
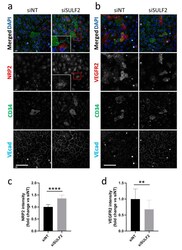
- Figure 4 Changes in protein levels of NRP2 and VEGFR2 after SULF2 knockdown. HUVECs were transfected with si SULF2 or siNT as a control, seeded on coverslips and cultured for three days. After 2% PFA fixation, cells were stained with antibodies against ( a ) NRP2 or ( b ) VEGFR2 (red), CD34 (green), or VEcad (cyan) and with DAPI (blue). Representative images are shown for experiments on HUVECs of three donors. A 2.5-fold magnification of the area in the red box is presented. Scale bar = 50 um. Quantification of NRP2 ( c ) and VEGFR2 ( d ) is shown below, relative to siNT with mean +- SD. ** p < 0.01, **** p < 0.0001.
- Submitted by
- Invitrogen Antibodies (provider)
- Main image
- Experimental details
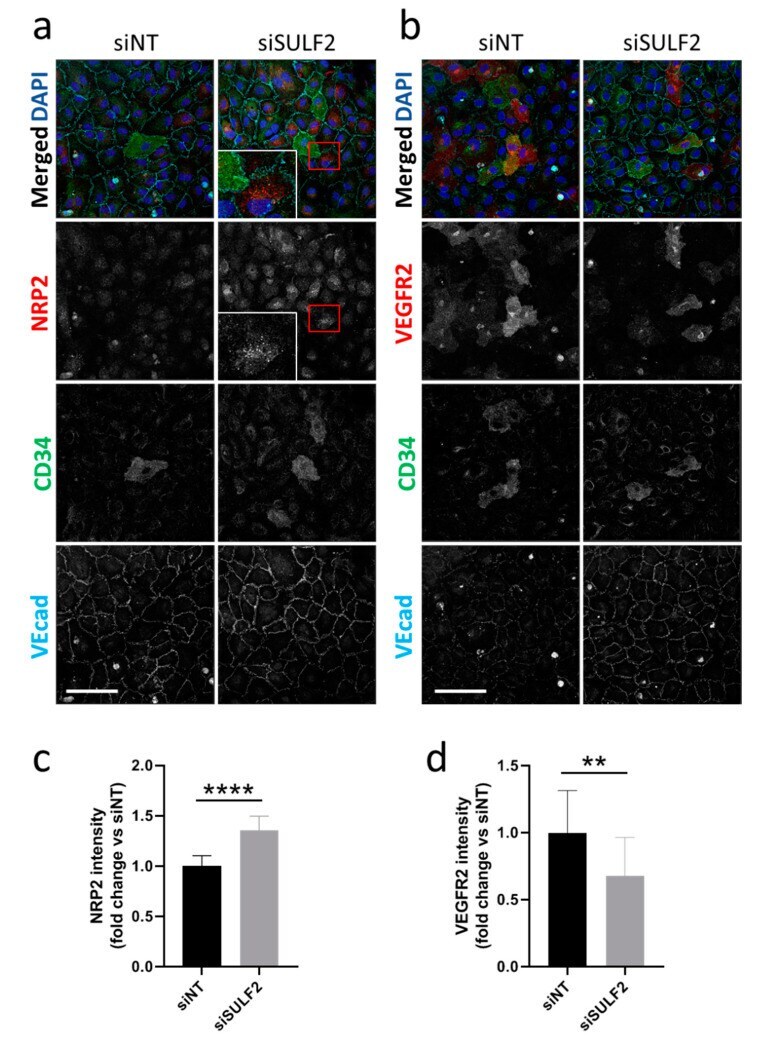
- FIGURE 1 rA2 administration reduces BBB leakage after TBI in mice. (A) Dose-range (0.75, 1.0, and 1.5 mg/kg) effects of rA2 administration treated at 2 h in BBB permeability examined at 24 h after TBI. (B) The therapeutic time window of rA2 administration in BBB permeability reduction examined at 24 h after TBI, treated at 2 h, or 4 h, or 6 h after TBI, respectively. Data are expressed as mean +- SEM, n = 8 mice per group, * p < 0.05 vs. BSA treated ipsilateral hemisphere. (C) Representative gel images of western blotting and quantitative analysis for ZO-1, VE-Cadherin, Occludin, Claudin-5 expression in the ipsilateral hemispheres collected at 24 h after TBI. beta-actin was used as the equal loading control. Data are expressed as mean +- SEM, n = 4 mice per group, * p < 0.05 vs. Sham, # p < 0.05 vs. TBI+vehicle (1 mg/kg BSA).

- Submitted by
- Invitrogen Antibodies (provider)
- Main image
- Experimental details
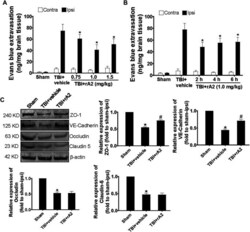
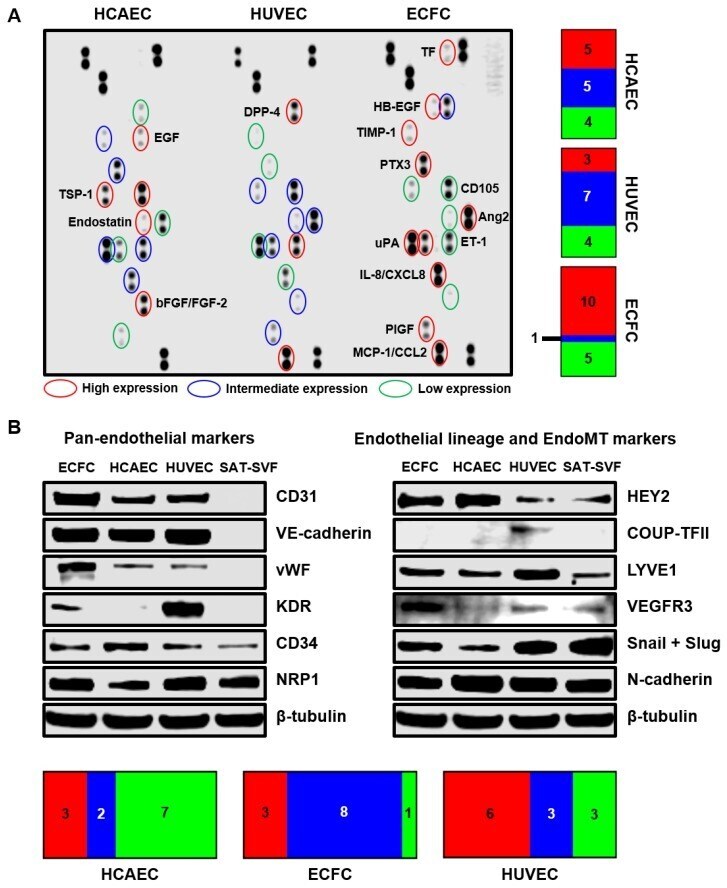
- Figure 9 Proteomic profiling for ECFC, HCAEC and HUVEC. ( A ) Dot blot profiling for 55 angiogenesis-related proteins confirms high similarity between ECFC and mature vascular EC yet also indicates minor differences between these cell lines and generally validating RNA-seq results. Count to the right represents a quantitation of measured angiogenesis-related proteins in terms of their relative expression in HCAEC, HUVEC, and ECFC; ( B ) Western blotting for endothelial phenotype-related markers verifies endothelial identity of PBMC-derived ECFC and demonstrates an intermediate phenotype of PBMC-derived ECFC as compared to HCAEC and HUVEC in terms of HEY2, LYVE1, VEGFR3, Snail and Slug expression. beta-tubulin was probed as a loading control. Count to the bottom represents a quantitation of measured endothelial phenotype-related markers in terms of their relative expression in HCAEC, HUVEC, and ECFC.
- Submitted by
- Invitrogen Antibodies (provider)
- Main image
- Experimental details
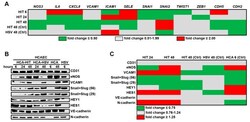
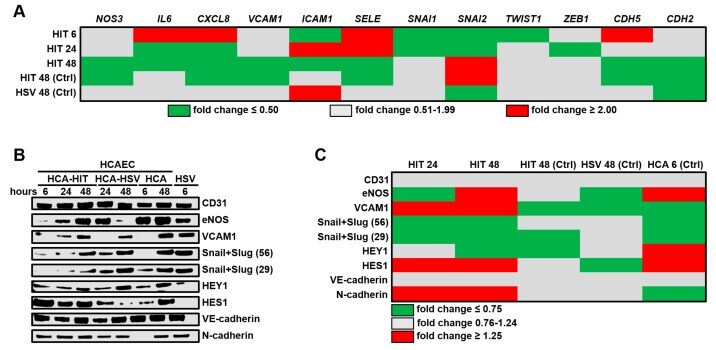
- Figure 1 Profiling of key endothelial molecules in human coronary artery endothelial cells (HCAECs) co-cultured with either human internal thoracic artery endothelial cells (HITAECs) (HIT) or human saphenous vein endothelial cells (HSaVECs) (HSVs) for 6, 24, or 48 h. ( A ) RT-qPCR profiling, HIT signifies the ratio of transcript levels (measured as DeltaCt) in HCAECs co-cultured with HITAECs to those in HCAECs co-cultured with HSaVECs. HIT (Ctrl) and HSV (Ctrl) represent the ratios of transcript levels (measured as DeltaCt) in HCAECs co-cultured with HITAECs or HSaVECs to those in HCAEC monoculture. Results are represented as the heat map; green, gray, and red colours indicate fold change =2.00, respectively; ( B ) Western blotting measurements. HCA-HIT represents HCAECs co-cultured with HITAECs, HCA-HSV signifies HCAECs co-cultured with HSaVECs. HCA and HSV signify HCAEC and HSaVEC monocultures, respectively; ( C ) Semi-quantitative analysis of Western blotting results by densitometry. HIT represents the ratio of band density in HCAECs co-cultured with HITAECs to that in HCAECs co-cultured with HSaVECs. HIT (Ctrl) and HSV (Ctrl) abbreviate the ratios of band density in HCAECs co-cultured with HITAECs or HSaVECs to that in HCAEC monoculture. HCA (Ctrl) abbreviates the ratio of band density in HCAEC monoculture to that in HSaVEC monoculture. Snail + Slug are shown at both 56 and 29 kDa values. Results are represented as green, gray, and red colours on t
- Submitted by
- Invitrogen Antibodies (provider)
- Main image
- Experimental details
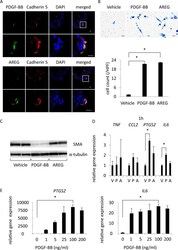
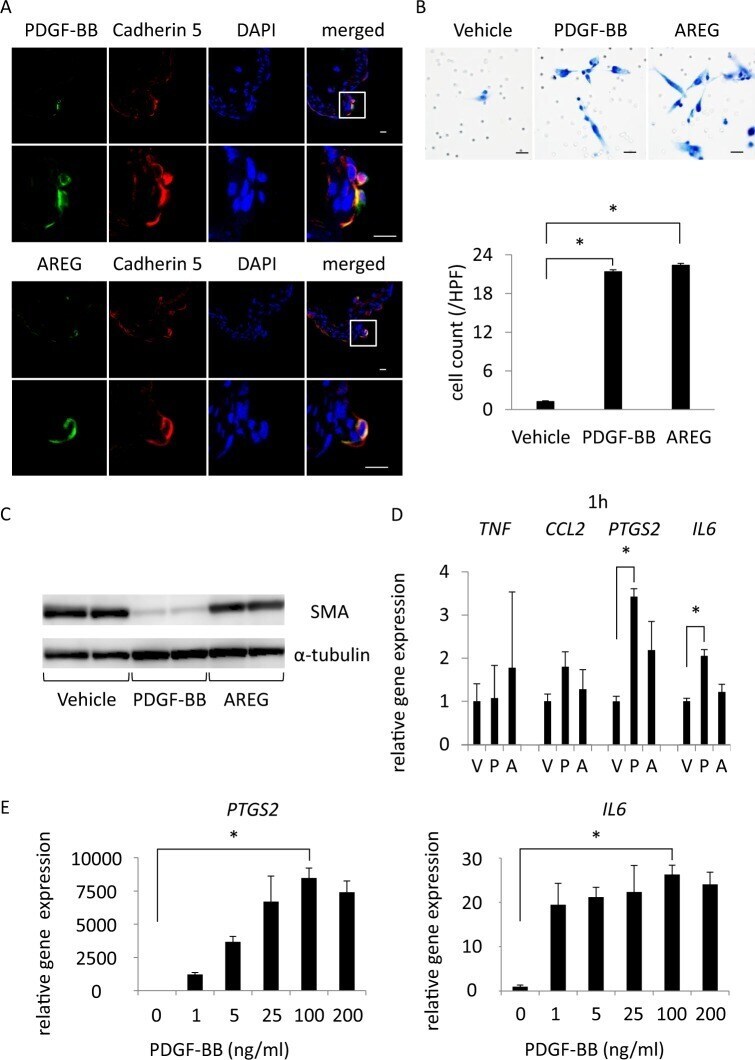
- Figure 4 PDGF-BB as a factor for smooth muscle cells to migrate, dedifferentiate and express pro-inflammatory genes. ( A ) Expression of PDGF-BB or Amphiregulin (AREG) in endothelial cells of intracranial aneurysm (IA) lesions. On the 14 th day after IA induction, IA lesions at the right anterior cerebral-olfactory artery bifurcation were harvested and subjected to the immunohistochemical analyses. The representative images of immunohistochemistry for PDGF-BB or AREG (green), Cadherin 5, a marker for endothelial cells, (red), nuclear staining by DAPI (blue) and merged images are shown. The magnified images corresponding to the square in the upper panels are shown in the lower panels. Bars, 10 um. ( B ) Chemotactic activity of PDGF-BB or AREG on smooth muscle cells (SMCs). The migration of primary culture of SMCs across matrigel-coated pores via 100 ng/ml PGDF-BB or 100 ng/ml AREG was assessed by a transwell system. The representative images of SMCs migrated are shown. Bars, 10 um. The number of migrated cells is shown in the lower graph. Data represents the mean +- SEM (n = 4). Statistical analysis was done by a Kruskal-Wallis test. *p < 0.05. ( C ) Dedifferentiation of SMCs by PDGF-BB. Primary culture of SMCs were stimulated with 100 ng/ml PGDF-BB or 100 ng/ml AREG for 72 h and expression of SMA was assessed by western blot analysis using alpha-tubulin as an internal control. The representative images are shown. ( D,E ) Induction of PTGS2 (COX-2) or IL6 by PDGF-BB in culture
- Submitted by
- Invitrogen Antibodies (provider)
- Main image
- Experimental details
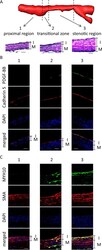
- Figure 5 Induction of PDGF-BB and MYH10 in the transitional and the stenotic regions. ( A ) The intimal hyperplasia induced in a stenosis model. The three-dimensional reconstructed image of MRI of a stenosis model and images of elastic van gieson staining (EvG) corresponding to the proximal, the transitional or the stenotic region are shown. I or M indicates the intima or the media, respectively. Bars, 20 um. ( B , C ) Induction of PDGF-BB or MYH10 in the transitional and the stenotic region of a stenosis model. On the 30 th day after surgical manipulations to induce stenosis at the left common carotid artery (CCA), the left CCA were harvested and subjected to the immunohistochemical analyses. The representative images of immunohistochemistry for PDGF-BB (green in B ), MYH10 (green in C ), Cadherin 5, a marker for endothelial cells, (red in B ), smooth muscle alpha-actin (SMA), a marker for smooth muscle cells, (red in C ), nuclear staining by DAPI (blue) and merged images are shown. 1, 2 or 3 indicates the proximal region, the transitional zone or the stenotic region, respectively. Bars, 20 um.
- Submitted by
- Invitrogen Antibodies (provider)
- Main image
- Experimental details
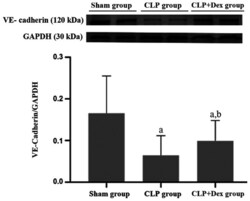
- Figure 4 Dex alleviates the CLP-induced decrease in VE-cadherin protein expression. Protein samples of the rat middle lobe of right lung tissue from the sham, CLP and Dex + CLP groups were analyzed by western blotting with VE-cadherin antibody. GAPDH was used as a protein loading reference. The expression level of the protein was estimated by densitometry. The data are from three independent assays. a P

- Submitted by
- Invitrogen Antibodies (provider)
- Main image
- Experimental details
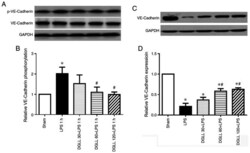
- Figure 4 Effect of DGLL on phosphorylation and expression of the adhesion junction protein VE-Cadherin caused by LPS in rat lung tissues. (A) Representative western blotting image and (B) corresponding quantitative analysis of phosphorylated-VE-Cadherin and VE-Cadherin in rat lung tissues 1 h after LPS stimulation. (C) Representative western blotting image and (D) corresponding quantitative analysis of VE-Cadherin in rat lung tissue 6 h after LPS stimulation. All data are expressed as the mean +- SEM. * P

- Submitted by
- Invitrogen Antibodies (provider)
- Main image

- Experimental details
- Figure 8 CPPs induce endothelial activation and endothelial-to-mesenchymal transition. ( A ) HCAECs and HITAECs were cultured in the presence of PBS, MPPs, CPP-P, or CPP-S (100 muL of particles per well of a 6-well plate, OD 650 = 0.08-0.10, for CPP-P and CPP-S: equal to 50 mug calcium or 1.2 x 10 5 OsteoSense 680EX-positive PKH67-negative events) for 4 h, and total RNA was extracted with the following expression profiling for the indicated genes (n = 3 wells per group). Heat map shows differentially expressed genes (fold change > 2) between groups. ( B ) HCAECs and HITAECs were cultured in the presence of PBS, MPPs, CPP-P, or CPP-S (100 muL of particles per well of a 6-well plate, OD 650 = 0.08-0.10, for CPP-P and CPP-S: equal to 50 mug calcium or 1.2 x 10 5 OsteoSense 680EX-positive PKH67-negative events) for 4 h. Conditioned media were profiled for interleukin-6 and -8 using an enzyme-linked immunosorbent assay (n = 6 wells per group). Each dot represents one well of the culture plate. Whiskers indicate the range, box bounds indicate the 25th-75th percentiles, and centre lines indicate the median. p -values are provided above the boxes (statistically significant differences are marked by asterisks), Kruskal-Wallis test with post hoc false discovery rate correction by the two-stage linear step-up procedure of Benjamini, Krieger, and Yekutieli. ( C ) Conditioned media and cell lysate from HCAECs and HITAECs from the experiment in ( B ) were profiled using a cytokine array. N
- Submitted by
- Invitrogen Antibodies (provider)
- Main image
- Experimental details
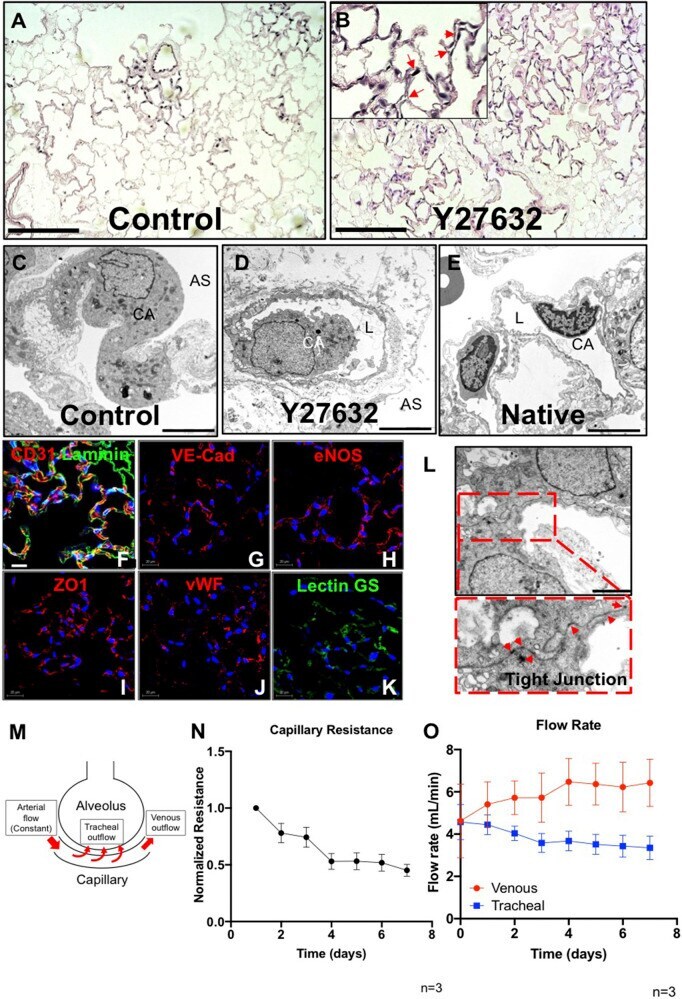
- FIGURE 2 Characterization of PMEC-repopulated lungs. (A,B) H/E image of a representative section in control (A) and Y27632-treated repopulated lungs (B) . Scale bars 150 mum, arrows point to reconstituted capillary lumens. (C,D,E) TEM images of control, Y27632-treated repopulated lungs, and native lungs, respectively. Scale bars 5 mum, CA: Capillary; AS: Alveolar Space; L: Lumen. (F-K) Immunostaining for CD31, VE-Cad, eNOS, ZO1, vWF, and lectin GS in repopulated lungs, scale bar 20 mum. (L) Representative TEM image of tight junctions in repopulated lungs. Arrowheads indicate tight junctions, scale bar 2 mum. (M) Schematic description of the flow paths in decellularized lung vasculature. (N,O) Non-invasive measurements were performed daily to assess the mechanical characteristics in repopulated lungs. (N) Capillary resistances to fluid flow within the vascular bed, versus time. (O) Flow rates: venous (red), and tracheal (blue) outflows versus time. ""n"" indicates experimental replicates. There were three independent experiments performed for each condition.
- Submitted by
- Invitrogen Antibodies (provider)
- Main image
- Experimental details
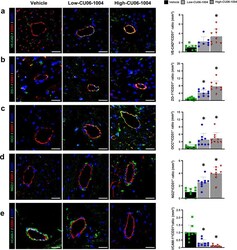
- Fig. 2 CU06-1004 protects the integrity of CMECs in I/R injury. a - c Representative images of CMEC junctions, stained for junction proteins such as ( a ) VE-CAD, ( b ) ZO-1, and ( c ) OCC, in the infarct zone and a summary of their quantification. VE-CAD, ZO-1, and OCC (green), CD31 (red), DAPI (blue). n = 7-9. * P < 0.05 vs. vehicle. Scale bars: 100 um. d Representative images of pericytes enveloping CMECs in the infarct zone and a summary of their quantification. NG2 (green), CD31 (red), and DAPI (blue). n = 9. * P < 0.05 vs. vehicle. Scale bars: 100 um. e Representative images of VCAM-1 related to inflammation in the infarct zone and a summary of their quantification. VCAM-1 (green), CD31 (red), and DAPI (blue). n = 9. * P < 0.05 vs. vehicle. Scale bars: 100 um. Data are shown as the mean +- SEM.
- Submitted by
- Invitrogen Antibodies (provider)
- Main image

- Experimental details
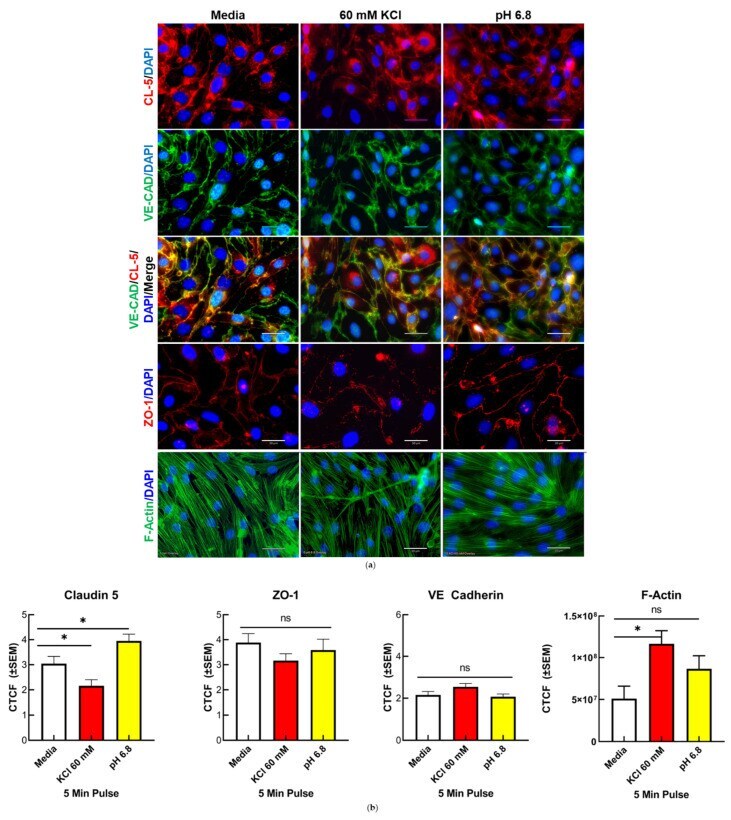
- Localization of endothelial TJ associated proteins and visualization of F-actin fibers following KCl and acidified pH treatment in vitro. ( a ) Representative immunofluorescence images of b.End3 endothelial cells post 60 mM KCl and acidified pH treatment for CL-5, VE-CAD, ZO-1, and F-Actin, scale bar represents 30 mum ( b ) Quantification of CL-5, ZO-1, VE-CAD, and F-Actin by corrected total cell fluorescence (CTCF). CL-5, but not ZO-1 or VE-CAD, demonstrated significant changes to total signal following KCl and acidified pH treatment, while F-actin was increased following KCl insult. CL-5: media vs. 60 mM KCl: mean rank difference = 25.20, Z = 2.107, * p = 0.0351, n1 = 34, n2 = 43: media vs. pH = 6.8: mean rank difference = -21.48, Z = 1.942, * p = 0.0521, n1 = 34, n2 = 64; Kruskal-Wallis statistic: 36.25: ZO-1: media vs. 60 mM KCl: mean rank difference = 12.77, Z = 1.319, p = 0.1872, n1 = 25, n2 = 33; media vs. pH = 6.8: mean rank difference = 9.352, Z = 0.9384, p = 0.3481, n1 = 25, n2 = 29; 6.382; Kruskal-Wallis statistic: 6.382, p summary: 0.0945. VE-CAD: media vs. 60 mM KCl: mean rank difference = -16.30, Z = 1.312, p = 0.1894, n1 = 29, n2 = 46: media vs. pH 6.8: mean rank difference = 5.375, Z = 0.4411, p = 0.6592, n1 = 29, n2 = 51, ns = no significance, Kruskal-Wallis statistic: 10.12, * p summary: 0.0175. Analyzed by Kruskal-Wallis test with post hoc uncorrected Dunn's test. F-actin: media vs. pH 6.8: mean difference = -35,648,452, 95% CI (-98,074,135, 26,777,231), n1
- Submitted by
- Invitrogen Antibodies (provider)
- Main image
- Experimental details
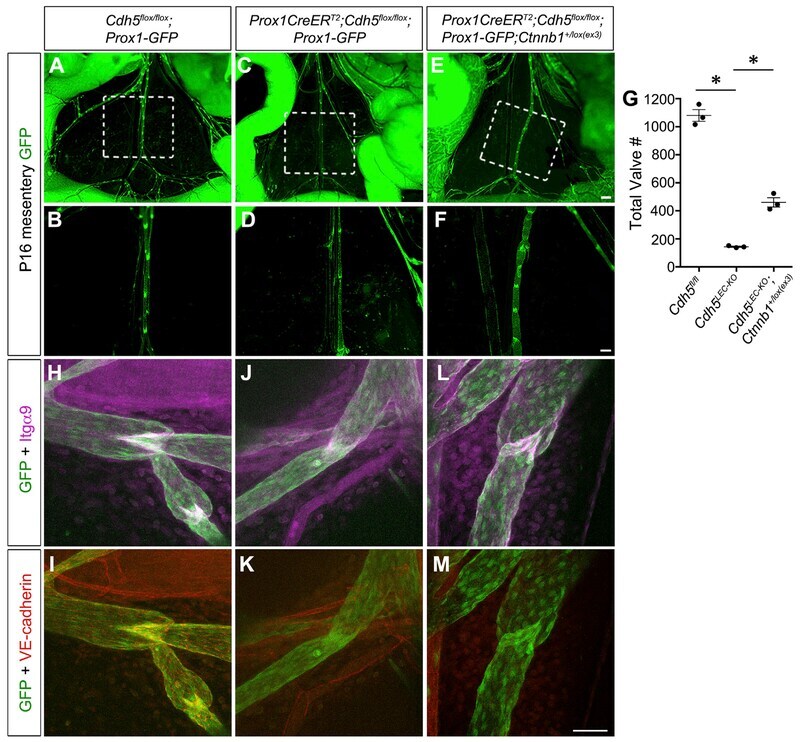
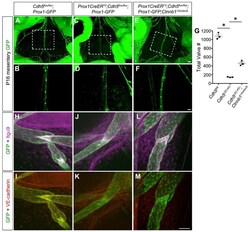
- Figure 6. Constitutively Active beta-Catenin Signaling Partially Rescues Valve Regression in the Absence of VE-Cadherin (A-F) Direct fluorescence imaging of Prox1-GFP (green) of freshly dissected mesenteries from P16 Cdh5 fl/fl , VE-cadherin LEC-KO , and VE-cadherin LEC-KO ;Ctnnb1 +/lox(ex3) pups at low (A, C, and E) and high (B, D, and F) magnification. (G) Quantification of the total number of valves in the mesenteries from each genotype. All values are means +- SEM of n = 3 littermates per genotype. (H-M) Confocal imaging of lymphatic valves stained for Integrin-alpha9, GFP, and VE-cadherin from control (H and I), VE-cadherin LEC-KO (J and K), or rescue conditions(L and M) to show valve morphology. One-way ANOVA with Tukey's post hoc test was performed for multiple comparisons (*p < 0.05). Scale bars are 500 mum in (A), (C), and (E); 200 mum in (B), (D), and(F); and 50 mum in (H)-(M).