 Explore
 Validate
 Learn
Learn Western blot
 Immunocytochemistry
 Immunohistochemistry
Antibody data
- Antibody Data
- Antigen structure
- References [35]
- Comments [0]
- Validations
- Immunocytochemistry [2]
- Other assay [37]
Submit
Validation data
Reference
Comment
Report error
- Product number
- 14-1449-37 - Provider product page

- Provider
- Invitrogen Antibodies
- Product name
- CD144 (VE-cadherin) Monoclonal Antibody (16B1), eBioscience™
- Antibody type
- Monoclonal
- Antigen
- Other
- Description
- Description: The 16B1 antibody reacts with human CD144, also known as VE-cadherin and cadherin-5. The cadherin family of receptors, which are calcium-dependent adhesion molecules, is known to be involved in homophilic cell interactions. VE-cadherin, which is 140 kDa, is localized at the intercellular boundaries of endothelial cells in blood and lymphatic vessels in several tissues. It is thought to play a role in vascular permeability and remodeling. Applications Reported: This 16B1 antibody has been reported for use in flow cytometric analysis, immunoblotting (WB), microscopy, and immunocytochemistry without fixation. Applications Tested: This 16B1 antibody has been tested by immunoblotting Human Umbilical Vein Endothelial Cell (HUVEC) lysates. It is recommended that the antibody be carefully titrated for optimal performance in the assay of interest. Purity: Greater than 90%, as determined by SDS-PAGE. Aggregation: Less than 10%, as determined by HPLC. Filtration: 0.2 µm post-manufacturing filtered.
- Reactivity
- Human
- Host
- Mouse
- Isotype
- IgG
- Antibody clone number
- 16B1
- Vial size
- 2 mg
- Concentration
- 0.5 mg/mL
- Storage
- 4°C
Submitted references Long-term cultured microvascular networks on chip for tumor vascularization research and drug testing.
Vascular remodelling in idiopathic pulmonary fibrosis patients and its detrimental effect on lung physiology: potential role of endothelial-to-mesenchymal transition.
Deciphering the Role of Extracellular Vesicles Derived from ZIKV-Infected hcMEC/D3 Cells on the Blood-Brain Barrier System.
Upregulation of ETV2 Expression Promotes Endothelial Differentiation of Human Dental Pulp Stem Cells.
Lymphatic-specific intracellular modulation of receptor tyrosine kinase signaling improves lymphatic growth and function.
Endothelial specific YY1 deletion restricts tumor angiogenesis and tumor growth.
Targeting QKI-7 in vivo restores endothelial cell function in diabetes.
Human Cardiac Organoids for Modeling Genetic Cardiomyopathy.
Isolating pulmonary microvascular endothelial cells ex vivo: Implications for pulmonary arterial hypertension, and a caution on the use of commercial biomaterials.
Angiogenic and Restorative Abilities of Human Mesenchymal Stem Cells Were Reduced Following Treatment With Serum From Diabetes Mellitus Type 2 Patients.
Challenges in enumeration of CTCs in breast cancer using techniques independent of cytokeratin expression.
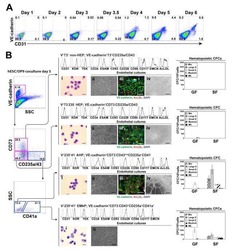
Targeted Disruption of TCF12 Reveals HEB as Essential in Human Mesodermal Specification and Hematopoiesis.
Enhanced Therapeutic and Long-Term Dynamic Vascularization Effects of Human Pluripotent Stem Cell-Derived Endothelial Cells Encapsulated in a Nanomatrix Gel.
MMP-2 and MMP-14 Silencing Inhibits VEGFR2 Cleavage and Induces the Differentiation of Porcine Adipose-Derived Mesenchymal Stem Cells to Endothelial Cells.
ERK signaling is required for VEGF-A/VEGFR2-induced differentiation of porcine adipose-derived mesenchymal stem cells into endothelial cells.
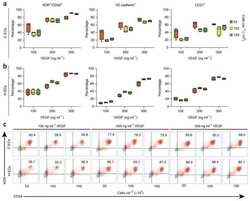
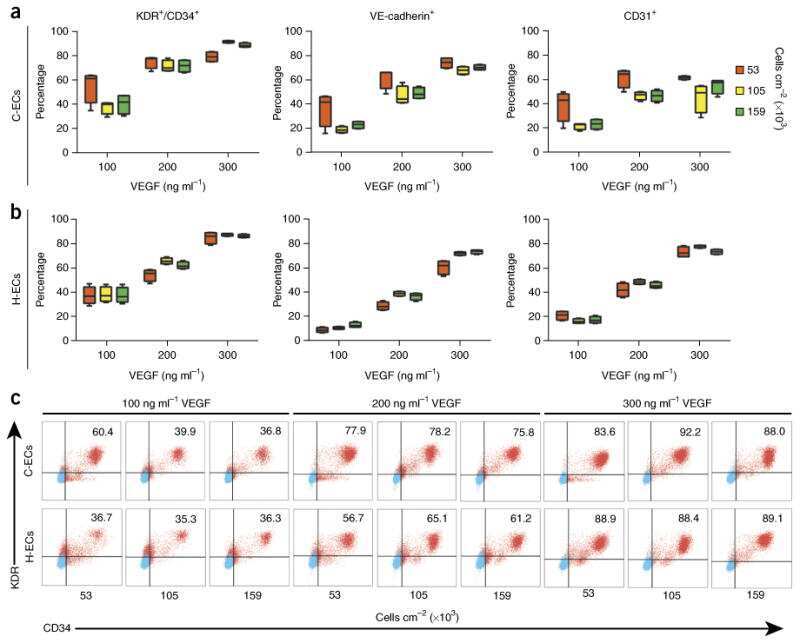
Generating high-purity cardiac and endothelial derivatives from patterned mesoderm using human pluripotent stem cells.
Mitochondria-Targeted Antioxidant SkQR1 Reduces TNF-Induced Endothelial Permeability in vitro.
Vasculogenic mimicry in small cell lung cancer.
Definitive Hematopoietic Multipotent Progenitor Cells Are Transiently Generated From Hemogenic Endothelial Cells in Human Pluripotent Stem Cells.
Tumourigenic non-small-cell lung cancer mesenchymal circulating tumour cells: a clinical case study.
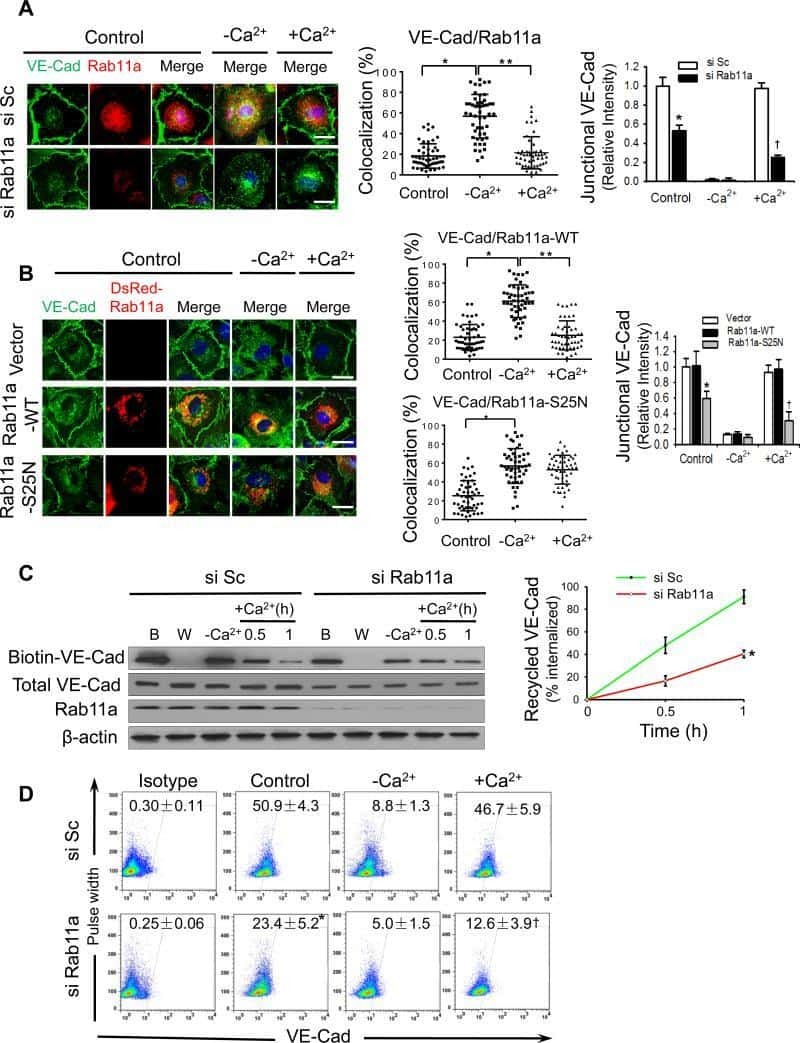
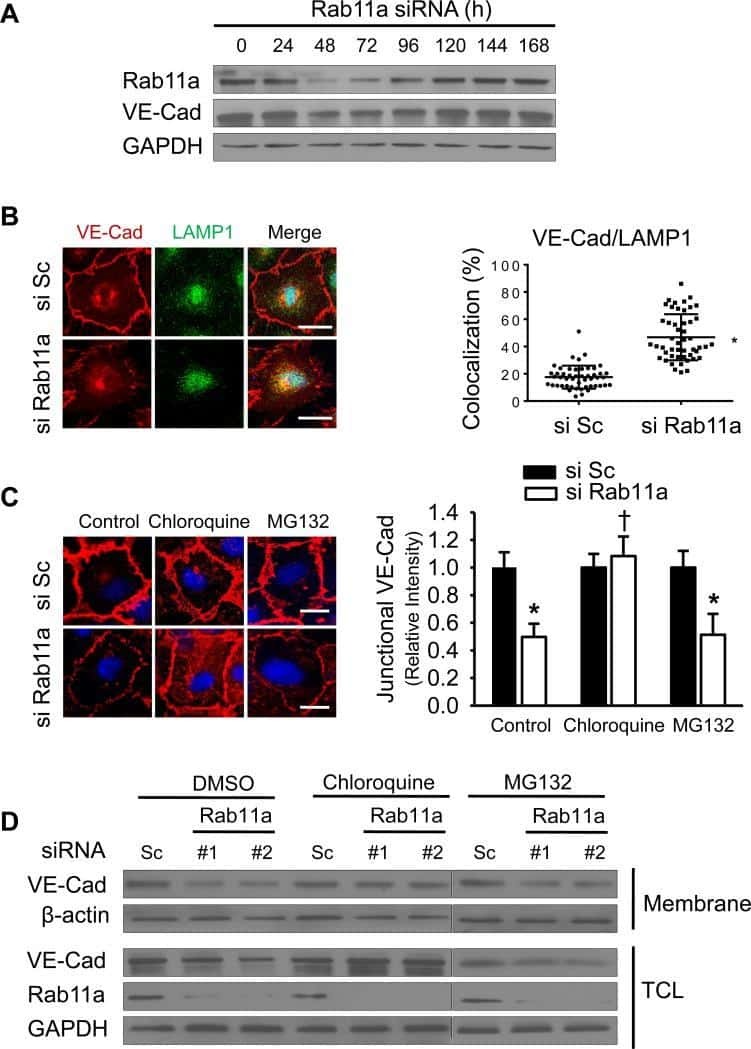
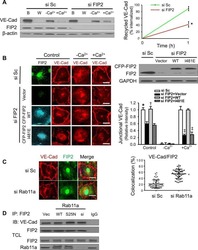
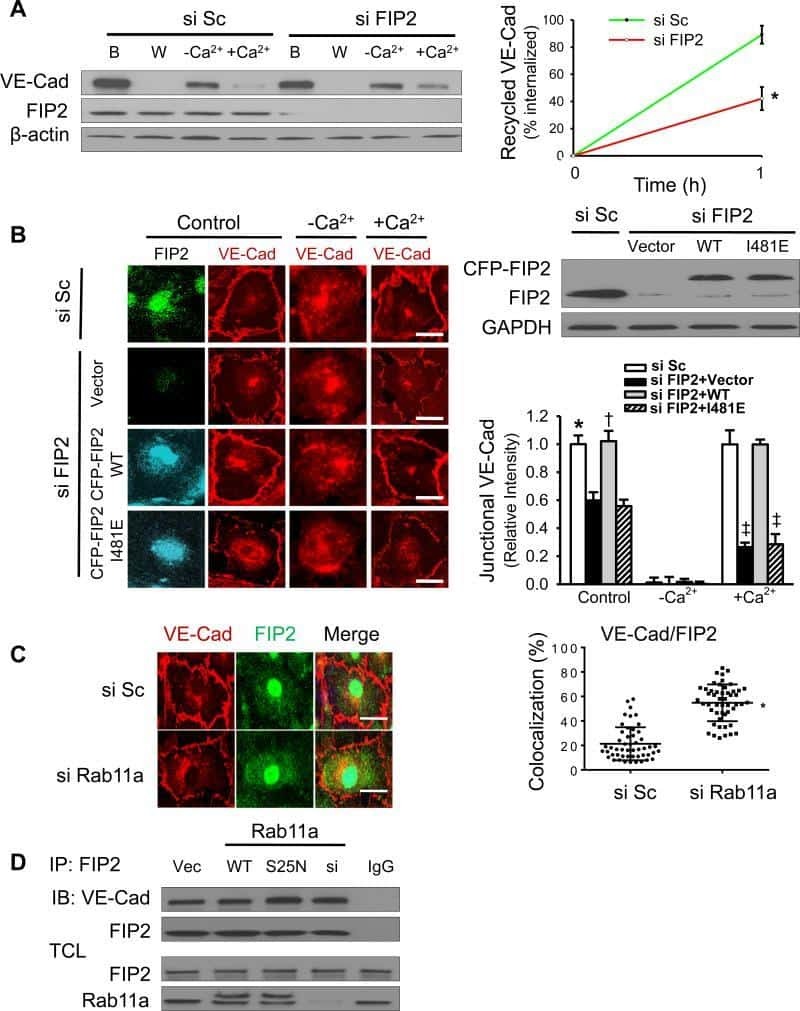
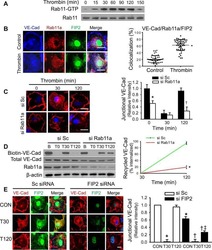
Rab11a Mediates Vascular Endothelial-Cadherin Recycling and Controls Endothelial Barrier Function.
Fc gamma receptor IIb participates in maternal IgG trafficking of human placental endothelial cells.
Histone Demethylases KDM4A and KDM4C Regulate Differentiation of Embryonic Stem Cells to Endothelial Cells.
Mesenchymal stromal cells form vascular tubes when placed in fibrin sealant and accelerate wound healing in vivo.
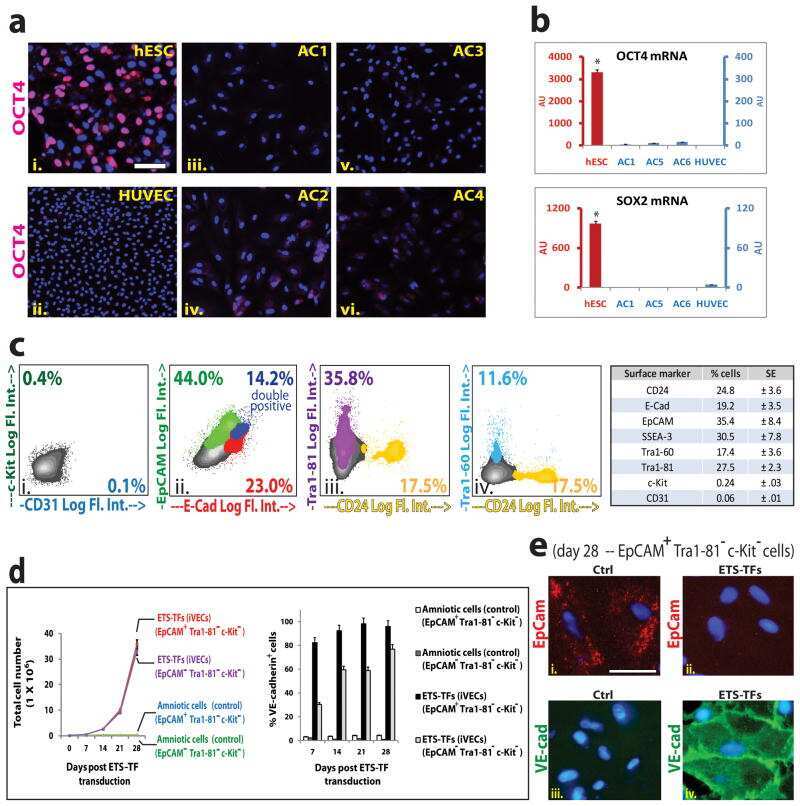
Direct conversion of human amniotic cells into endothelial cells without transitioning through a pluripotent state.
Induced Pluripotent Stem Cells to Model Human Fibrodysplasia Ossificans Progressiva.
MicroRNA-16 affects key functions of human endothelial progenitor cells.
PDGFRα and CD51 mark human nestin+ sphere-forming mesenchymal stem cells capable of hematopoietic progenitor cell expansion.
Neovascular niche for human myeloma cells in immunodeficient mouse bone.
Identification of the hemogenic endothelial progenitor and its direct precursor in human pluripotent stem cell differentiation cultures.
Efficient direct reprogramming of mature amniotic cells into endothelial cells by ETS factors and TGFβ suppression.
Identification of endothelial cell junctional proteins and lymphocyte receptors involved in transendothelial migration of human effector memory CD4+ T cells.
High harvest yield, high expansion, and phenotype stability of CD146 mesenchymal stromal cells from whole primitive human umbilical cord tissue.
Perioculomotor cell groups in monkey and man defined by their histochemical and functional properties: reappraisal of the Edinger-Westphal nucleus.
Differential requirements for hematopoietic commitment between human and rhesus embryonic stem cells.
Zhang K, Du Z, Yuan T, Huang J, Zhao X, Mi S
Biomicrofluidics 2022 Jul;16(4):044101
Biomicrofluidics 2022 Jul;16(4):044101
Vascular remodelling in idiopathic pulmonary fibrosis patients and its detrimental effect on lung physiology: potential role of endothelial-to-mesenchymal transition.
Gaikwad AV, Lu W, Dey S, Bhattarai P, Chia C, Larby J, Haug G, Myers S, Jaffar J, Westall G, Singhera GK, Hackett TL, Markos J, Eapen MS, Sohal SS
ERJ open research 2022 Jan;8(1)
ERJ open research 2022 Jan;8(1)
Deciphering the Role of Extracellular Vesicles Derived from ZIKV-Infected hcMEC/D3 Cells on the Blood-Brain Barrier System.
Fikatas A, Dehairs J, Noppen S, Doijen J, Vanderhoydonc F, Meyen E, Swinnen JV, Pannecouque C, Schols D
Viruses 2021 Nov 25;13(12)
Viruses 2021 Nov 25;13(12)
Upregulation of ETV2 Expression Promotes Endothelial Differentiation of Human Dental Pulp Stem Cells.
Li J, Zhu Y, Li N, Wu T, Zheng X, Heng BC, Zou D, Xu J
Cell transplantation 2021 Jan-Dec;30:963689720978739
Cell transplantation 2021 Jan-Dec;30:963689720978739
Lymphatic-specific intracellular modulation of receptor tyrosine kinase signaling improves lymphatic growth and function.
Kataru RP, Baik JE, Park HJ, Ly CL, Shin J, Schwartz N, Lu TT, Ortega S, Mehrara BJ
Science signaling 2021 Aug 10;14(695)
Science signaling 2021 Aug 10;14(695)
Endothelial specific YY1 deletion restricts tumor angiogenesis and tumor growth.
Liu H, Qiu Y, Pei X, Chitteti R, Steiner R, Zhang S, Jin ZG
Scientific reports 2020 Nov 24;10(1):20493
Scientific reports 2020 Nov 24;10(1):20493
Targeting QKI-7 in vivo restores endothelial cell function in diabetes.
Yang C, Eleftheriadou M, Kelaini S, Morrison T, González MV, Caines R, Edwards N, Yacoub A, Edgar K, Moez A, Ivetic A, Zampetaki A, Zeng L, Wilkinson FL, Lois N, Stitt AW, Grieve DJ, Margariti A
Nature communications 2020 Jul 30;11(1):3812
Nature communications 2020 Jul 30;11(1):3812
Human Cardiac Organoids for Modeling Genetic Cardiomyopathy.
Filippo Buono M, von Boehmer L, Strang J, Hoerstrup SP, Emmert MY, Nugraha B
Cells 2020 Jul 20;9(7)
Cells 2020 Jul 20;9(7)
Isolating pulmonary microvascular endothelial cells ex vivo: Implications for pulmonary arterial hypertension, and a caution on the use of commercial biomaterials.
Wertheim BM, Lin YD, Zhang YY, Samokhin AO, Alba GA, Arons E, Yu PB, Maron BA
PloS one 2019;14(2):e0211909
PloS one 2019;14(2):e0211909
Angiogenic and Restorative Abilities of Human Mesenchymal Stem Cells Were Reduced Following Treatment With Serum From Diabetes Mellitus Type 2 Patients.
Rezaie J, Mehranjani MS, Rahbarghazi R, Shariatzadeh MA
Journal of cellular biochemistry 2018 Jan;119(1):524-535
Journal of cellular biochemistry 2018 Jan;119(1):524-535
Challenges in enumeration of CTCs in breast cancer using techniques independent of cytokeratin expression.
Castle J, Morris K, Pritchard S, Kirwan CC
PloS one 2017;12(4):e0175647
PloS one 2017;12(4):e0175647
Targeted Disruption of TCF12 Reveals HEB as Essential in Human Mesodermal Specification and Hematopoiesis.
Li Y, Brauer PM, Singh J, Xhiku S, Yoganathan K, Zúñiga-Pflücker JC, Anderson MK
Stem cell reports 2017 Sep 12;9(3):779-795
Stem cell reports 2017 Sep 12;9(3):779-795
Enhanced Therapeutic and Long-Term Dynamic Vascularization Effects of Human Pluripotent Stem Cell-Derived Endothelial Cells Encapsulated in a Nanomatrix Gel.
Lee SJ, Sohn YD, Andukuri A, Kim S, Byun J, Han JW, Park IH, Jun HW, Yoon YS
Circulation 2017 Nov 14;136(20):1939-1954
Circulation 2017 Nov 14;136(20):1939-1954
MMP-2 and MMP-14 Silencing Inhibits VEGFR2 Cleavage and Induces the Differentiation of Porcine Adipose-Derived Mesenchymal Stem Cells to Endothelial Cells.
Almalki SG, Llamas Valle Y, Agrawal DK
Stem cells translational medicine 2017 May;6(5):1385-1398
Stem cells translational medicine 2017 May;6(5):1385-1398
ERK signaling is required for VEGF-A/VEGFR2-induced differentiation of porcine adipose-derived mesenchymal stem cells into endothelial cells.
Almalki SG, Agrawal DK
Stem cell research & therapy 2017 May 12;8(1):113
Stem cell research & therapy 2017 May 12;8(1):113
Generating high-purity cardiac and endothelial derivatives from patterned mesoderm using human pluripotent stem cells.
Palpant NJ, Pabon L, Friedman CE, Roberts M, Hadland B, Zaunbrecher RJ, Bernstein I, Zheng Y, Murry CE
Nature protocols 2017 Jan;12(1):15-31
Nature protocols 2017 Jan;12(1):15-31
Mitochondria-Targeted Antioxidant SkQR1 Reduces TNF-Induced Endothelial Permeability in vitro.
Galkin II, Pletjushkina OY, Zinovkin RA, Zakharova VV, Chernyak BV, Popova EN
Biochemistry. Biokhimiia 2016 Oct;81(10):1188-1197
Biochemistry. Biokhimiia 2016 Oct;81(10):1188-1197
Vasculogenic mimicry in small cell lung cancer.
Williamson SC, Metcalf RL, Trapani F, Mohan S, Antonello J, Abbott B, Leong HS, Chester CP, Simms N, Polanski R, Nonaka D, Priest L, Fusi A, Carlsson F, Carlsson A, Hendrix MJ, Seftor RE, Seftor EA, Rothwell DG, Hughes A, Hicks J, Miller C, Kuhn P, Brady G, Simpson KL, Blackhall FH, Dive C
Nature communications 2016 Nov 9;7:13322
Nature communications 2016 Nov 9;7:13322
Definitive Hematopoietic Multipotent Progenitor Cells Are Transiently Generated From Hemogenic Endothelial Cells in Human Pluripotent Stem Cells.
Bai H, Liu Y, Xie Y, Hoyle DL, Brodsky RA, Cheng L, Cheng T, Wang ZZ
Journal of cellular physiology 2016 May;231(5):1065-76
Journal of cellular physiology 2016 May;231(5):1065-76
Tumourigenic non-small-cell lung cancer mesenchymal circulating tumour cells: a clinical case study.
Morrow CJ, Trapani F, Metcalf RL, Bertolini G, Hodgkinson CL, Khandelwal G, Kelly P, Galvin M, Carter L, Simpson KL, Williamson S, Wirth C, Simms N, Frankliln L, Frese KK, Rothwell DG, Nonaka D, Miller CJ, Brady G, Blackhall FH, Dive C
Annals of oncology : official journal of the European Society for Medical Oncology 2016 Jun;27(6):1155-1160
Annals of oncology : official journal of the European Society for Medical Oncology 2016 Jun;27(6):1155-1160
Rab11a Mediates Vascular Endothelial-Cadherin Recycling and Controls Endothelial Barrier Function.
Yan Z, Wang ZG, Segev N, Hu S, Minshall RD, Dull RO, Zhang M, Malik AB, Hu G
Arteriosclerosis, thrombosis, and vascular biology 2016 Feb;36(2):339-49
Arteriosclerosis, thrombosis, and vascular biology 2016 Feb;36(2):339-49
Fc gamma receptor IIb participates in maternal IgG trafficking of human placental endothelial cells.
Ishikawa T, Takizawa T, Iwaki J, Mishima T, Ui-Tei K, Takeshita T, Matsubara S, Takizawa T
International journal of molecular medicine 2015 May;35(5):1273-89
International journal of molecular medicine 2015 May;35(5):1273-89
Histone Demethylases KDM4A and KDM4C Regulate Differentiation of Embryonic Stem Cells to Endothelial Cells.
Wu L, Wary KK, Revskoy S, Gao X, Tsang K, Komarova YA, Rehman J, Malik AB
Stem cell reports 2015 Jul 14;5(1):10-21
Stem cell reports 2015 Jul 14;5(1):10-21
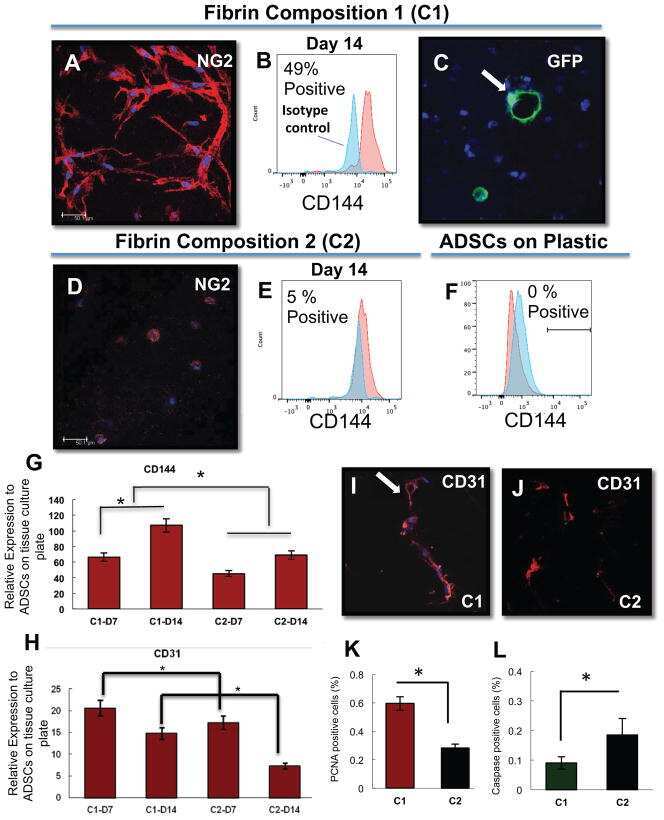
Mesenchymal stromal cells form vascular tubes when placed in fibrin sealant and accelerate wound healing in vivo.
Mendez JJ, Ghaedi M, Sivarapatna A, Dimitrievska S, Shao Z, Osuji CO, Steinbacher DM, Leffell DJ, Niklason LE
Biomaterials 2015 Feb;40:61-71
Biomaterials 2015 Feb;40:61-71
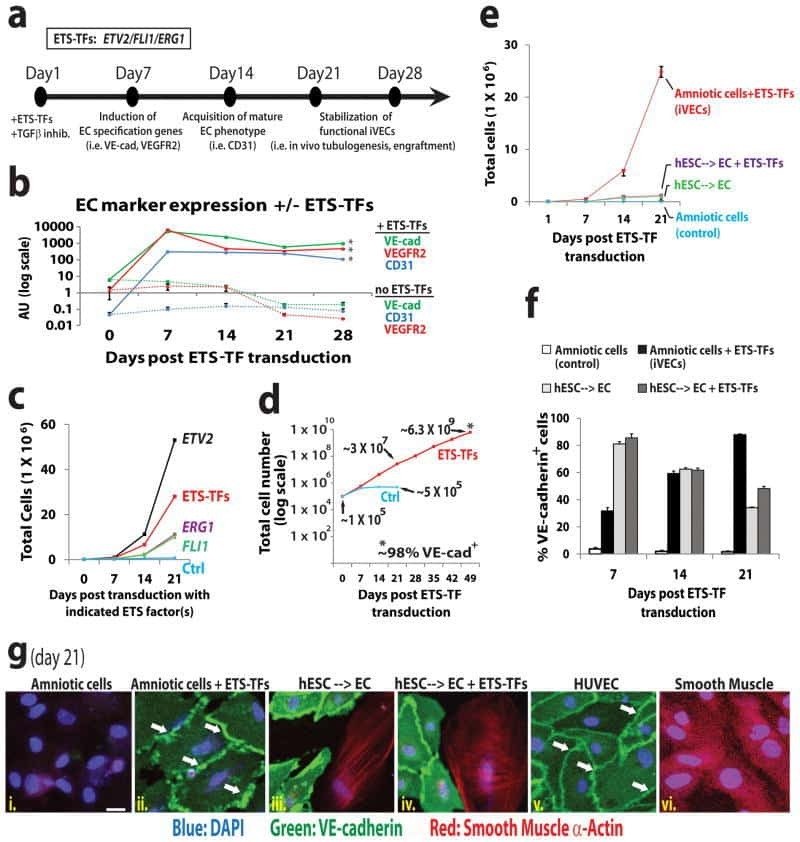
Direct conversion of human amniotic cells into endothelial cells without transitioning through a pluripotent state.
Ginsberg M, Schachterle W, Shido K, Rafii S
Nature protocols 2015 Dec;10(12):1975-85
Nature protocols 2015 Dec;10(12):1975-85
Induced Pluripotent Stem Cells to Model Human Fibrodysplasia Ossificans Progressiva.
Cai J, Orlova VV, Cai X, Eekhoff EMW, Zhang K, Pei D, Pan G, Mummery CL, Ten Dijke P
Stem cell reports 2015 Dec 8;5(6):963-970
Stem cell reports 2015 Dec 8;5(6):963-970
MicroRNA-16 affects key functions of human endothelial progenitor cells.
Goretti E, Rolland-Turner M, Léonard F, Zhang L, Wagner DR, Devaux Y
Journal of leukocyte biology 2013 May;93(5):645-55
Journal of leukocyte biology 2013 May;93(5):645-55
PDGFRα and CD51 mark human nestin+ sphere-forming mesenchymal stem cells capable of hematopoietic progenitor cell expansion.
Pinho S, Lacombe J, Hanoun M, Mizoguchi T, Bruns I, Kunisaki Y, Frenette PS
The Journal of experimental medicine 2013 Jul 1;210(7):1351-67
The Journal of experimental medicine 2013 Jul 1;210(7):1351-67
Neovascular niche for human myeloma cells in immunodeficient mouse bone.
Iriuchishima H, Takubo K, Miyakawa Y, Nakamura-Ishizu A, Miyauchi Y, Fujita N, Miyamoto K, Miyamoto T, Ikeda E, Kizaki M, Nojima Y, Suda T
PloS one 2012;7(2):e30557
PloS one 2012;7(2):e30557
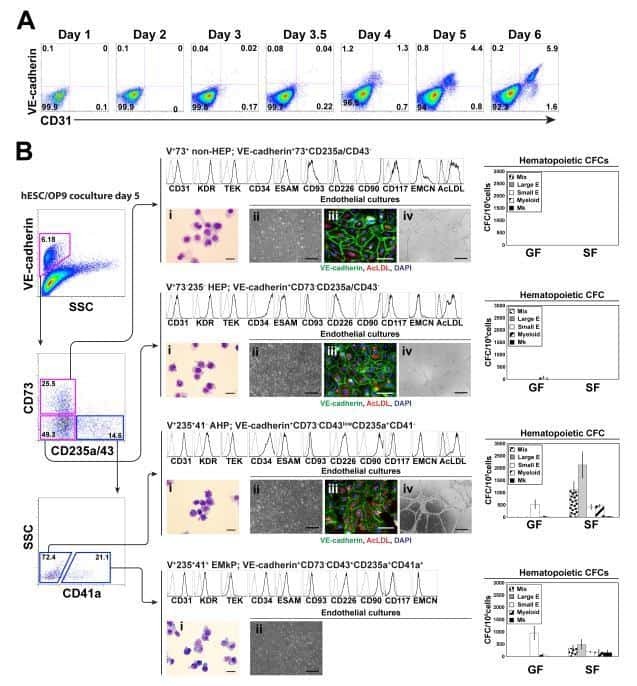
Identification of the hemogenic endothelial progenitor and its direct precursor in human pluripotent stem cell differentiation cultures.
Choi KD, Vodyanik MA, Togarrati PP, Suknuntha K, Kumar A, Samarjeet F, Probasco MD, Tian S, Stewart R, Thomson JA, Slukvin II
Cell reports 2012 Sep 27;2(3):553-67
Cell reports 2012 Sep 27;2(3):553-67
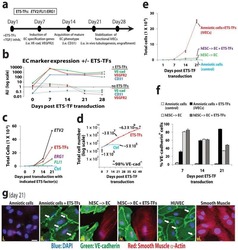
Efficient direct reprogramming of mature amniotic cells into endothelial cells by ETS factors and TGFβ suppression.
Ginsberg M, James D, Ding BS, Nolan D, Geng F, Butler JM, Schachterle W, Pulijaal VR, Mathew S, Chasen ST, Xiang J, Rosenwaks Z, Shido K, Elemento O, Rabbany SY, Rafii S
Cell 2012 Oct 26;151(3):559-75
Cell 2012 Oct 26;151(3):559-75
Identification of endothelial cell junctional proteins and lymphocyte receptors involved in transendothelial migration of human effector memory CD4+ T cells.
Manes TD, Pober JS
Journal of immunology (Baltimore, Md. : 1950) 2011 Feb 1;186(3):1763-8
Journal of immunology (Baltimore, Md. : 1950) 2011 Feb 1;186(3):1763-8
High harvest yield, high expansion, and phenotype stability of CD146 mesenchymal stromal cells from whole primitive human umbilical cord tissue.
Schugar RC, Chirieleison SM, Wescoe KE, Schmidt BT, Askew Y, Nance JJ, Evron JM, Peault B, Deasy BM
Journal of biomedicine & biotechnology 2009;2009:789526
Journal of biomedicine & biotechnology 2009;2009:789526
Perioculomotor cell groups in monkey and man defined by their histochemical and functional properties: reappraisal of the Edinger-Westphal nucleus.
Horn AK, Eberhorn A, Härtig W, Ardeleanu P, Messoudi A, Büttner-Ennever JA
The Journal of comparative neurology 2008 Mar 20;507(3):1317-35
The Journal of comparative neurology 2008 Mar 20;507(3):1317-35
Differential requirements for hematopoietic commitment between human and rhesus embryonic stem cells.
Rajesh D, Chinnasamy N, Mitalipov SM, Wolf DP, Slukvin I, Thomson JA, Shaaban AF
Stem cells (Dayton, Ohio) 2007 Feb;25(2):490-9
Stem cells (Dayton, Ohio) 2007 Feb;25(2):490-9
No comments: Submit comment
Supportive validation
- Submitted by
- Invitrogen Antibodies (provider)
- Main image
- Experimental details
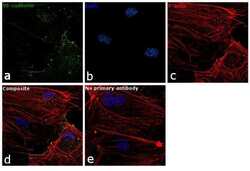
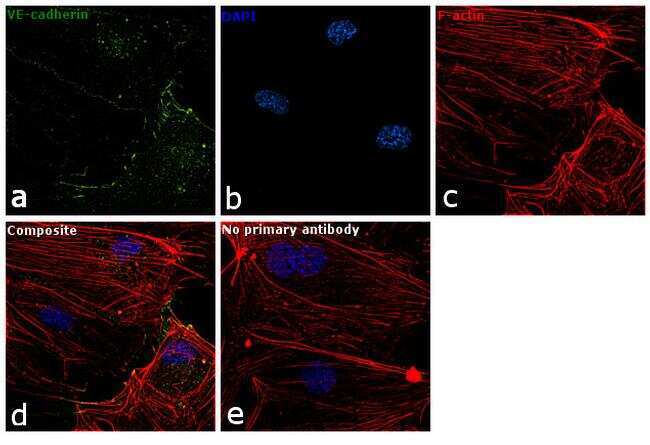
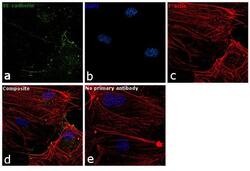
- Immunofluorescence analysis of VE-cadherin was performed using 70% confluent log phase HUVEC cells. The cells were fixed with 4% paraformaldehyde for 10 minutes, permeabilized with 0.1% Triton™ X-100 for 15 minutes, and blocked with 1% BSA for 1 hour at room temperature. The cells were labeled with CD144 (VE-cadherin) Monoclonal Antibody (16B1), eBioscience™ (Product # 14-1449-82) at 5 µg/mL in 0.1% BSA, incubated at 4 degree Celsius overnight and then labeled with Goat anti-Mouse IgG (H+L) Superclonal™ Secondary Antibody, Alexa Fluor® 488 conjugate (Product # A28175) at a dilution of 1:2000 for 45 minutes at room temperature (Panel a: green). Nuclei (Panel b: blue) were stained with SlowFade® Gold Antifade Mountant with DAPI (Product # S36938). F-actin (Panel c: red) was stained with Rhodamine Phalloidin (Product # R415, 1:300). Panel d represents the merged image showing plasma membrane localization. Panel e represents control cells with no primary antibody to assess background. The images were captured at 60X magnification.
- Submitted by
- Invitrogen Antibodies (provider)
- Main image
- Experimental details
- Immunofluorescence analysis of VE-cadherin was performed using 70% confluent log phase HUVEC cells. The cells were fixed with 4% paraformaldehyde for 10 minutes, permeabilized with 0.1% Triton™ X-100 for 15 minutes, and blocked with 1% BSA for 1 hour at room temperature. The cells were labeled with CD144 (VE-cadherin) Monoclonal Antibody (16B1), eBioscience™ (Product # 14-1449-82) at 5 µg/mL in 0.1% BSA, incubated at 4 degree Celsius overnight and then labeled with Goat anti-Mouse IgG (H+L) Superclonal™ Secondary Antibody, Alexa Fluor® 488 conjugate (Product # A28175) at a dilution of 1:2000 for 45 minutes at room temperature (Panel a: green). Nuclei (Panel b: blue) were stained with SlowFade® Gold Antifade Mountant with DAPI (Product # S36938). F-actin (Panel c: red) was stained with Rhodamine Phalloidin (Product # R415, 1:300). Panel d represents the merged image showing plasma membrane localization. Panel e represents control cells with no primary antibody to assess background. The images were captured at 60X magnification.

Supportive validation
- Submitted by
- Invitrogen Antibodies (provider)
- Main image
- Experimental details
- NULL
- Submitted by
- Invitrogen Antibodies (provider)
- Main image
- Experimental details
- NULL
- Submitted by
- Invitrogen Antibodies (provider)
- Main image
- Experimental details
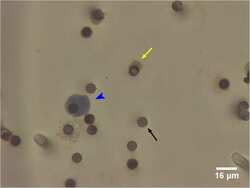
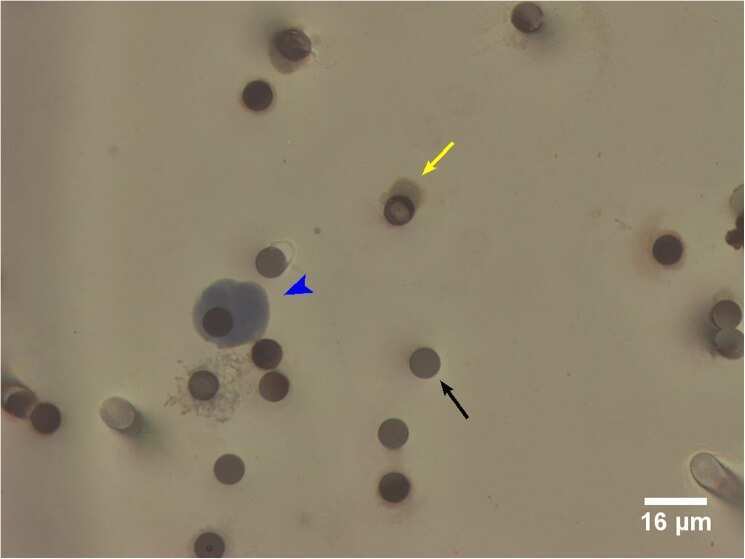
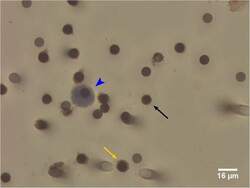
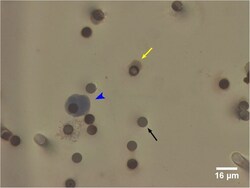
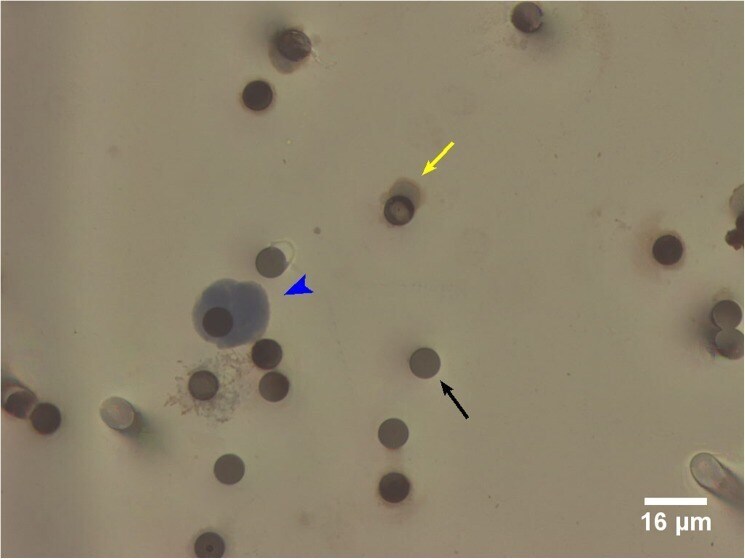
- Fig 3 False positive CTCs identified by ISET filtration and morphology criteria in healthy volunteers. Presumed false positive ''CTC'' (blue arrow head). Cell staining positive for CD45/CD144, consistent with white blood cell or endothelial cell (yellow arrow). The dark circles are 8mum filter pores (black arrow).
- Submitted by
- Invitrogen Antibodies (provider)
- Main image
- Experimental details
- NULL
- Submitted by
- Invitrogen Antibodies (provider)
- Main image
- Experimental details
- NULL
- Submitted by
- Invitrogen Antibodies (provider)
- Main image

- Experimental details
- NULL
- Submitted by
- Invitrogen Antibodies (provider)
- Main image
- Experimental details
- NULL
- Submitted by
- Invitrogen Antibodies (provider)
- Main image
- Experimental details
- NULL

- Submitted by
- Invitrogen Antibodies (provider)
- Main image
- Experimental details
- NULL
- Submitted by
- Invitrogen Antibodies (provider)
- Main image
- Experimental details
- NULL
- Submitted by
- Invitrogen Antibodies (provider)
- Main image
- Experimental details
- NULL
- Submitted by
- Invitrogen Antibodies (provider)
- Main image
- Experimental details
- NULL
- Submitted by
- Invitrogen Antibodies (provider)
- Main image

- Experimental details
- NULL
- Submitted by
- Invitrogen Antibodies (provider)
- Main image

- Experimental details
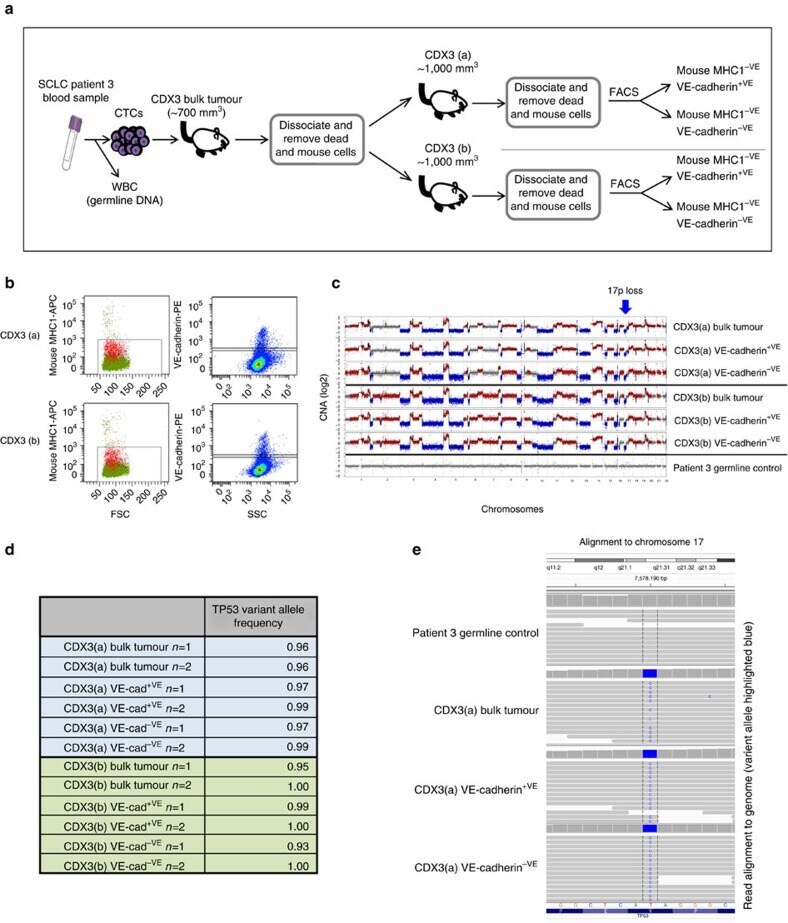
- Figure 5 FACS and genomic analysis of VE-cadherin-positive CDX tumour cells. ( a ) Schematic representing generation of CDX3 and subsequent processing of samples for FACS of human (Mouse MHC1 -VE ) subpopulations based on VE-cadherin +VE and VE-cadherin -VE expression. ( b ) Flow Cytometry dot plots showing gating strategies used for cell sorting. Left panels, forward light scatter versus anti-mouse anti-MHC1 staining. Right panels, side light scatter versus anti-human, anti-VE-cadherin staining. Gating strategies set according to relevant controls (see the 'Methods' section). ( c ) CNA profiles from mice bearing CDX3 tumours (CDX3(a) and CDX3(b)) FACS-sorted mouse MHC -VE , bulk tumour/VE-cadherin +VE /VE-cadherin -VE and patient 3 germline control (white blood cells). The GC-normalized and mappability corrected read counts (log 2 scale) were segmented using Hidden Markov Model (HMM), red=copy-number gains, blue=copy-number losses. ( d ) VAF of TP53 (p.Y220C) mutation in sorted cell subpopulations. ( e ) Read alignment plots from representative samples demonstrate the presence of variant TP53 allele (p.Y220C) in bulk tumour, VE-cadherin +VE and VE-cadherin -VE fractions, but absent in germline patient control.
- Submitted by
- Invitrogen Antibodies (provider)
- Main image
- Experimental details
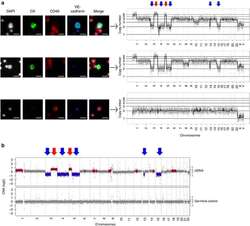
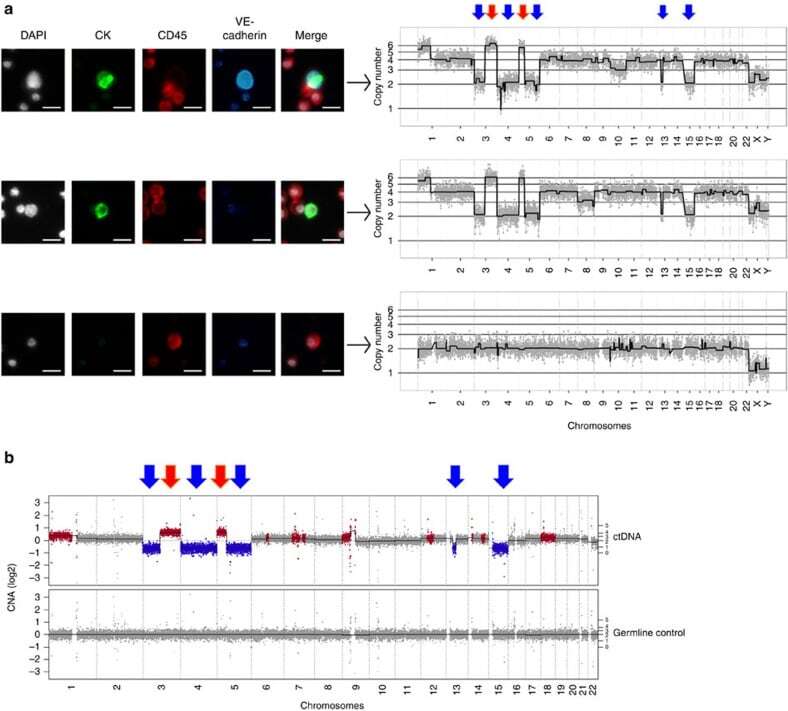
- Figure 6 Single-cell CNA analysis of VE-cadherin-negative and -positive CTCs from an ES SCLC patient. ( a ) CTCs identified using the HD-SCA assay: cells were stained with DAPI (white) and antibodies to CKs (green), CD45 (red) and VE-cadherin (blue) and pseudo-coloured. Top panel, DAPI +VE /CD45 -VE /CK +VE /VE-cadherin +VE CTC; middle panel, DAPI +VE /CD45 -VE /CK +VE /VE-cadherin -VE CTC; bottom panel, DAPI +VE /CD45 +VE /CK -VE /VE-cadherin -VE white blood cell (WBC). Arrows link to the respective CNA analysis of the indicated cell, showing loss of 3p, gain of 5p including TERT and hemizygous loss of RB1 on 13 in CTC. Major chromosome losses (blue arrow) and gains (red arrow) highlighted above. The selected WBC in contrast has a characteristic flat CNA profile indicative of healthy somatic cells. Representative images and profiles are shown. Scaled x 10 images from the scanner are shown for CD45, while remaining images were acquired at x 40. Scale bar, 10 mum. ( b ) CNA analysis of matched patient ctDNA: the GC-normalized and mappability corrected read counts (log 2 scale) were segmented using Hidden Markov Model (HMM), red=copy-number gains, blue=copy-number losses. Major chromosome losses (blue arrow) and gains (red arrow) highlighted above and match pattern identified by single CTC CNA.
- Submitted by
- Invitrogen Antibodies (provider)
- Main image
- Experimental details
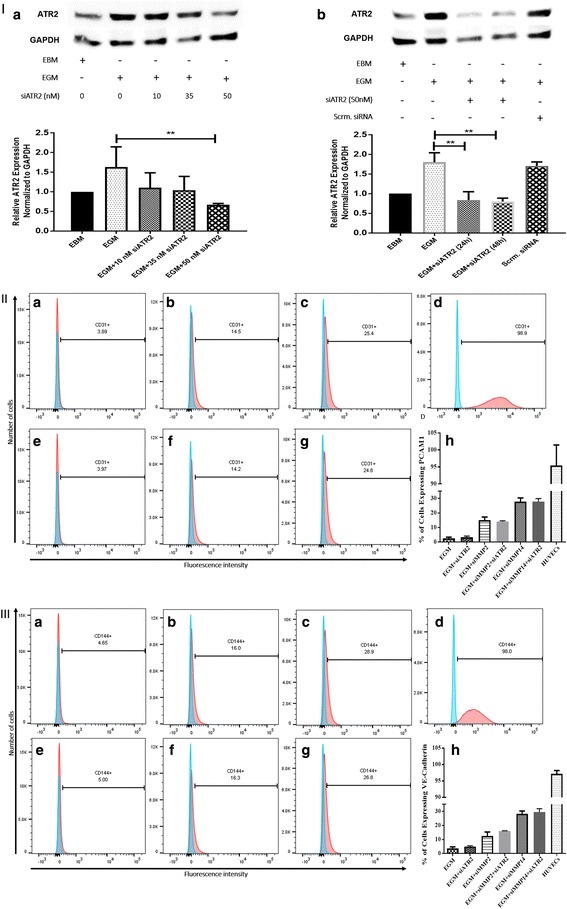
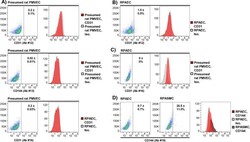
- Fig. 3 ATR2 siRNA transfection and immunophenotyping for EC markers. I Concentration selection for siRNA transfection. Three different concentrations (10, 35, and 50 nM) of ATR2 siRNA were used according to the manufacturer's protocol. Western blot analysis showed inhibition of ATR2 by 10, 35, and 50 nM of ATR2 siRNA. However, 50 nM of ATR2 siRNA showed the highest inhibition among all three different concentrations ( A ). ATR2 silencing by siRNA transfection with EGM compared with AMSCs with EGM and EGM + scrambled siRNA (negative control) ( B ). GAPDH was used as a housekeeping gene. II Flow cytometric analysis of PECAM1 (CD31) in four different groups; control group with EGM ( A ), AMSCs with EGM and MMP-2 siRNA ( B ), AMSCs with EGM and MMP-14 siRNA ( C ), and HUVECs as the positive control ( D ). Cell transfection with 5 muM of ATR2 siRNA for EGM ( E ), AMSCs with EGM and MMP-2 siRNA ( F ), and AMSCs with EGM and MMP-14 siRNA ( G ). Flow cytometry data were analyzed to show the significant differences between the groups ( H ). III Flow cytometric analysis of VE-cadherin (CD144) in four different groups: control group AMSCs with EGM ( A ), AMSCs with EGM and MMP-2 siRNA ( B ), AMSCs with EGM and MMP-14 siRNA ( C ), and HUVECs as the positive control ( D ). Cell transfection with 5 muM of ATR2 siRNA for EGM ( E ), AMSCs with EGM and MMP-2 siRNA ( F ), and AMSCs with EGM and MMP-14 siRNA ( G ). Flow cytometry data were analyzed to show the significant differences betwe
- Submitted by
- Invitrogen Antibodies (provider)
- Main image
- Experimental details
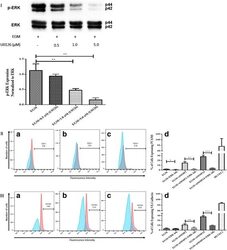
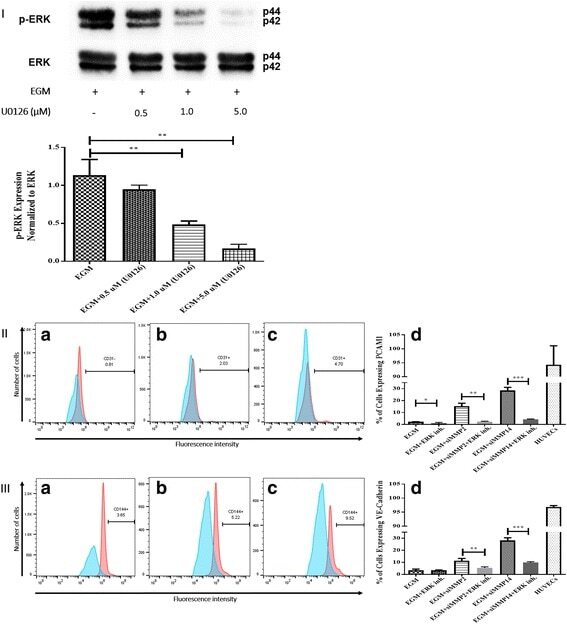
- Fig. 5 Inhibition of ERK phosphorylation and immunophenotyping for EC markers. I Concentration -dependent effect of ERK inhibitor (U0126). Three different concentrations (0.5, 1.0, and 5.0 muM) of U0126 were used. Western blot analysis showed significant inhibition of p-ERK by 1.0 and 5.0 muM of U0126. However, 5.0 muM of U0126 showed the highest inhibition among all three different concentrations. Phospho-ERK was normalized to its total protein expression. II Flow cytometric analysis of PECAM1 (CD31) with ERK inhibitor (U0126). Three different groups treated with 5.0 muM of U0126: AMSCs with EGM ( A ), AMSCs with EGM and MMP-2 siRNA ( B ), and AMSCs with EGM and MMP-14 siRNA ( C ). Flow cytometry data were analyzed to show the significant differences between the groups ( D ). III Flow cytometric analysis of VE-cadherin (CD144) with ERK inhibitor (U0126). Three different groups were treated with 5.0 muM of U0126: AMSCs with EGM ( A ), AMSCs with EGM and MMP-2 siRNA ( B ), and AMSCs with EGM and MMP-14 siRNA ( C ). Flow cytometry data were analyzed to show the significant differences with or without U0126 ( D ). * p < 0.05, ** p < 0.01, *** p < 0.001. EBM endothelial cell basal medium, EGM endothelial cell growth medium, MMP matrix metalloproteinase, ERK extracellular signal-regulated kinase, HUVEC human umbilical vein endothelial cell
- Submitted by
- Invitrogen Antibodies (provider)
- Main image
- Experimental details
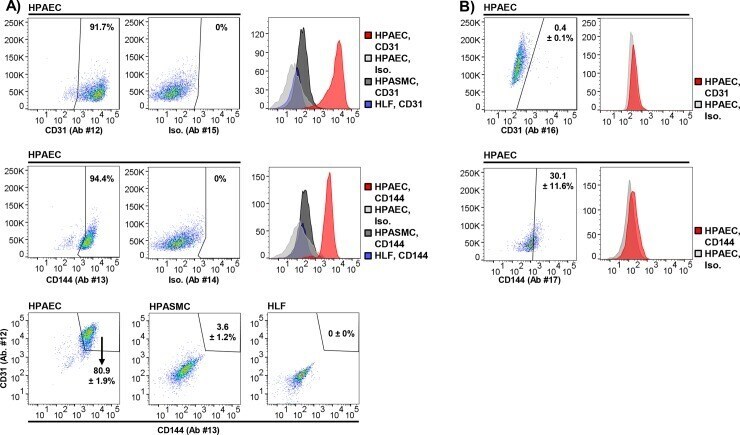
- Fig 3 Identifying human pulmonary artery endothelial cells (HPAECs) by flow cytometry. (A) Commercially purchased HPAECs were analyzed by flow cytometry using anti-CD31 and anti-CD144 Abs #12 and #13. Compared with HPASMCs and HLFs, high expression of CD31 and CD144 was observed only in HPAECs. These results served as a positive control for further experiments aiming to confirm that cells isolated from rat lungs ex vivo were, in fact, endothelial. (B) Commercially purchased HPAECs were used to test the generalizability of these results. Alternative anti-CD31 and anti-CD144 antibodies did not reliably identify endothelial cell surface markers, supporting our earlier findings indicating variability in reactivity (i.e., quality) of tested antibodies across experimental methods, including flow cytometry. Representative plots and histograms shown. Means +- standard error, % CD31 or CD144 positive, N = 4-5/condition. Ab, antibody; Iso, Isotype control.
- Submitted by
- Invitrogen Antibodies (provider)
- Main image
- Experimental details
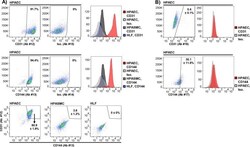
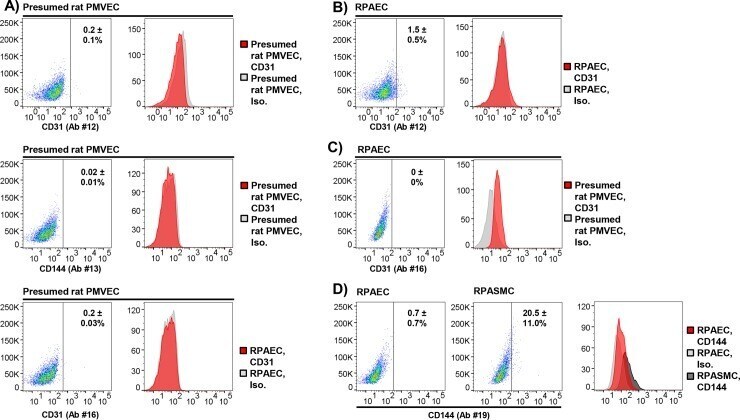
- Fig 4 Identifying rat pulmonary endothelial cells by flow cytometry. Presumed rat PMVECs isolated by mechanical and enzymatic dissociation of peripheral lung and culture in endothelial-selective medium, commercial rat pulmonary artery endothelial cells (RPAECs), or rat pulmonary artery smooth muscle cells (RPASMCs) were labeled with antibodies against endothelial surface markers. (A) Anti-CD31 (Ab #12 and #16) and CD144 (Ab #13) signal was not observed in presumed rat PMVECs by flow cytometry (N = 3/condition). (B) Labeling of RPAECs was also not observed for anti-CD31 antibodies #12 (N = 4/condition) and (C) #16, respectively (N = 3/condition). (D) False-positive signal was detected in RPASMCs labeled with anti-CD144 Ab #19 (N = 4/condition). Representative plots and histograms shown. Means +- standard error, % CD31 or CD144 positive. Ab, antibody; Iso, Isotype control.
- Submitted by
- Invitrogen Antibodies (provider)
- Main image

- Experimental details
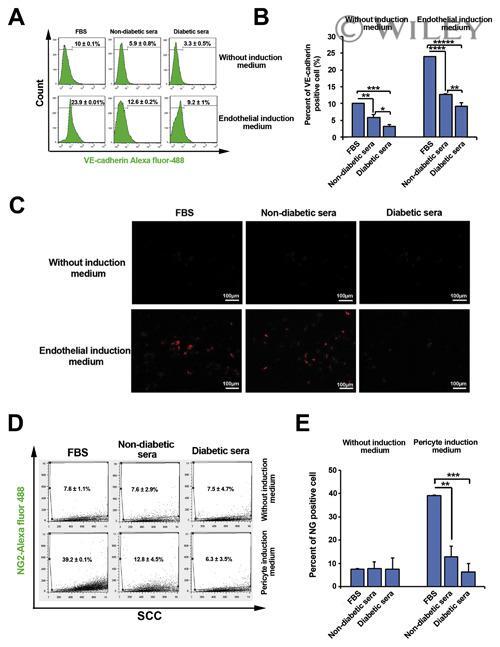
- Representative images of DM2 effect on endothelial and pericyte differentiation of hMSC (A-E). Flow cytometry analysis confirmed DM2 decreased the endothelial differentiation of hMSCs indicated by a reduction in VE-cadherin levels (n = 3) (A and B). DM2 is also able to decrease Dil-Ac-LDL uptake capacity in hMSCs (C). The level of NG2, a pericyte marker, was also decreased during hMSC differentiation into pericyte-like cells under diabetic condition (n = 6) (D).
- Submitted by
- Invitrogen Antibodies (provider)
- Main image
- Experimental details
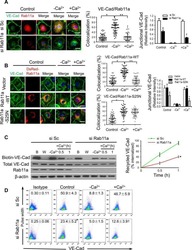
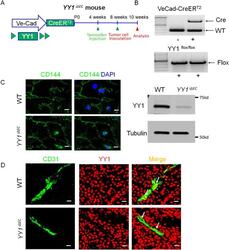
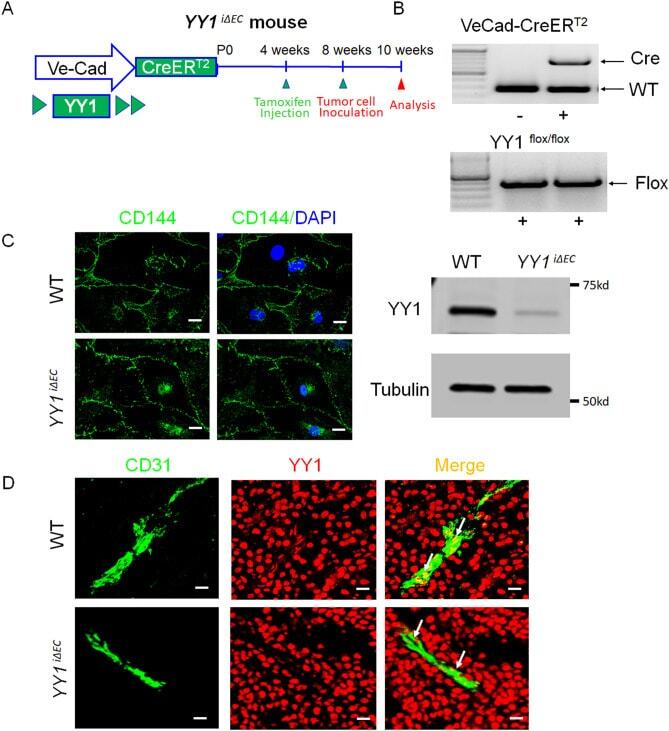
- Figure 2 Generation and characterization of endothelial-specific YY1 deficient mice for the tumor angiogenesis. ( A ) Schematic diagram for the endothelial cell specific deletion of YY1 in mice (Ve-Cad-CreER T2 ; YY1 flox/flox , YY1 iDeltaEC ) and the strategy of the tumor angiogenesis study. The tumor was induced by melanoma B16-F10 cells (5 x 10 cells per mouse) with subcutaneously transplanted into 8-week-old WT or YY1 iEC mice. ( B ) PCR analysis for the genotyping of Ve-Cad-CreER T2 ; YY1 flox/flox mice (YY1 iDeltaEC ) and YY1 flox/flox (WT) mice. ( C ) Immunofluorescence image of endothelial cell marker VE-Cadherin in lung endothelial cells isolated from YY1 iDeltaEC mice. Nuclei were labeled by DAPI (blue) (Left panel) and Western blot analysis of endothelial YY1 expression in mouse lung endothelial cells isolated from WT and YY1 iDeltaEC mice (n = 3) (Right panel). ( D ) Dual immunostaining analysis of YY1 (red) and endothelial cell marker CD31 (green) in melanoma tumor tissues isolated from WT and YY1 iDeltaEC mice, (n = 7). Scale bars: 20 mum.
- Submitted by
- Invitrogen Antibodies (provider)
- Main image
- Experimental details
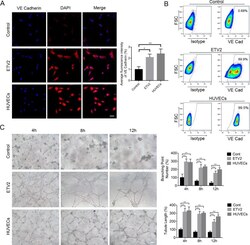
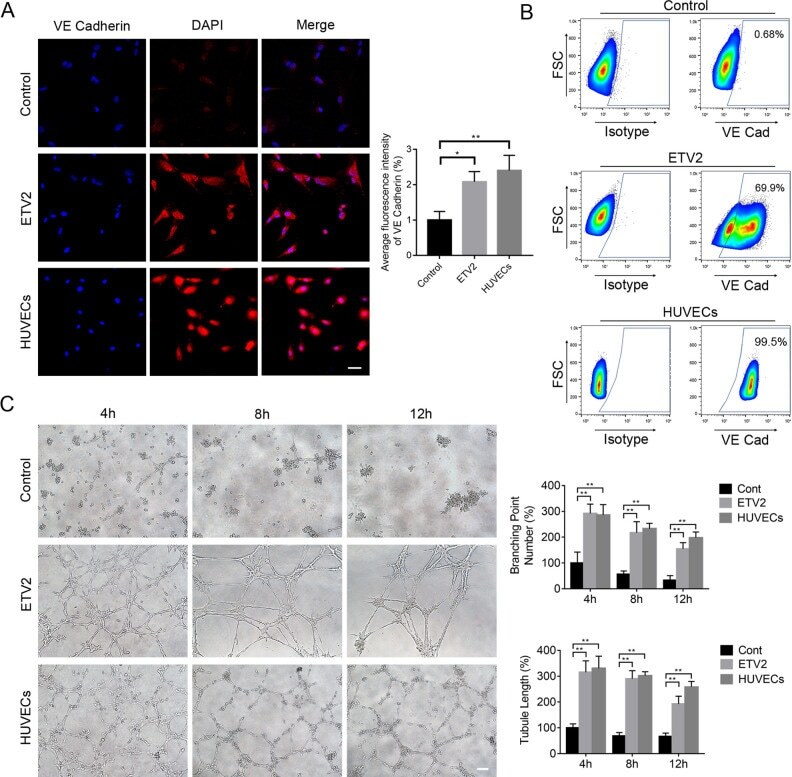
- Figure 3. ETV2 overexpression enhanced endothelial differentiation of DPSCs. (A) Effects of ETV2 overexpression on the protein expression levels of VE-Cadherin, as detected by immunofluorescence staining and quantitative analysis of fluorescence intensity. Scale bar: 50 mum. (B) Evaluation of endothelial-specific marker expression by flow cytometry. (C) Results of tube formation assay in vitro and quantification of tubule length and branching point numbers. Scale bar: 50 mum, * P < 0.05, ** P < 0.01. DPSCs: dental pulp stem cells.
- Submitted by
- Invitrogen Antibodies (provider)
- Main image
- Experimental details
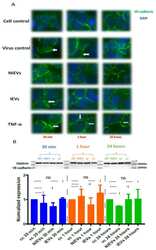
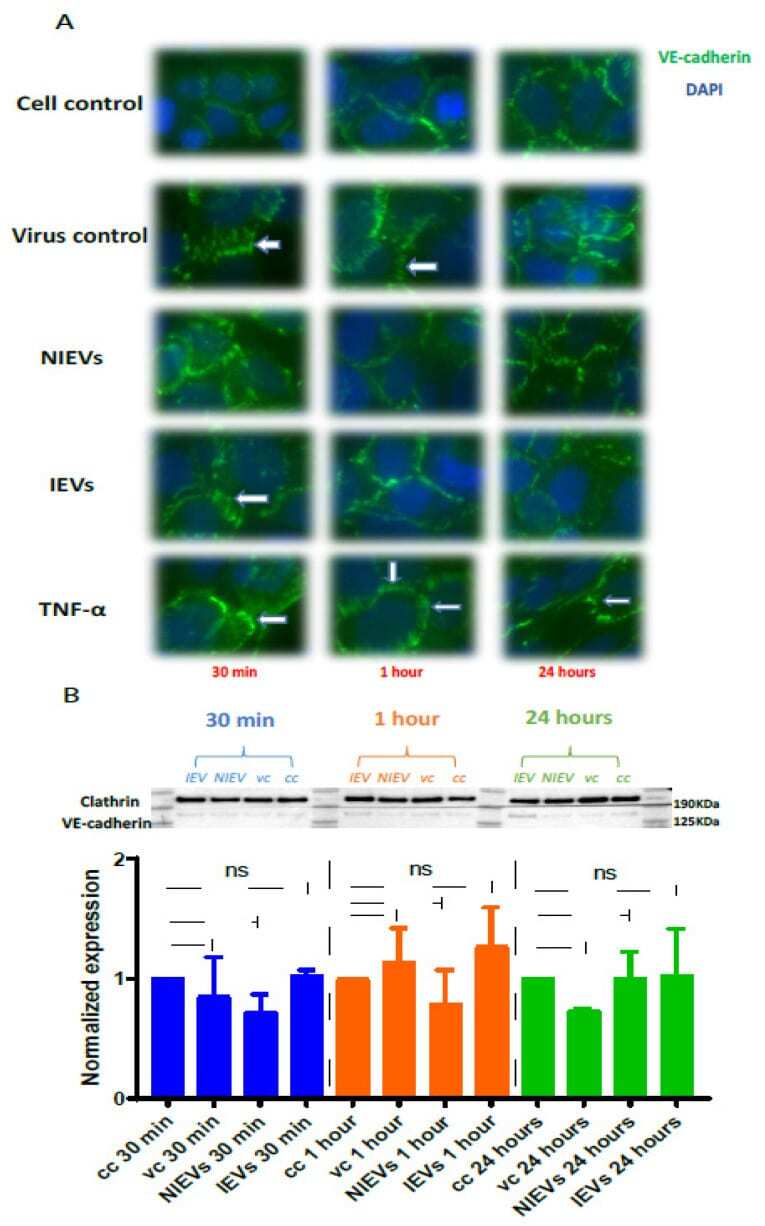
- Figure 4 ZIKV and IEVs induce structural rearrangements of VE-cadherin at the early time points. ( A ) Alterations in the architecture of VE-cadherin (white arrows) are observed at 30 min in ZIKV-infected and IEV-treated hcMEC/D3 cells. These changes are restored at later time points, except for ZIKV-infected cells, where reorganization of VE- cadherin is still detectable at 1 h post infection. TNF-alpha (100 ng/mL) is used as a positive control (40x objective). ( B ) Expression levels of VE-cadherin are not significantly changed in ZIKV- and EV-treated cells after 30 min, 1 h, and 24 h. Clathrin is used as an internal loading control in the Western blot analysis.
- Submitted by
- Invitrogen Antibodies (provider)
- Main image
- Experimental details
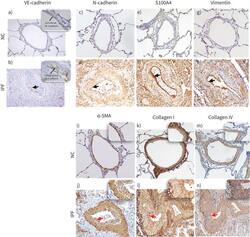
- FIGURE 8 Descriptive images of immunohistochemically stained pulmonary arteries for VE-cadherin (magnification 20x): a) normal control (NC), b) idiopathic pulmonary fibrosis (IPF), in insets junctional and cytoplasmic expression of VE-cadherin in NC and IPF, respectively (100x). Staining images for: N-cadherin c) NC and d) IPF (20x); S100A4 e) NC and f) IPF; vimentin g) NC and h) IPF; alpha-SMA i) NC and j) IPF; collagen-I k) NC and l) IPF; and collagen-IV m) NC and n) IPF (all images taken in 20x magnification for medium-size arteries). The black arrows indicate mesenchymal protein expression in the intima, and the red arrows indicate alpha-SMA+ myofibroblast (in inset intima) and ECM protein: collagen I and collagen IV deposition (in inset intima).

- Submitted by
- Invitrogen Antibodies (provider)
- Main image
- Experimental details
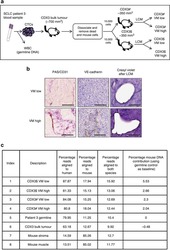
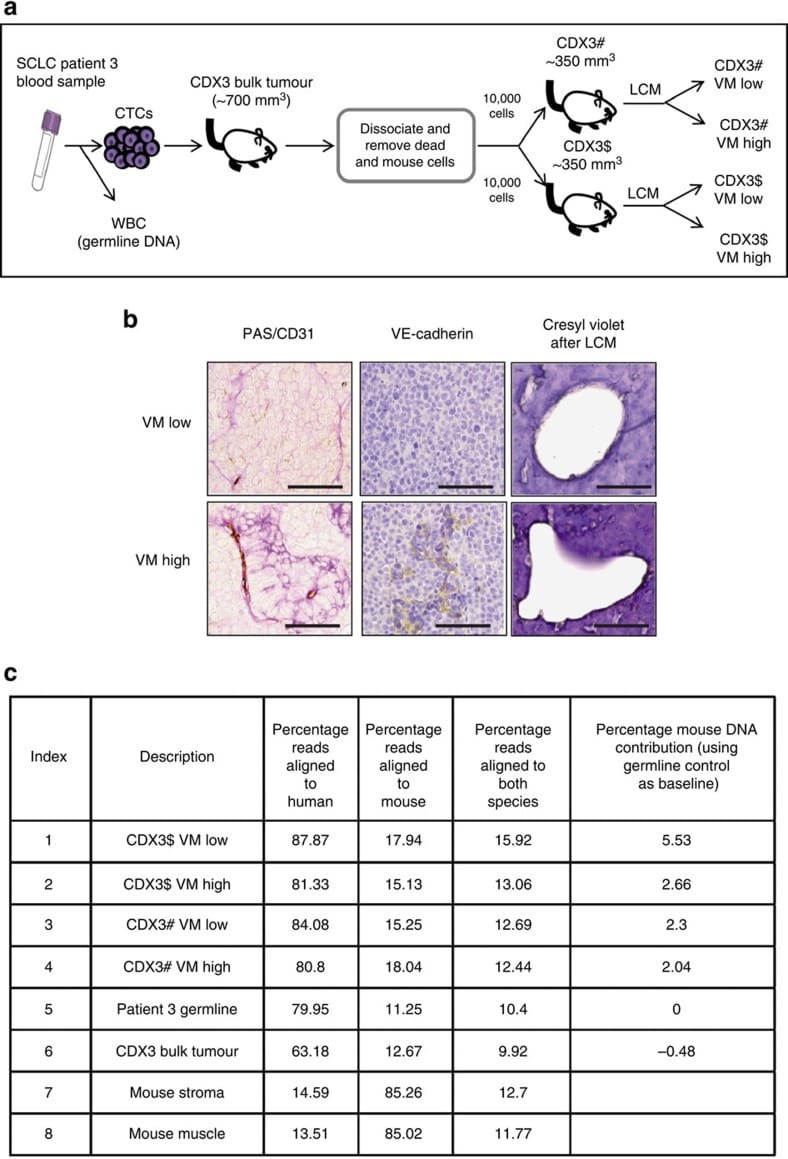
- Figure 4 LCM and genomic analysis of VE-cadherin-positive VM vessels in CDX. ( a ) Schematic representation of generation of CDX3 and subsequent samples used for VM analysis, genomic analysis and targeted sequencing of LCM regions. White blood cells (WBC) used to generate germline control DNA. ( b ) IHC staining for PAS/CD31, VE-cadherin and (non DNA damaging) Cresyl Violet with VM-low/-high LCM area from CDX3 tumour. Scale bar, 100 mum. ( c ) Sequencing data from the 8 different samples used for genomic analysis demonstrating minimal mouse cell contamination and predominantly human genomes in VM structures in vivo . All reads were aligned to both human and mouse genome separately.
- Submitted by
- Invitrogen Antibodies (provider)
- Main image
- Experimental details
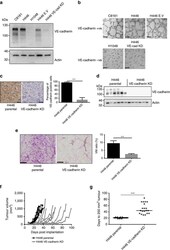
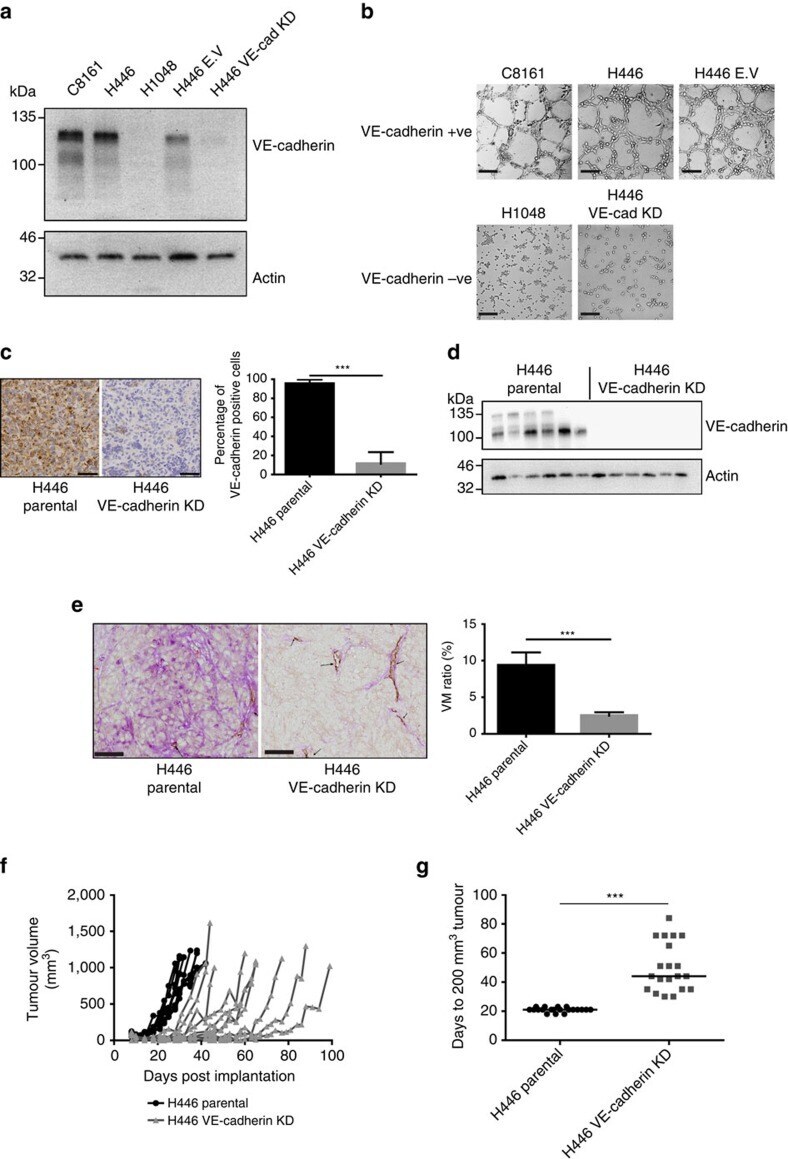
- Figure 7 Functional significance of VE-cadherin expression for SCLC VM in vitro and in vivo . ( a ) Western blot analysis of VE-cadherin expression levels in VM proficient C8161 melanoma cells and H446, H446 non-silencing empty vector controls, H446 VE-cadherin shRNA knockdown and H1048 SCLC cells. ( b ) VM-like network formation on matrigel for VE-cadherin +VE cells (C8161, H446 and H446 E.V) and VE-cadherin -VE cells (H1048 and H446 VE-cadherin KD) lacking network formation. Representative images are shown for n >3 experiments. Scale bar, 200 mum. ( c ) Left panel, representative images of anti-human anti-VE-cadherin staining in H446 parental and H446 VE-cadherin KD xenografts. Scale bar, 50 mum. ( c ) Right panel percentage of cells positive for VE-cadherin in H446 and H446 VE-cadherin KD xenografts (*** P =0.0001, two-tailed t -test), n =10 animals per group. ( d ) Western blot analysis VE-cadherin expression in H446 and H446 VE-cadherin KD xenografts ( n =6 tumours for each group). ( e ) Left panel, representative images of anti-mouse anti-CD31/PAS staining in H446 Parental and H446 VE-cadherin KD tumours. Scale bars, 50 mum. ( e ) Right panel VM ratio in H446 parental ( n =10) and H446 VE-cadherin KD xenografts ( n =8; *** P =0.0005, two-tailed Mann-Whitney's test). ( f ) Tumour growth rates in H446 (black) and H446 VE-cadherin KD (grey) tumours ( n =10 animals per group). ( g ) Days to 200 mm 3 volume tumours in H446 and H446 VE-cadherin xenografts KD ( n =20 anim
- Submitted by
- Invitrogen Antibodies (provider)
- Main image
- Experimental details
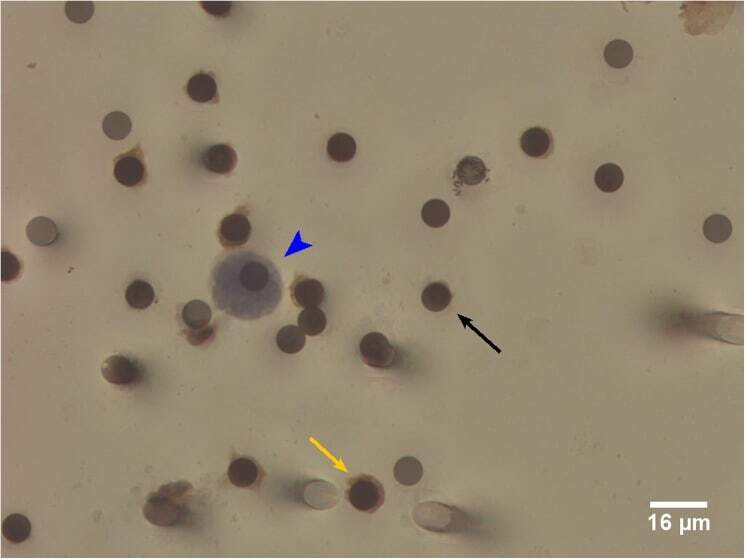
- Fig 1 Circulating Tumour Cell (CTC) detected by Immunocytochemical (ICC)-Staining of ISET Filters. Large cells from blood samples are enriched by ISET filtration and immunocytochemically stained for the White Blood Cell marker CD45 and the Endothelial Cell marker CD144 (yellow arrow). Circulating Tumour Cells (CTCs) are identified as >=16mum diameter cells with a hyperchromatic nucleus and negative for CD45/CD144 brown chromogen staining (blue arrowhead). The dark circles are 8mum filter pores (black arrow).
- Submitted by
- Invitrogen Antibodies (provider)
- Main image
- Experimental details
- Fig 3 False positive CTCs identified by ISET filtration and morphology criteria in healthy volunteers. Presumed false positive ''CTC'' (blue arrow head). Cell staining positive for CD45/CD144, consistent with white blood cell or endothelial cell (yellow arrow). The dark circles are 8mum filter pores (black arrow).
- Submitted by
- Invitrogen Antibodies (provider)
- Main image
- Experimental details
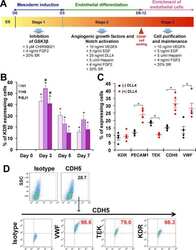
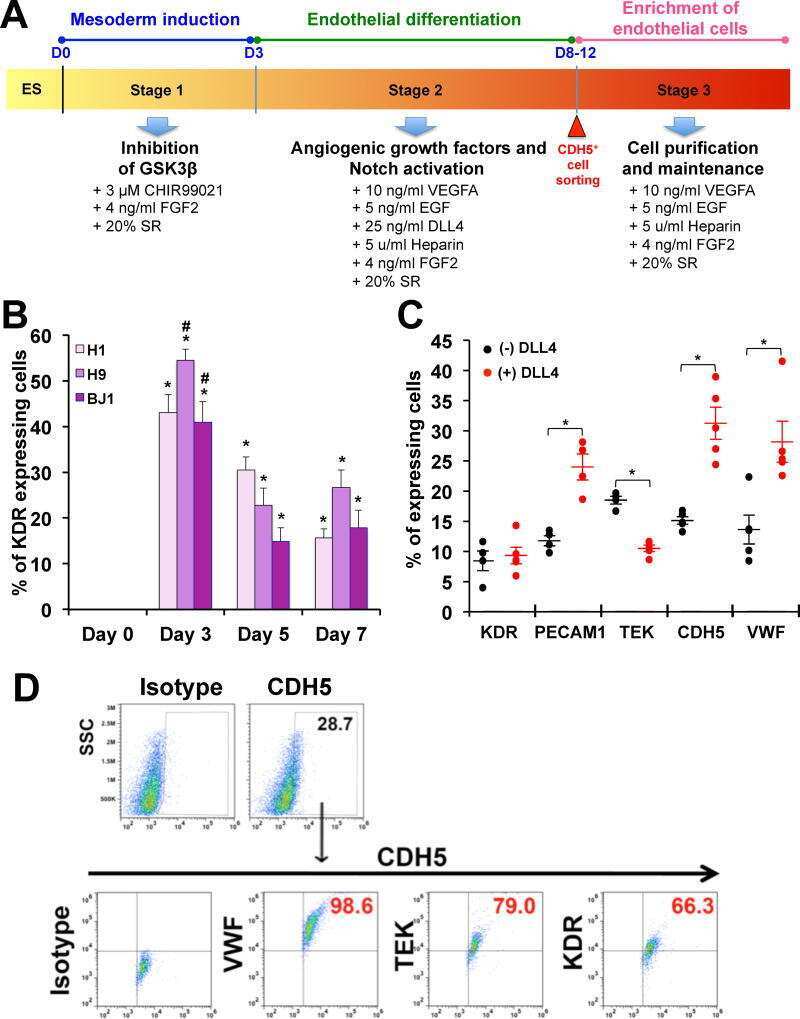
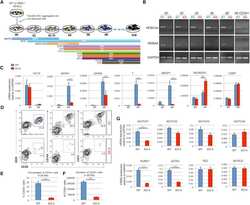
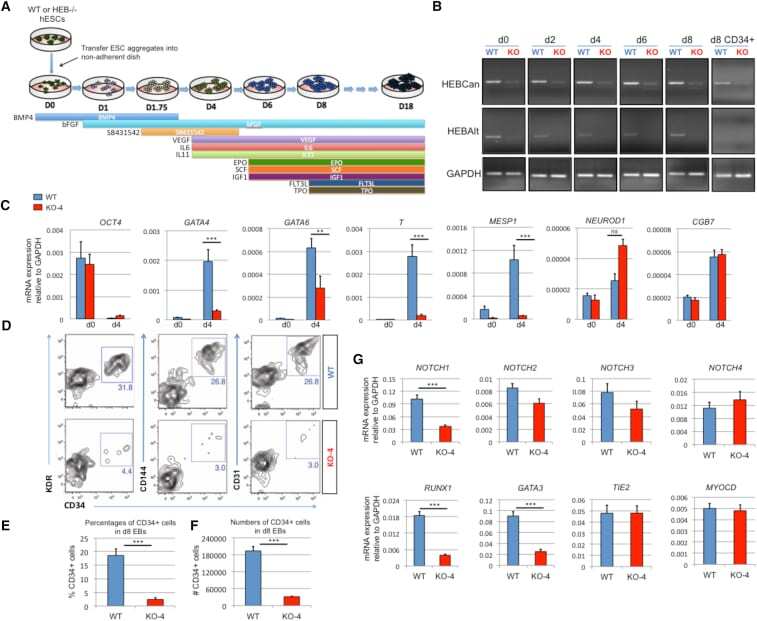
- Figure 3 HEB -/- hESCs Display Defects in Mesoendodermal Induction and Early Hematopoietic Differentiation (A) Experimental overview of embryoid body (EB) formation and differentiation. BMP4, bone morphogenetic protein 4; bFGF, basic fibroblast growth factor; VEGF, vascular endothelial growth factor; IL, interleukin; EPO, erythropoietin; SCF, stem cell factor; IGF1, insulin-like growth factor 1; FLT3L, FMS-like tyrosine kinase 3 ligand; TPO, thrombopoietin. (B) Reverse-transcriptase PCR analysis of HEB transcript (HEBCan, canonical; HEBAlt, alternative) expression at various stages of EB differentiation, and in sorted day-8 (d8) CD34 + cells (last column). GAPDH was measured as a loading control. (C) qRT-PCR analysis for the expression of pluripotency and differentiation markers in undifferentiated hESCs (day 0 [d0]) versus d4 EB-derived cells. (D) Flow-cytometric analysis of CD34 and KDR, CD144, and CD31 expression on d8 EB-derived cells. (E and F) Percentages (E) and numbers (F) of CD34 + cells in d8 EBs. (G) qRT-PCR analysis of the expression of mesodermal and hematopoietic genes in CD34 + cells. For qRT-PCR graphs, mRNA levels are shown relative to GAPDH. Error bars represent mean +- SD (n = 3 independent experiments). ** p < 0.01; *** p < 0.005 by Student''s t test. Images in (B) and plots in (D) are representative of three independent experiments. See also Figure S4 .
- Submitted by
- Invitrogen Antibodies (provider)
- Main image
- Experimental details
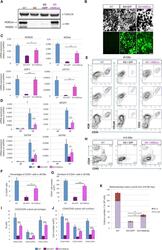
- Figure 6 Ectopic Expression of HEBCan in HEB -/- hESCs Restores Lineage-Specific Gene Expression and Hematopoietic Specification (A) Western blot analysis for HEB expression in WT, KO (HEB -/- ), KO + GFP (HEB -/- hESCs transduced with GFP control vector) and KO + HEBCan (HEB -/- hESCs transduced with HEBCan-encoding vector) hESCs. (B) Bright-field (top) and fluorescent (bottom) images of day-8 (d8) EBs derived from HEB -/- hESCs transduced with control or HEBCan-expressing lentiviral particles. Scale bar, 100 mum. (C and D) qRT-PCR analysis for the expression of pluripotency-associated genes (C) and mesoendodermal genes (D) in WT, KO + GFP, and KO + HEBCan hESC-derived cells at d0 and d4 of EB culture. mRNA levels are shown relative to GAPDH. (E) Flow-cytometric analysis of CD34 and KDR, CD144, and CD31 on WT, KO + GFP, and KO + HEBCan d8 EB-derived cells. (F and G) Percentages (F) and numbers (G) of CD34 + cells in WT, KO + GFP, and KO + HEBCan d8 EBs. (H) Flow-cytometric analysis for CD34 and CD45 on WT, KO + GFP, and KO + HEBCan d18 EB-derived cells. (I and J) Percentages (I) and numbers (J) of CD34/CD45 subsets in WT, KO + GFP, and KO + HEBCan d18 EB-derived cells. (K) Numbers of erythroid (BFU-E) and myeloid (CFU-GM) arising from unfractionated WT, KO + GFP, and KO + HEBCan d18 EBs. Error bars represent mean +- SD (n = 3 independent experiments). * p < 0.05, ** p < 0.01, *** p < 0.005 by Student's t test. Images in (A) and (B) and plots in (E) and (H) are represent

- Submitted by
- Invitrogen Antibodies (provider)
- Main image
- Experimental details
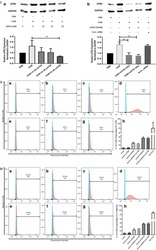
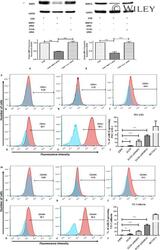
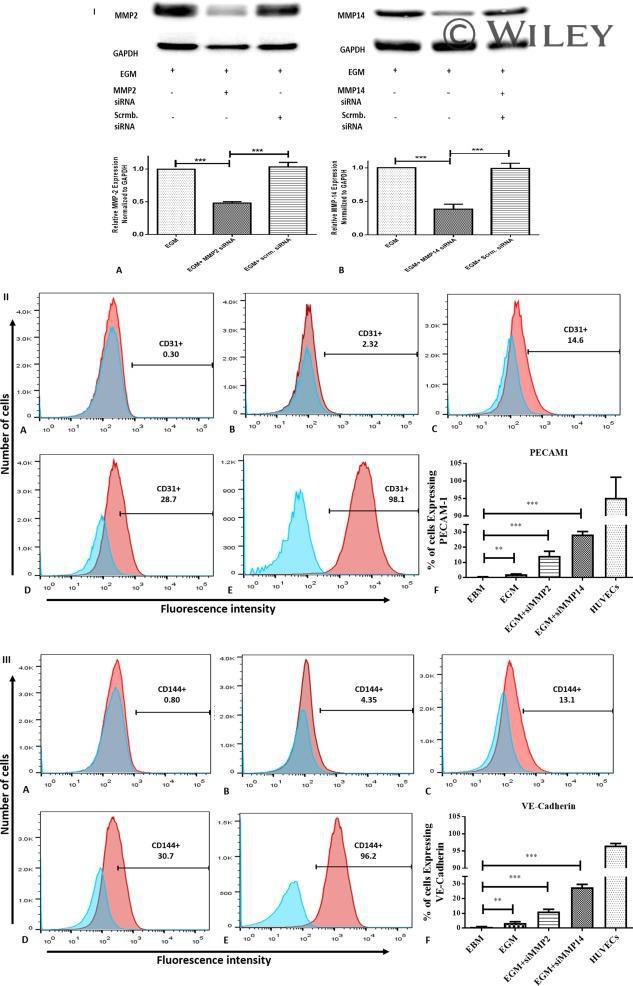
- siRNA transfection and immunophenotyping of differentiated adipose-derived mesenchymal stem cells (AMSCs); (I) : MMP-2 (A) and MMP-14 (B) silencing by siRNA transfection with EGM compared to AMSCs with EGM and EGM plus scrambled siRNA (negative control). GAPDH was used as a housekeeping gene (*, p < .05; **, p < .01; ***, p < .001). (II) : Flow cytometric analysis of PECAM1 (CD31) in five different groups; control group was the undifferentiated cells with EBM (A), AMSCs with differentiation medium EGM (B), AMSCs with differentiation medium EGM and MMP-2 siRNA (C), AMSCs with differentiation medium EGM and MMP-14 siRNA (D), and HUVECs as the positive control (E). Flow cytometry data were analyzed to show the significant differences between the groups (F). (III) : Flow cytometric analysis of VE-Cadherin (CD144) in five different groups; control group was the undifferentiated cells with EBM (A), AMSCs with differentiation medium EGM (B), AMSCs with differentiation medium EGM and MMP-2 siRNA (C), AMSCs with differentiation medium EGM and MMP-14 siRNA (D), and HUVECs as the positive control (E). Flow cytometry data were analyzed to show the significant differences between the groups (F). (*, p < .05; **, p < .01; ***, p < .001). Abbreviations: CD, cluster of differentiation; EBM, endothelial basal medium; EGM, endothelial growth medium; GAPDH, glyceraldehyde-3-phosphate dehydrogenase; HUVECs, human umbilical vein endothelial cells; MMP, matrix metalloproteinases.
- Submitted by
- Invitrogen Antibodies (provider)
- Main image
- Experimental details
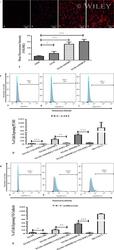
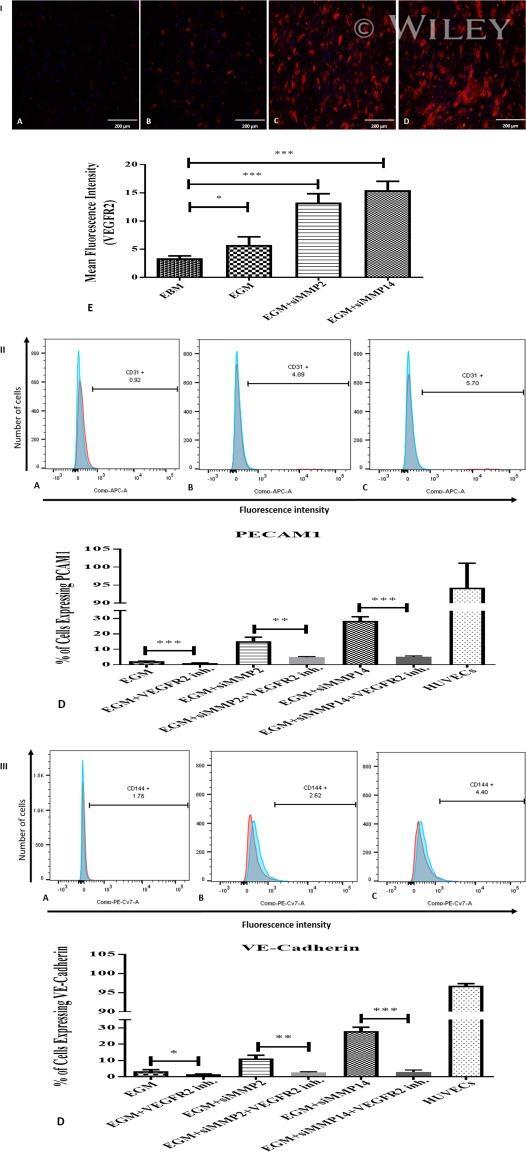
- Immunostaining of VEGFR2 and immunophenotyping of differentiated adipose-derived mesenchymal stem cells (AMSCs) after VEGFR2 kinase inhibition; (I) : Immunofluorescence staining for VEGFR2. AMSCs in EGM showed significant increases in the expression of VEGFR2 (B & E) compared to endothelial basal medium group (A & E). AMSCs cultured with EGM and MMP-2 siRNA showed significantly higher fluorescence intensity of VEGFR2 in comparison to the EGM cultured cells (C & E). AMSCs cultured with EGM and MMP-14 siRNA showed the greatest positive staining of VEGFR2 compared to that of EGM and EGM plus MMP2 siRNA (D & E). Fluorescence intensity was measured to show the significant differences between the groups using ImageJ software (E). (II) : Flow cytometric analysis of PECAM1 (CD31) in three different groups; control group was the differentiated cells with EGM and 5 muM of VEGFR2 inhibitor (A), AMSCs with differentiation medium EGM, MMP-2 siRNA and 5 muM of VEGFR2 inhibitor (B) and AMSCs with EGM, MMP-14 siRNA and 5 muM of VEGFR2 inhibitor (C). Flow cytometry data were analyzed to show the significant differences between the groups in comparison to the same groups without VEGFR2 inhibitor (D). (III) : Flow cytometric analysis of VE-Cadherin (CD144) in three different groups; the differentiated cells with EGM and 5 muM of VEGFR2 inhibitor (A), AMSCs with differentiation medium EGM, MMP-2 siRNA and 5 muM of VEGFR2 inhibitor (B) and AMSCs with EGM, MMP-14 siRNA and 5 muM of VEGFR2 inhibito
- Submitted by
- Invitrogen Antibodies (provider)
- Main image
- Experimental details
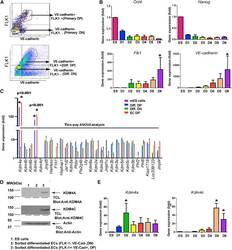
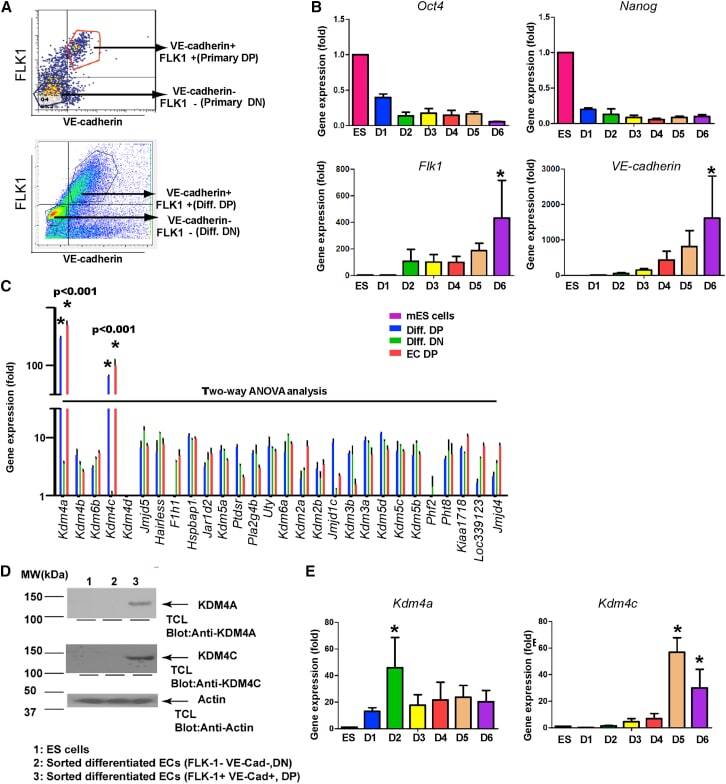
- Figure 1 Expression of KDM4A and KDM4C following mESC Differentiation into Endothelial Cells (A) Flow sorting diagram of mESCs differentiated to endothelial cells stained with anti-FLK1 and anti-VE-cadherin antibodies. Cells were separated into FLK1/VE-cadherin-double positive endothelial cells or double-negative control cells. (B) Time course of gene expression assessed by qRT-PCR for the pluripotency genes Oct4 and Nanog as well as for endothelial genes Flk1 and VE-cadherin during the 6-day differentiation period (D1 to D6; ES are mESCs); error bars represent mean +- SD (n = 3 independent experiments, p < 0.05 by ANOVA). (C) qRT-PCR screen for 28 known histone demethylases was carried out in mESCs differentiated into FLK1/VE-cadherin-double positive endothelial cells (D6), double-negative control cells (D6), and adult primary mouse endothelial cells. Expression of KDM4a and KDM4c was markedly increased in mESC-derived and mouse endothelial cells as assessed by two-way ANOVA (all values are normalized to 18S in undifferentiated mESCs). Values are mean +- SD (n = 3 independent experiments, * p < 0.001 by two-way ANOVA). (D) Western blotting carried out using anti-KDM4A and anti-KDM4C antibodies in sorted FLK1/VE-cadherin-double-positive cells derived from mESCs at day 6 of differentiation. Representative examples from three independent experiments are shown. (E) Time course of Kdm4a and Kdm4c expression determined by qRT-PCR during the day 1 to day 6 period of endothelial cel
- Submitted by
- Invitrogen Antibodies (provider)
- Main image
- Experimental details
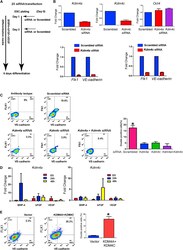
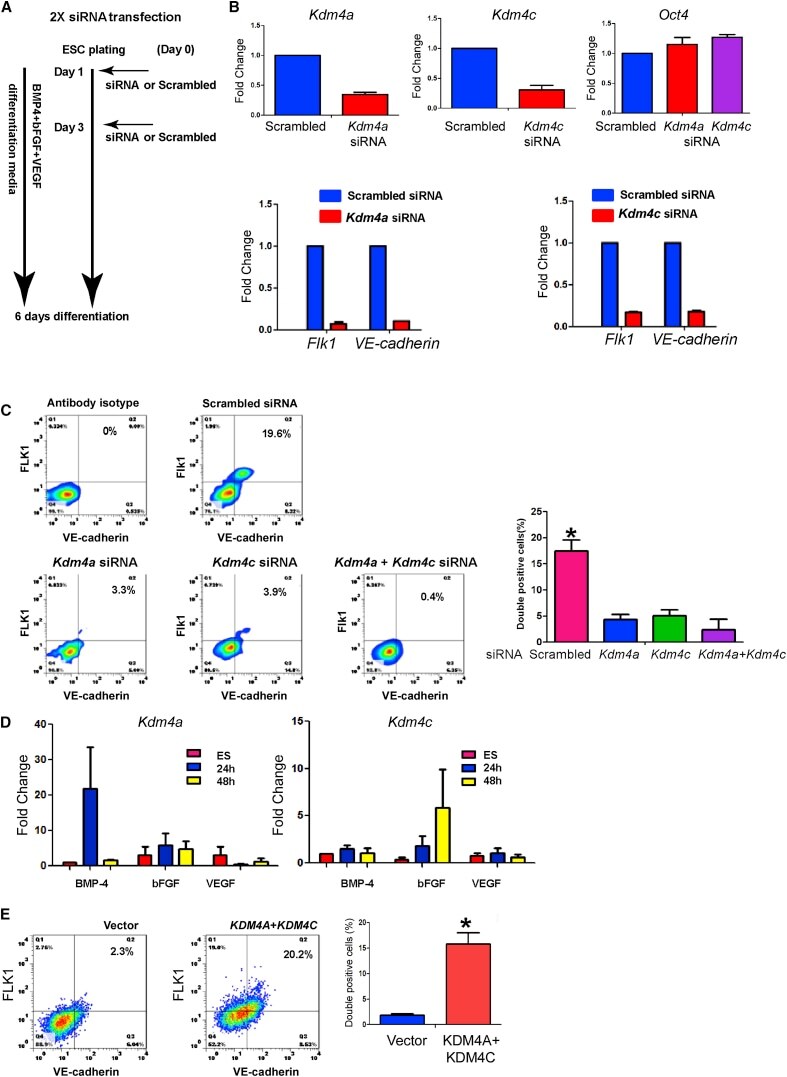
- Figure 2 KDM4A and KDM4C Mediate mESC Differentiation to Endothelial Cells (A) Diagram showing experimental protocol for siRNA treatment. mESC were transfected on days 1 and 3 to achieve maximum knockdown of protein. The cells were differentiated in medium containing BMP-4, bFGF, and VEGF for 6 days. (B) The effect of Kdm4a and Kdm4c knockdown on expression of endothelial-specific markers. Efficiency of Kdm4a and Kdm4c knockdown was 60%-80%. Oct4 expression was not suppressed by either Kdm4a or Kdm4c knockdown (n = 4 per group). Both Kdm4a and Kdm4c knockdown resulted in 90% and 80%, respectively, reduction in Flk1 and VE-cadherin expression on day 6 (n = 3 independent experiments). (C) Flow cytometry assessment of cell surface expression of Flk1 and VE-cadherin on day 6 of differentiation following treatment with scrambled, Kdm4a , Kdm4c , or Kdm4a and Kdm4c siRNAs. Quantification in the bar graph shows that the percentage of FLK1 and VE-cadherin double positive cells was reduced from 17% to less than 5%; FACS profile is representative (n = 3 independent experiments). Quantification values are mean +- SD; p < 0.05. Combining Kdm4a with Kdm4c siRNAs did not further suppress differentiation. (D) Treatment of mESCs with BMP-4 alone (2 ng/ml) is sufficient to induced Kdm4a expression at 24-hr post-stimulation. Treatment with bFGF alone (10 ng/ml) induced Kdm4c expression at 48-hr post-stimulation. Error bars represent mean +- SD (n = 3 independent experiments). VEGF stimulation
- Submitted by
- Invitrogen Antibodies (provider)
- Main image

- Experimental details
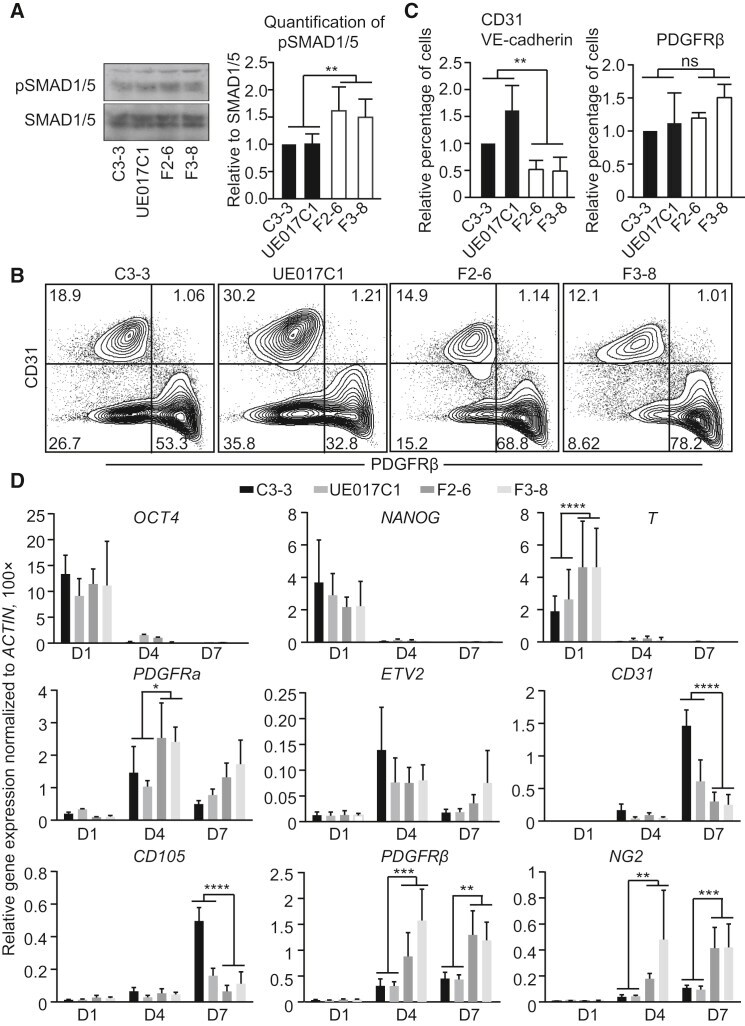
- Figure 1 Differentiation of FOP hiPSCs into ECs and Pericytes (A) Total SMAD1/5 and phospho-SMAD1/5 (pSMAD1/5) level in control hiPSCs (C3-3 and UE017C1) and FOP hiPSCs (F2-6 and F3-8). Note that the antibodies used here also may recognize SMAD8 and pSMAD8 bands. (B) FACS analysis of EC marker (CD31) or pericyte marker (PDGFRbeta) expression at differentiation days 10-12 is shown. (C) Quantification of the FACS analysis data for relative percentage of CD31 and VE-cadherin double-positive ECs and PDGFRbeta-positive pericytes. All values were adjusted to the control colony C3-3, which is defined as 1. (D) Relative gene expression at different time points during the differentiation. ACTIN was used to normalize gene expression. Data are presented as mean and SD from three independent experiments in (A), (C), and (D).
- Submitted by
- Invitrogen Antibodies (provider)
- Main image
- Experimental details
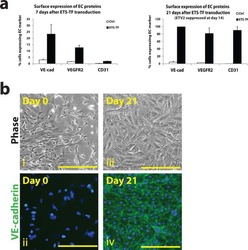
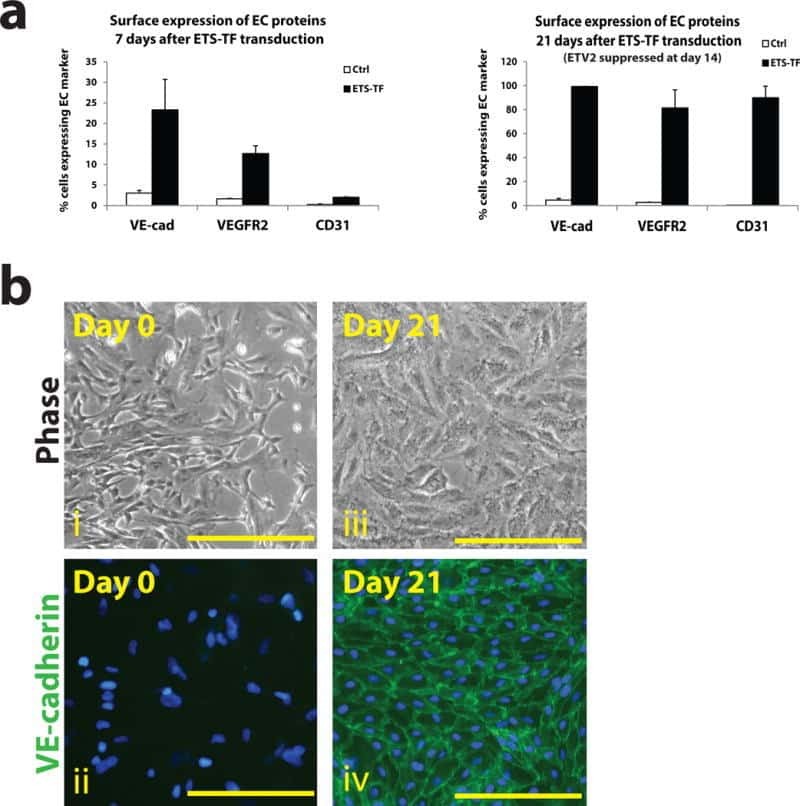
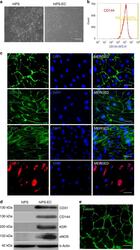
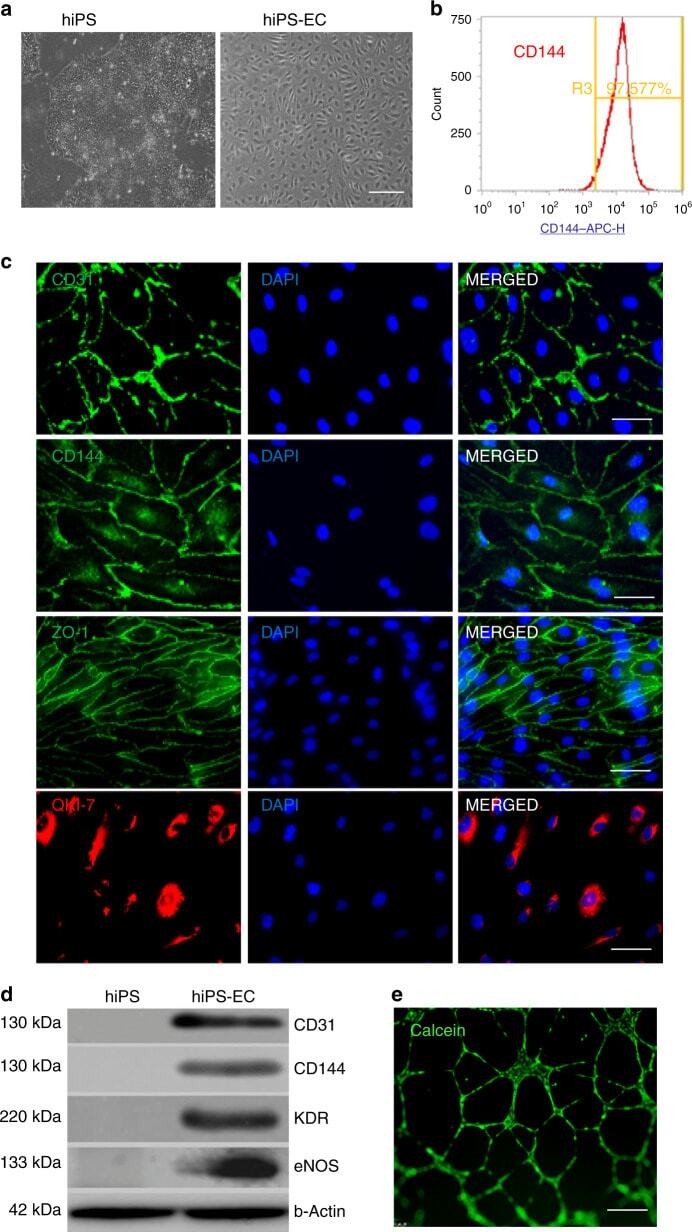
- Fig. 3 Human iPS cells differentiation toward ECs. Morphology of hiPSCs and their EC differentiated counterparts are shown by bright field microscopy. Scale bar: 50 mum ( a ). Flow cytometry showed the pure population of hiPS-derived ECs after MACS selection using CD144 magnetic beads ( b ). Immunofluorescence confocal image showing that the differentiated ECs expressed the EC-specific markers CD31, CD144, and ZO-1 localizing to cell-cell junction. QKI-7 displayed perinuclear cytoplasm localization. Scale bar: 25 mum ( c ). The expression of EC marker proteins CD31, CD144, KDR, and eNOS was shown by western blot ( d ). hiPS-ECs formed tube structure indicating their angiogenic capacity. Scale bar: 200 mum ( e ). Data are from n = 3 representative images. Source data are provided as a Source data file.
- Submitted by
- Invitrogen Antibodies (provider)
- Main image
- Experimental details
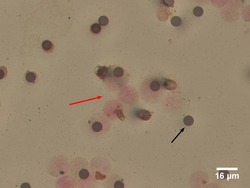
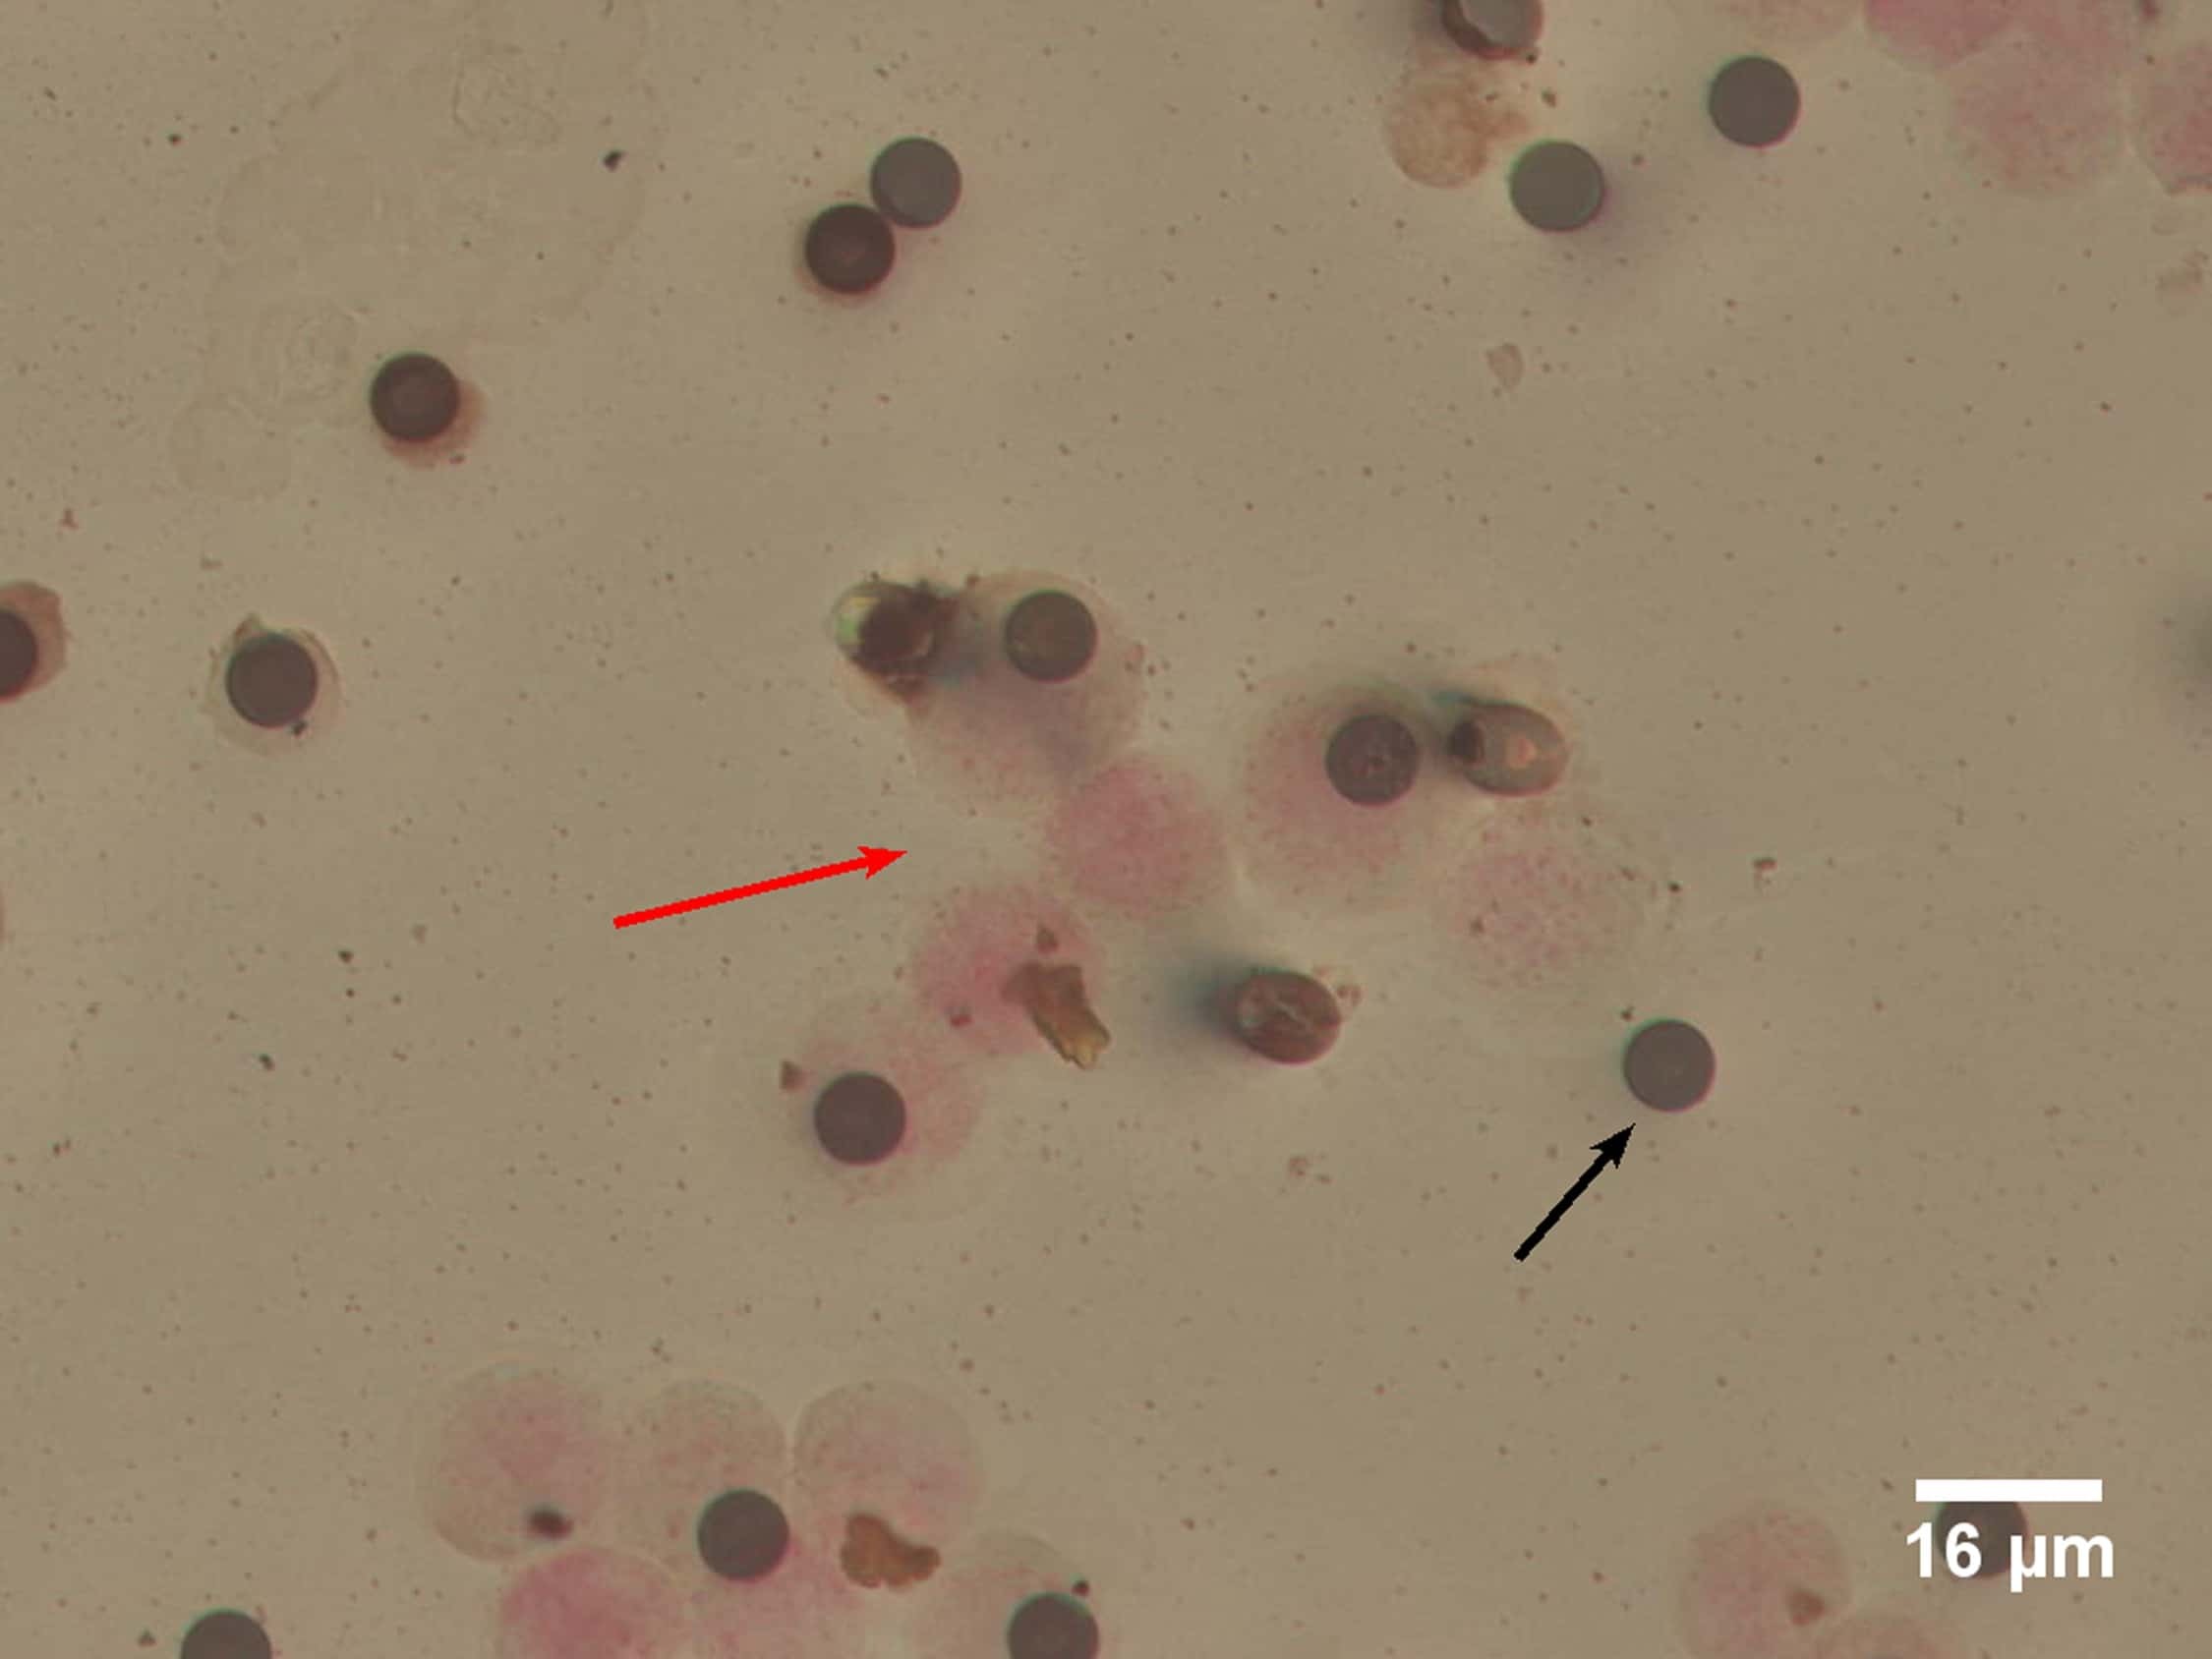
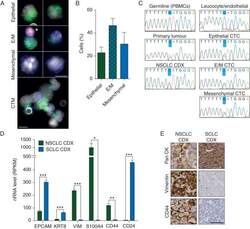
- Figure 2. Epithelial/mesenchymal nature of patient CTCs and CDX. CTCs were enriched via ISET filtration from a parallel blood sample to that which generated the CDX. The ISET filter was stained for pan-CK (green), vimentin (blue), CD45 and CD144 (pink), and DAPI (white). (A) Representative images and (B) quantitation of cells classed as epithelial, mixed epithelial/mesenchymal (E/M), and mesenchymal. Also shown is a circulating tumour microemboli (CTM) containing cells of all three phenotypes. *Leucocyte or endothelial cell; scale bar, 10 um. Quantitation carried out by two independent scorers on two ISET spots, each counting >150 CTCs per spot. Error bars, SEM. (C) Single cells from the ISET filter shown in A classed as a leucocyte/endothelial cell, epithelial CTC, mixed E/M CTC, or a mesenchymal CTC were captured by laser capture microdissection. The PACRG locus, shown by WES to be mutated in the CDX, was Sanger sequenced in DNA extracted from the captured CTCs and green fluorescent cells (leucocytes or endothelial cells), from the patients PBMCs (germline sample), from their primary tumour biopsy and from the passage 2 CDX shown in Figure 1 A-C. Highlighted base represents the mutated base. (D) RNAseq was carried out on passage 2 NSCLC CDX tumours and passage 3 CDX from two SCLC CDX models. Expression of EPCAM, KRT8, VIM, S100A4, CD44, and CD24 is displayed as RPKM values. Data represent mean of three independent tumours +- SEM. * P < 0.05; *** P < 0.001 according to two-t
