 Explore
 Validate
 Learn
Learn Immunocytochemistry
Antibody data
- Antibody Data
- Antigen structure
- References [7]
- Comments [0]
- Validations
- Immunocytochemistry [1]
- Other assay [12]
Submit
Validation data
Reference
Comment
Report error
- Product number
- PA1-860-A488 - Provider product page

- Provider
- Invitrogen Antibodies
- Product name
- HDAC1 Polyclonal Antibody, Alexa Fluor™ 488
- Antibody type
- Polyclonal
- Antigen
- Synthetic peptide
- Description
- Super Bright 436 can be excited with the violet laser line (405 nm) and emits at 436 nm. We recommend using a 450/50 bandpass filter, or equivalent. Please make sure that your instrument is capable of detecting this fluorochrome.
- Reactivity
- Human, Mouse, Rat, Canine, Hamster
- Host
- Rabbit
- Conjugate
- Green dye
- Isotype
- IgG
- Vial size
- 50 µL
- Concentration
- 1 mg/mL
- Storage
- 4° C, store in dark, DO NOT FREEZE!
Submitted references HDAC1 and HDAC2 control the specification of neural crest cells into peripheral glia.
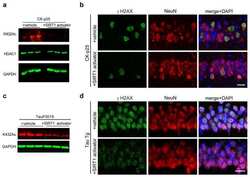
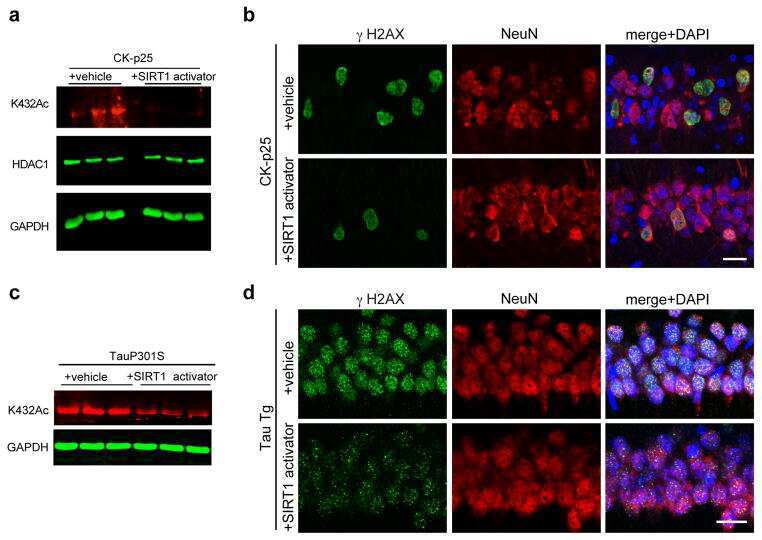
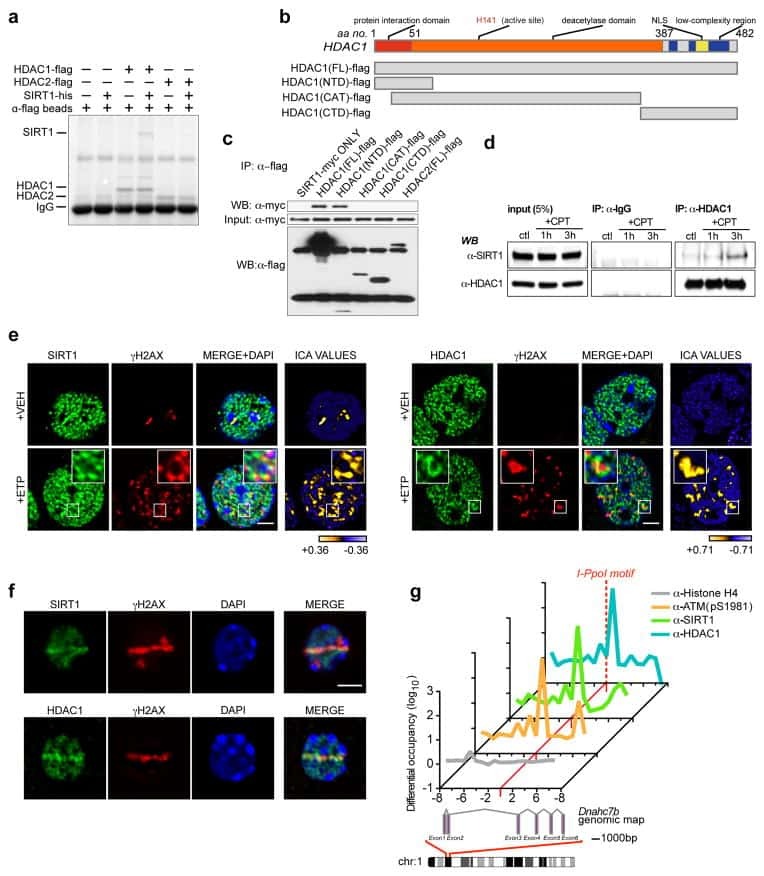
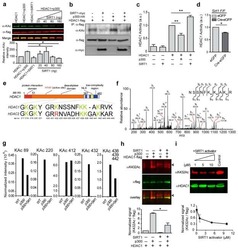
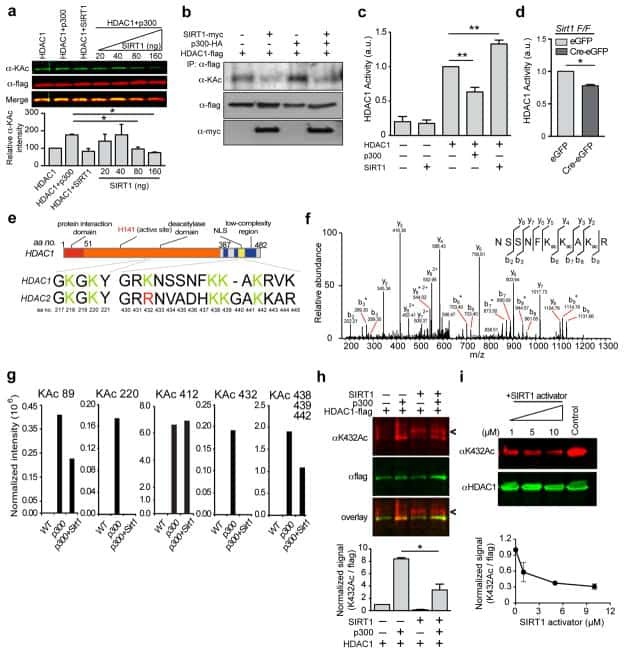
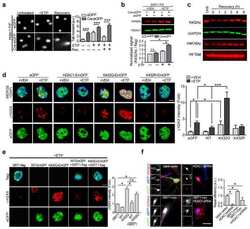
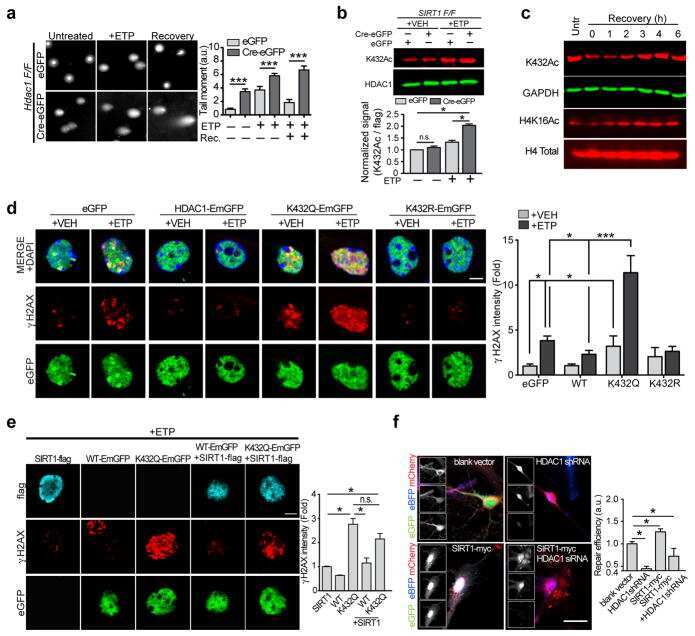
SIRT1 collaborates with ATM and HDAC1 to maintain genomic stability in neurons.
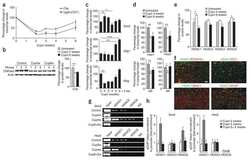
Histone Deacetylase Inhibitors and Mithramycin A Impact a Similar Neuroprotective Pathway at a Crossroad between Cancer and Neurodegeneration.
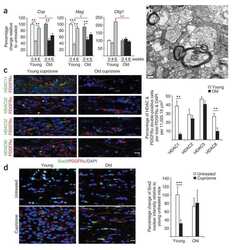
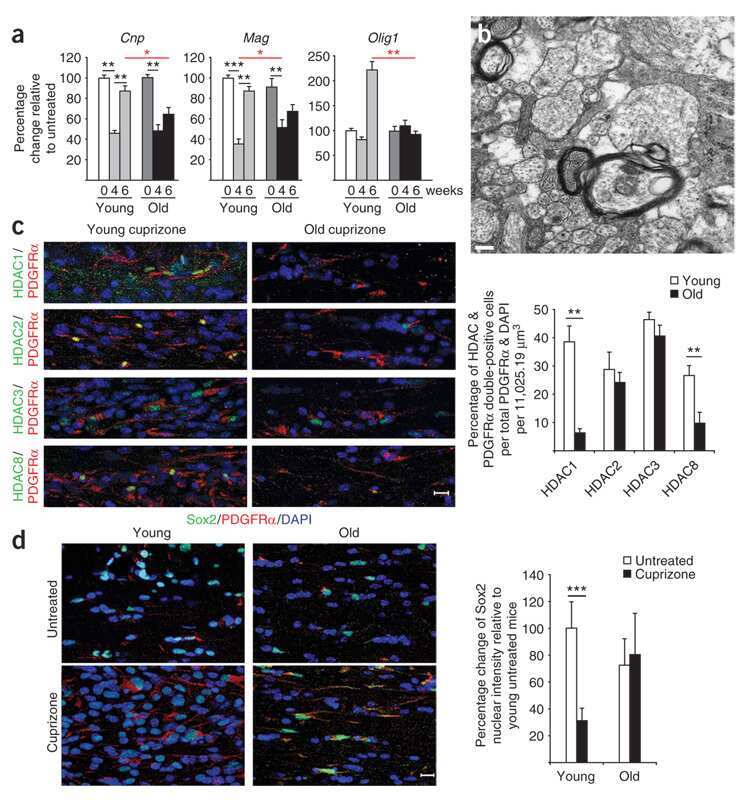
Age-dependent epigenetic control of differentiation inhibitors is critical for remyelination efficiency.
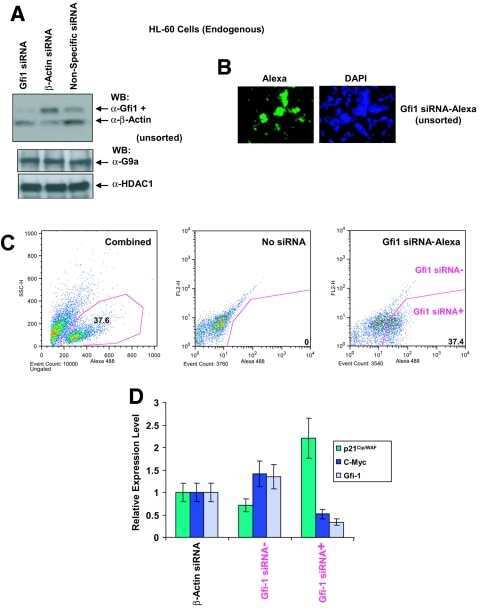
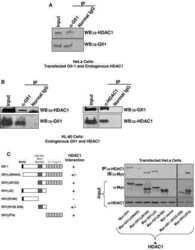
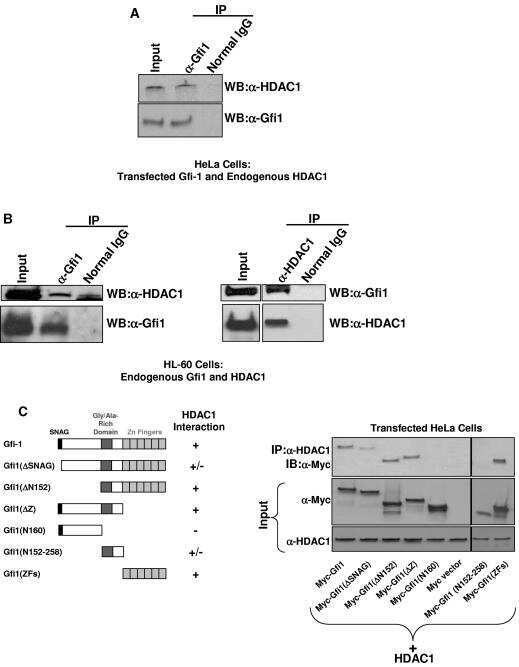
Gfi1 coordinates epigenetic repression of p21Cip/WAF1 by recruitment of histone lysine methyltransferase G9a and histone deacetylase 1.
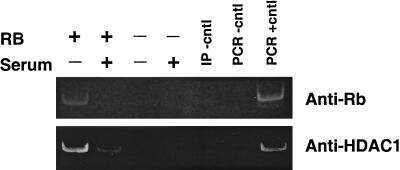
Retinoblastoma protein transcriptional repression through histone deacetylation of a single nucleosome.
Retinoblastoma protein transcriptional repression through histone deacetylation of a single nucleosome.
Jacob C, Lötscher P, Engler S, Baggiolini A, Varum Tavares S, Brügger V, John N, Büchmann-Møller S, Snider PL, Conway SJ, Yamaguchi T, Matthias P, Sommer L, Mantei N, Suter U
The Journal of neuroscience : the official journal of the Society for Neuroscience 2014 Apr 23;34(17):6112-22
The Journal of neuroscience : the official journal of the Society for Neuroscience 2014 Apr 23;34(17):6112-22
SIRT1 collaborates with ATM and HDAC1 to maintain genomic stability in neurons.
Dobbin MM, Madabhushi R, Pan L, Chen Y, Kim D, Gao J, Ahanonu B, Pao PC, Qiu Y, Zhao Y, Tsai LH
Nature neuroscience 2013 Aug;16(8):1008-15
Nature neuroscience 2013 Aug;16(8):1008-15
Histone Deacetylase Inhibitors and Mithramycin A Impact a Similar Neuroprotective Pathway at a Crossroad between Cancer and Neurodegeneration.
Sleiman SF, Berlin J, Basso M, Karuppagounder SS, Rohr J, Ratan RR
Pharmaceuticals (Basel, Switzerland) 2011 Aug 22;4(8):1183-1195
Pharmaceuticals (Basel, Switzerland) 2011 Aug 22;4(8):1183-1195
Age-dependent epigenetic control of differentiation inhibitors is critical for remyelination efficiency.
Shen S, Sandoval J, Swiss VA, Li J, Dupree J, Franklin RJ, Casaccia-Bonnefil P
Nature neuroscience 2008 Sep;11(9):1024-34
Nature neuroscience 2008 Sep;11(9):1024-34
Gfi1 coordinates epigenetic repression of p21Cip/WAF1 by recruitment of histone lysine methyltransferase G9a and histone deacetylase 1.
Duan Z, Zarebski A, Montoya-Durango D, Grimes HL, Horwitz M
Molecular and cellular biology 2005 Dec;25(23):10338-51
Molecular and cellular biology 2005 Dec;25(23):10338-51
Retinoblastoma protein transcriptional repression through histone deacetylation of a single nucleosome.
Morrison AJ, Sardet C, Herrera RE
Molecular and cellular biology 2002 Feb;22(3):856-65
Molecular and cellular biology 2002 Feb;22(3):856-65
Retinoblastoma protein transcriptional repression through histone deacetylation of a single nucleosome.
Morrison AJ, Sardet C, Herrera RE
Molecular and cellular biology 2002 Feb;22(3):856-65
Molecular and cellular biology 2002 Feb;22(3):856-65
No comments: Submit comment
Supportive validation
- Submitted by
- Invitrogen Antibodies (provider)
- Main image

- Experimental details
- Immunofluorescent analysis of HDAC-1 (green) in HeLa cells. The cells were fixed with 4% Paraformaldehyde in PBS for 15 minutes at room temperature, and blocked with 3% BSA in PBS (Product # 37525) for 30 minutes at room temperature. Cells were stained with a HDAC-1 Polyclonal Antibody, AlexaFluor 488 conjugate (Product # PA1-860-A488) at a dilution of 5 µg/mL in blocking buffer for 1 hour at room temperature protected from light. Nuclei (blue) were stained with Hoechst Dye (Product # 62249) at a dilution of 1:10,000 in blocking buffer. Images were taken on a Thermo Scientific ToxInsight Instrument at 20X magnification.
- Conjugate
- Green dye

Supportive validation
- Submitted by
- Invitrogen Antibodies (provider)
- Main image
- Experimental details
- NULL
- Conjugate
- Green dye
- Submitted by
- Invitrogen Antibodies (provider)
- Main image

- Experimental details
- NULL
- Conjugate
- Green dye
- Submitted by
- Invitrogen Antibodies (provider)
- Main image
- Experimental details
- NULL
- Conjugate
- Green dye
- Submitted by
- Invitrogen Antibodies (provider)
- Main image
- Experimental details
- NULL
- Conjugate
- Green dye
- Submitted by
- Invitrogen Antibodies (provider)
- Main image

- Experimental details
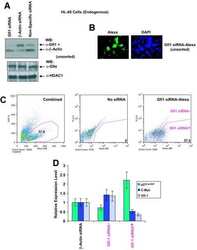
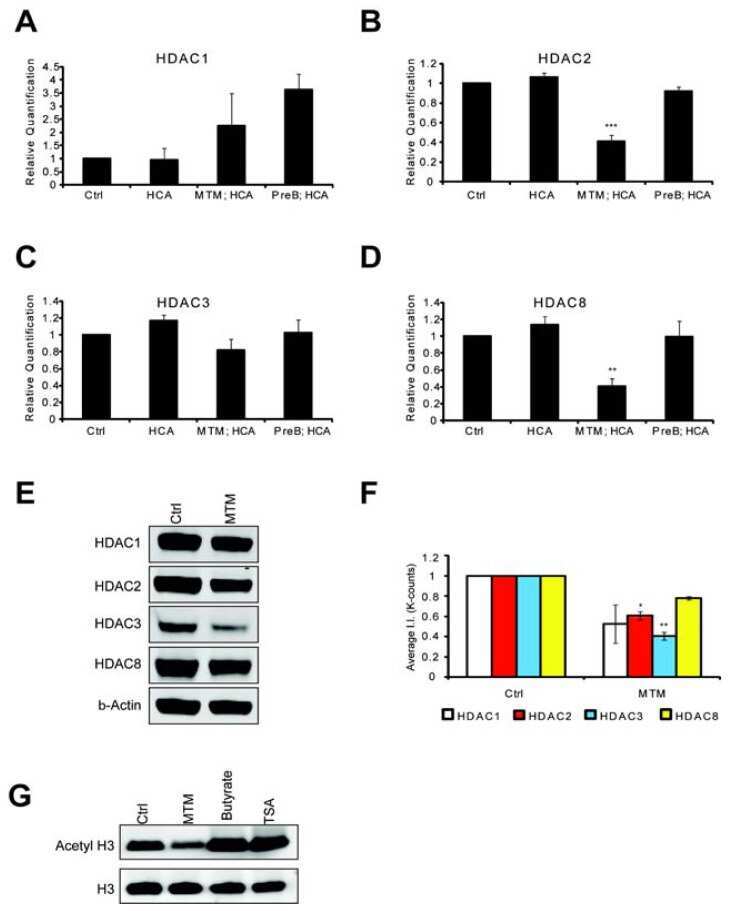
- Figure 3 MTM affects class 1 HDAC expression levels. Real time RTPCR shows that MTM (300 nM) does not significantly affect HDAC1 ( A ) and HDAC3 ( C ) expression levels; whereas it significantly reduces HDAC2 ( B ) and HDAC8 ( D ) expression levels. These changes covary with neuroprotection by MTM as the non-protective analog PreB (300 nM) has no effect on the expression of these genes. Cells were treated for five hours and the experiments were repeated three times. ( E ): Western Blots show that MTM treatment reduces the protein levels of class 1 HDACs. ( F ): Quantification of three different western blots reveals that only HDAC2 and HDAC3 protein levels are significantly affected by MTM treatment. ( G ): Unlike sodium butyrate (5 mM) and TSA (0.66 muM), MTM does not induce acetylation of histone H3. For the western blot experiments, cells were treated with the compounds for 48 hours and experiments were repeated three times. Statistical analysis was conducted by 1way ANOVA followed by the Dunnett post test. Significant levels compared to control treatment alone. *: p < 0.05 and **: p < 0.01 and ***: p < 0.0001.
- Conjugate
- Green dye
- Submitted by
- Invitrogen Antibodies (provider)
- Main image

- Experimental details
- Figure 4 MTM affects class 1 HDAC expression levels. ( A ) Western blot analysis reveals that Myc knockdown using ShRNA significantly affects class I HDAC protein levels. ( B ) Quantification of Western blots. Statistical analysis was conducted by 1way ANOVA followed by the Dunnett post test. Significant levels compared to control shRNA alone. * p < 0.05; and ** p < 0.01; and *** p < 0.0001.
- Conjugate
- Green dye

- Submitted by
- Invitrogen Antibodies (provider)
- Main image

- Experimental details
- NULL
- Conjugate
- Green dye
- Submitted by
- Invitrogen Antibodies (provider)
- Main image
- Experimental details
- NULL
- Conjugate
- Green dye
- Submitted by
- Invitrogen Antibodies (provider)
- Main image
- Experimental details
- NULL
- Conjugate
- Green dye
- Submitted by
- Invitrogen Antibodies (provider)
- Main image
- Experimental details
- NULL
- Conjugate
- Green dye

- Submitted by
- Invitrogen Antibodies (provider)
- Main image
- Experimental details
- NULL
- Conjugate
- Green dye
- Submitted by
- Invitrogen Antibodies (provider)
- Main image

- Experimental details
- NULL
- Conjugate
- Green dye
