 Explore
 Validate
 Learn
Learn32-1400
antibody from Invitrogen Antibodies
Targeting: E2F1
RBBP3, RBP3
 Western blot
 Immunoprecipitation Immunohistochemistry
 Flow cytometry Chromatin Immunoprecipitation Other assay
Antibody data
- Antibody Data
- Antigen structure
- References [11]
- Comments [0]
- Validations
- Flow cytometry [1]
- Chromatin Immunoprecipitation [2]
- Other assay [16]
Submit
Validation data
Reference
Comment
Report error
- Product number
- 32-1400 - Provider product page

- Provider
- Invitrogen Antibodies
- Product name
- E2F1 Monoclonal Antibody (KH95)
- Antibody type
- Monoclonal
- Antigen
- Recombinant full-length protein
- Reactivity
- Human, Mouse, Rat
- Host
- Mouse
- Isotype
- IgG
- Antibody clone number
- KH95
- Vial size
- 100 μg
- Concentration
- 0.5 mg/mL
- Storage
- -20°C
Submitted references Large Multicohort Study Reveals a Prostate Cancer Susceptibility Allele at 5p15 Regulating TERT via Androgen Signaling-Orchestrated Chromatin Binding of E2F1 and MYC.
MDM2's dual mRNA binding domains co-ordinate its oncogenic and tumour suppressor activities.
Pyruvate Dehydrogenase Kinase 4 Deficiency Results in Expedited Cellular Proliferation through E2F1-Mediated Increase of Cyclins.
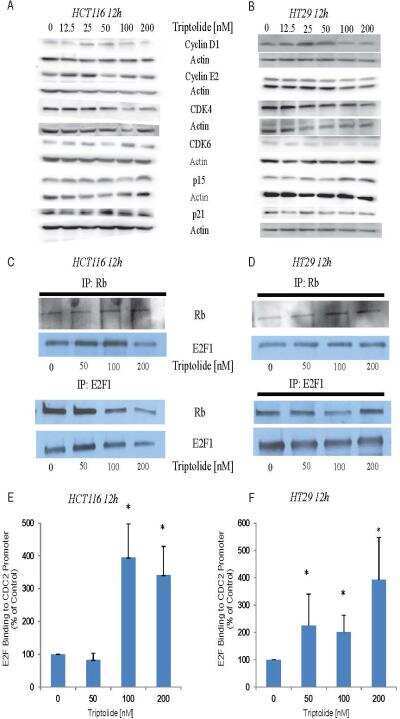
Triptolide abrogates growth of colon cancer and induces cell cycle arrest by inhibiting transcriptional activation of E2F.
Repair of oxidative DNA damage, cell-cycle regulation and neuronal death may influence the clinical manifestation of Alzheimer's disease.
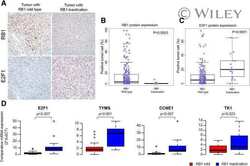
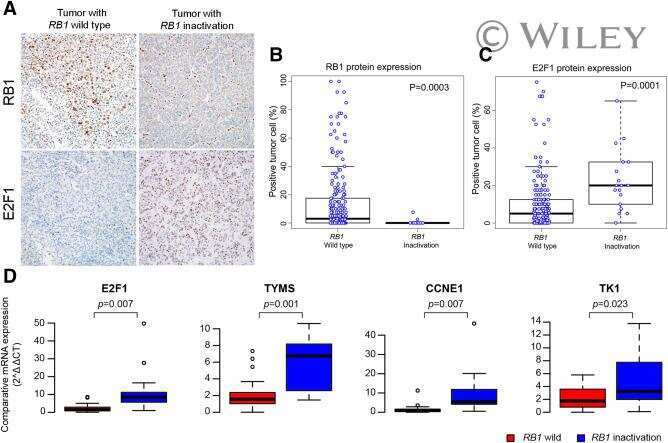
Genomic portrait of resectable hepatocellular carcinomas: implications of RB1 and FGF19 aberrations for patient stratification.
Identification of prognostic biomarkers for glioblastomas using protein expression profiling.
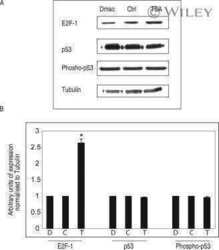
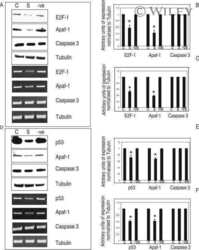
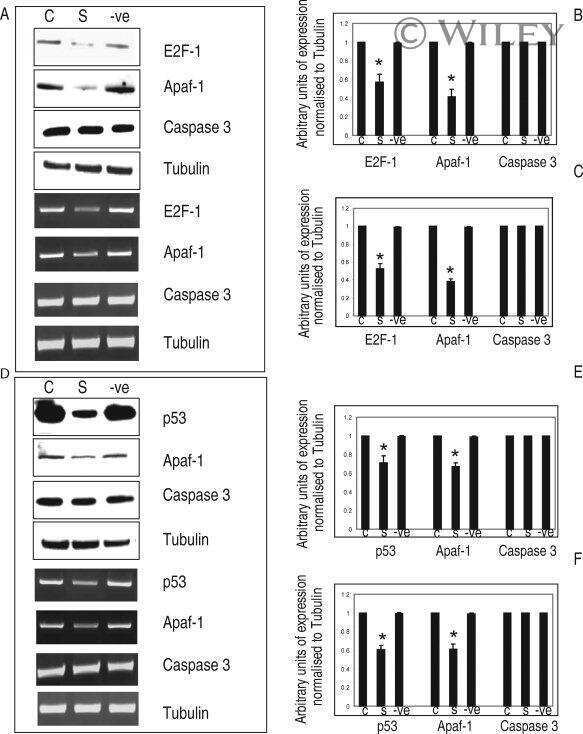
Histone deacetylase activity in conjunction with E2F-1 and p53 regulates Apaf-1 expression in 661W cells and the retina.
Impact of E2F-1 expression on clinical outcome of gastric adenocarcinoma patients with adjuvant chemoradiation therapy.
Overexpression of N-Myc rapidly causes acute myeloid leukemia in mice.
The novel ETS factor TEL2 cooperates with Myc in B lymphomagenesis.
Dong X, Zhang Q, Hao J, Xie Q, Xu B, Zhang P, Lu H, Huang Q, Yang T, Wei GH, Na R, Gao P
Frontiers in oncology 2021;11:754206
Frontiers in oncology 2021;11:754206
MDM2's dual mRNA binding domains co-ordinate its oncogenic and tumour suppressor activities.
Gnanasundram SV, Malbert-Colas L, Chen S, Fusée L, Daskalogianni C, Muller P, Salomao N, Fåhraeus R
Nucleic acids research 2020 Jul 9;48(12):6775-6787
Nucleic acids research 2020 Jul 9;48(12):6775-6787
Pyruvate Dehydrogenase Kinase 4 Deficiency Results in Expedited Cellular Proliferation through E2F1-Mediated Increase of Cyclins.
Choiniere J, Wu J, Wang L
Molecular pharmacology 2017 Mar;91(3):189-196
Molecular pharmacology 2017 Mar;91(3):189-196
Triptolide abrogates growth of colon cancer and induces cell cycle arrest by inhibiting transcriptional activation of E2F.
Oliveira A, Beyer G, Chugh R, Skube SJ, Majumder K, Banerjee S, Sangwan V, Li L, Dawra R, Subramanian S, Saluja A, Dudeja V
Laboratory investigation; a journal of technical methods and pathology 2015 Jun;95(6):648-659
Laboratory investigation; a journal of technical methods and pathology 2015 Jun;95(6):648-659
Repair of oxidative DNA damage, cell-cycle regulation and neuronal death may influence the clinical manifestation of Alzheimer's disease.
Silva AR, Santos AC, Farfel JM, Grinberg LT, Ferretti RE, Campos AH, Cunha IW, Begnami MD, Rocha RM, Carraro DM, de Bragança Pereira CA, Jacob-Filho W, Brentani H
PloS one 2014;9(6):e99897
PloS one 2014;9(6):e99897
Genomic portrait of resectable hepatocellular carcinomas: implications of RB1 and FGF19 aberrations for patient stratification.
Ahn SM, Jang SJ, Shim JH, Kim D, Hong SM, Sung CO, Baek D, Haq F, Ansari AA, Lee SY, Chun SM, Choi S, Choi HJ, Kim J, Kim S, Hwang S, Lee YJ, Lee JE, Jung WR, Jang HY, Yang E, Sung WK, Lee NP, Mao M, Lee C, Zucman-Rossi J, Yu E, Lee HC, Kong G
Hepatology (Baltimore, Md.) 2014 Dec;60(6):1972-82
Hepatology (Baltimore, Md.) 2014 Dec;60(6):1972-82
Identification of prognostic biomarkers for glioblastomas using protein expression profiling.
Jung Y, Joo KM, Seong DH, Choi YL, Kong DS, Kim Y, Kim MH, Jin J, Suh YL, Seol HJ, Shin CS, Lee JI, Kim JH, Song SY, Nam DH
International journal of oncology 2012 Apr;40(4):1122-32
International journal of oncology 2012 Apr;40(4):1122-32
Histone deacetylase activity in conjunction with E2F-1 and p53 regulates Apaf-1 expression in 661W cells and the retina.
Wallace DM, Cotter TG
Journal of neuroscience research 2009 Mar;87(4):887-905
Journal of neuroscience research 2009 Mar;87(4):887-905
Impact of E2F-1 expression on clinical outcome of gastric adenocarcinoma patients with adjuvant chemoradiation therapy.
Lee J, Park CK, Park JO, Lim T, Park YS, Lim HY, Lee I, Sohn TS, Noh JH, Heo JS, Kim S, Lim DH, Kim KM, Kang WK
Clinical cancer research : an official journal of the American Association for Cancer Research 2008 Jan 1;14(1):82-8
Clinical cancer research : an official journal of the American Association for Cancer Research 2008 Jan 1;14(1):82-8
Overexpression of N-Myc rapidly causes acute myeloid leukemia in mice.
Kawagoe H, Kandilci A, Kranenburg TA, Grosveld GC
Cancer research 2007 Nov 15;67(22):10677-85
Cancer research 2007 Nov 15;67(22):10677-85
The novel ETS factor TEL2 cooperates with Myc in B lymphomagenesis.
Cardone M, Kandilci A, Carella C, Nilsson JA, Brennan JA, Sirma S, Ozbek U, Boyd K, Cleveland JL, Grosveld GC
Molecular and cellular biology 2005 Mar;25(6):2395-405
Molecular and cellular biology 2005 Mar;25(6):2395-405
No comments: Submit comment
Supportive validation
- Submitted by
- Invitrogen Antibodies (provider)
- Main image
- Experimental details
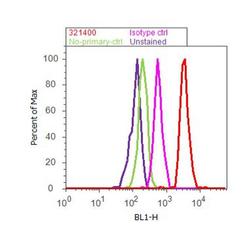
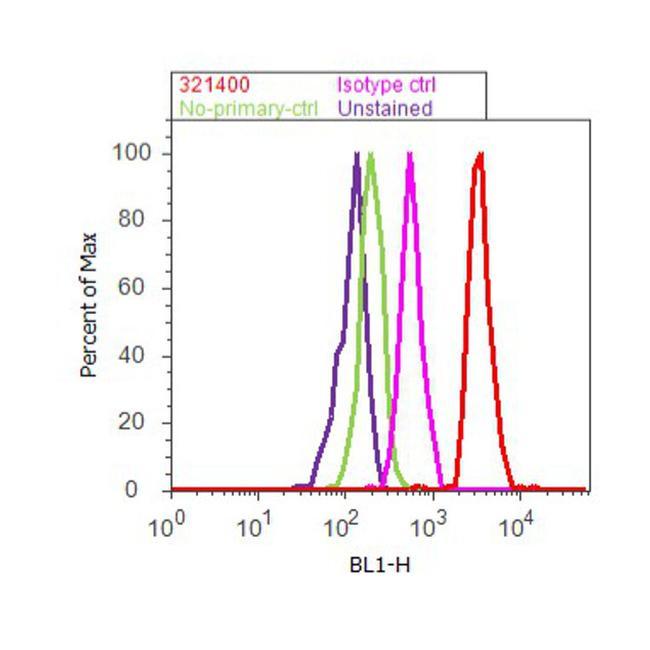
- Flow cytometry analysis of E2F-1 was done on HeLa cells. Cells were fixed with 70% ethanol for 10 minutes, permeabilized with 0.25% Triton™ X-100 for 20 minutes, and blocked with 5% BSA for 30 minutes at room temperature. Cells were labeled with E2F-1 Mouse Monoclonal Antibody (321400, red histogram) or with mouse isotype control (pink histogram) at 3-5 ug/million cells in 2.5% BSA. After incubation at room temperature for 2 hours, the cells were labeled with Alexa Fluor® 488 Rabbit Anti-Mouse Secondary Antibody (A11059) at a dilution of 1:400 for 30 minutes at room temperature. The representative 10,000 cells were acquired and analyzed for each sample using an Attune® Acoustic Focusing Cytometer. The purple histogram represents unstained control cells and the green histogram represents no-primary-antibody control.
Supportive validation
- Submitted by
- Invitrogen Antibodies (provider)
- Main image
- Experimental details
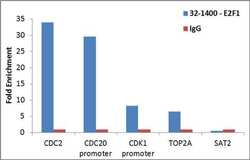
- Enrichment of endogenous E2F1 protein at specific gene loci using Anti-E2F1 Antibody: Chromatin Immunoprecipitation (ChIP) was performed using Anti-E2F1 Mouse Monoclonal Antibody (Product # 32-1400, 4 ug) on sheared chromatin from 2 million HeLa cells using the MAGnify ChIP System (Product # 49-2024). Normal Rabbit IgG was used as a negative IP control. The purified DNA was analyzed by qPCR with PCR primer pairs over CDC2, CDC20 promoter, CDK1 promoter, TOP2A (active) and SAT2 satellite repeats (inactive). Data is presented as fold enrichment of the antibody signal versus the negative control IgG using the comparative CT method.

- Submitted by
- Invitrogen Antibodies (provider)
- Main image

- Experimental details
- Enrichment of endogenous E2F1 protein at specific gene loci using Anti-E2F1 Antibody: Chromatin Immunoprecipitation (ChIP) was performed using Anti-E2F1 Mouse Monoclonal Antibody (Product # 32-1400, 4 ug) on sheared chromatin from 2 million HeLa cells using the MAGnify ChIP System (Product # 49-2024). Normal Rabbit IgG was used as a negative IP control. The purified DNA was analyzed by qPCR with PCR primer pairs over CDC2, CDC20 promoter, CDK1 promoter, TOP2A (active) and SAT2 satellite repeats (inactive). Data is presented as fold enrichment of the antibody signal versus the negative control IgG using the comparative CT method.

Supportive validation
- Submitted by
- Invitrogen Antibodies (provider)
- Main image
- Experimental details
- NULL
- Submitted by
- Invitrogen Antibodies (provider)
- Main image
- Experimental details
- NULL

- Submitted by
- Invitrogen Antibodies (provider)
- Main image
- Experimental details
- NULL
- Submitted by
- Invitrogen Antibodies (provider)
- Main image
- Experimental details
- NULL
- Submitted by
- Invitrogen Antibodies (provider)
- Main image
- Experimental details
- NULL
- Submitted by
- Invitrogen Antibodies (provider)
- Main image
- Experimental details
- NULL

- Submitted by
- Invitrogen Antibodies (provider)
- Main image
- Experimental details
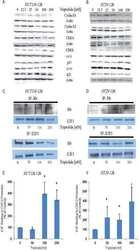
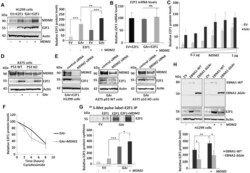
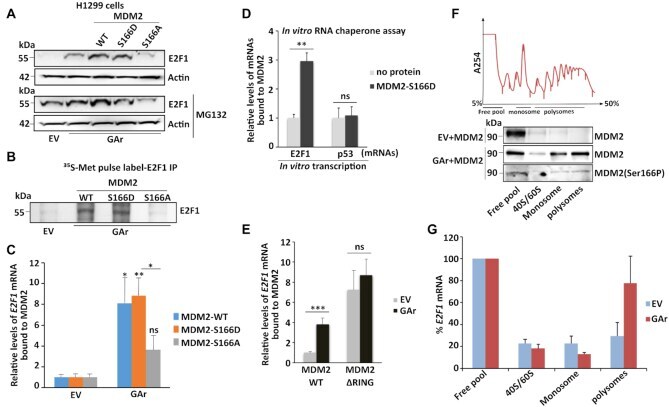
- Figure 1. MDM2 regulates E2F1 synthesis during mRNA translation stress. ( A ) Western blot (WB) showing E2F1 levels in H1299 cells expressing MDM2 and E2F1 in normal (EV) conditions and during mRNA translation stress induced by the EBNA1-derived GAr. Panel (right) shows the quantification of E2F1 protein levels from three independent experiments. Actin levels were used for normalization. ( B ) The E2F1 mRNA levels were analyzed by RT-qPCR under conditions as indicated in (A). ( C ) Graph shows quantification of the E2F1 protein levels in H1299 cells expressing E2F1 under normal (EV) and mRNA translation stress (GAr) conditions with increasing amount of MDM2 (see also Supplementary Figure S2A ). ( D ) WB showing the levels of endogenous E2F1 in A375 cells (p53 WT) and in A375 cells lacking p53 (p53 KO) following mRNA translation stress conditions. ( E ) The levels of E2F1 in indicated cells following treatment with control siRNA and siRNAs against MDM2. ( F ) Quantification of E2F1 protein levels at indicated time points after cycloheximide treatment in H1299 cells expressing the GAr, with, or without, MDM2 (see also Supplementary Figure S1E ) ( G ) The rate of newly synthesized E2F1 protein levels is shown by autoradiograph of 35 S-Met Pulse labelled H1299 cells followed by E2F1 immunoprecipitation in the presence of proteasome inhibitor MG132. Graph below shows quantification and relative values of three independent experiments. ( H ) WB shows the levels of E2F1 in H1299 cel

- Submitted by
- Invitrogen Antibodies (provider)
- Main image
- Experimental details
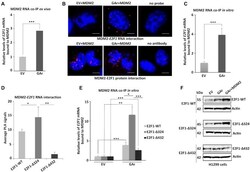
- Figure 2. MDM2 interacts with the E2F1 mRNA during GAr-induced mRNA translation stress. ( A ) Graph shows the fold enrichment of E2F1 mRNA co-immunoprecipitated with MDM2 (RNA co-IP) from H1299 cell lysates under normal (EV) and mRNA translation stress (GAr) conditions. ( B ) Proximity ligation assay (PLA) shows the MDM2 protein - E2F1 mRNA interactions (upper panel, red dots) and MDM2 - E2F1 protein-protein interactions (lower panel, red dots) in situ under normal and translation stress conditions in H1299 cells. ( C ) The graph shows E2F1 mRNA bound to recombinant MDM2. Total mRNA was isolated from H1299 cell lysates expressing EV or the GAr and used for in vitro RNA co-IP with recombinant purified MDM2 protein followed by RT-qPCR against E2F1 mRNA. ( D ) PLA quantification (average number of dots per cell) of in situ MDM2 - E2F1 mRNA interactions using indicated E2F1-WT, E2F1-Delta324 and E2F1-Delta432 constructs in H1299 cells (see also Supplementary Figure S3 ). ( E ) Graph shows relative GAr-dependent enrichment of indicated E2F1 mRNAs bound to recombinant MDM2. ( F ) WB showing protein levels from indicated E2F1 constructs in H1299 cells expressing the GAr with, or without, over expressing MDM2. Actin was used as a loading control and the WB data shows one of three representative experiments. Statistical significance was calculated using t tests (*** P < 0.001, ** P < 0.01 and * P < 0.05) of three independent experiments. Scale bars 10 mum.

- Submitted by
- Invitrogen Antibodies (provider)
- Main image
- Experimental details
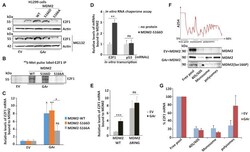
- Figure 3. MDM2 phosphorylation at serine 166 and the RING domain control MDM2 interaction with the E2F1 mRNA during translation stress. ( A ) WB showing E2F1 levels in H1299 cells expressing MDM2-WT, MDM2-S166D and the MDM2-S166A under normal and translation stress conditions in the presence (lower), or absence (upper) of the proteasome inhibitor MG132 (20 muM for 2 h). ( B ) Autoradiograph of 35 S-Met metabolic pulse labeling in the presence of MG132 (20 muM) followed by E2F1 immunoprecipitation shows the rate of newly synthesized E2F1 proteins in the presence of indicated MDM2 constructs in H1299 cells. ( C ) H1299 cells expressing the MDM2-WT, MDM2-166D or the MDM2-166A constructs. Total RNA was isolated from cells under normal or translation stress (GAr) conditions and the graph shows the relative amount of E2F1 mRNA bound to recombinant MDM2-WT, MDM2-S166D and MDM2-S166A proteins, respectively. (D) Graph shows the binding of recombinant MDM2 protein to E2F1 and p53 mRNAs transcribed in vitro in the presence, or absence, of MDM2-S166D protein. Following RNA synthesis, the mRNAs were isolated and proteins removed and the relative amount bound to recombinant MDM2 protein was estimated. ( E ) The relative levels of E2F1 mRNA bound to recombinant MDM2-WT and to an MDM2 lacking the C-terminal RING domain (MDM2-DeltaRING). Total RNA was isolated from H1299 cells lysates under indicated conditions. ( F ) Polysome profiling followed by WB analysis of pooled fractions under normal
- Submitted by
- Invitrogen Antibodies (provider)
- Main image

- Experimental details
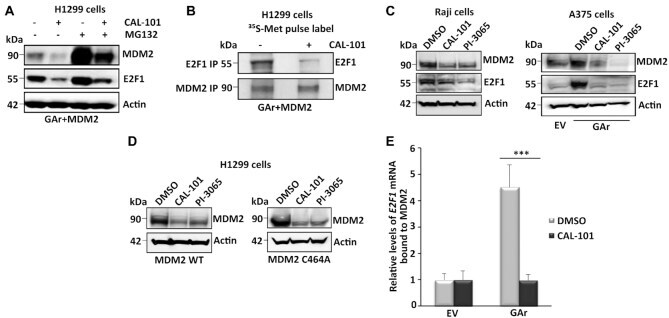
- Figure 4. PI3Kdelta regulates MDM2 stability and binding to the E2F1 mRNA. ( A ) WB shows the levels of MDM2 and E2F1 proteins upon treatment with the PI3Kdelta inhibitor CAL-101 (5 muM for 8 h) and the proteasome inhibitor MG132 (20 muM for 2 h) in cells expressing the GAr and MDM2. ( B ) Autoradiograph on 35 S-Met pulse labeling followed by immunoprecipitation using MDM2 or E2F1 antibodies from cells treated, or not, with CAL-101. ( C ) The levels of endogenous E2F1 and MDM2 in the EBV-carrying Burkitt's lymphoma Raji cells (left) following treatment with two PI3Kdelta inhibitors CAL-101 and PI-3065 (0.5 muM for 24 hours, respectively). Right panel shows the effect of the PI3Kdelta inhibitors on endogenous E2F1 and MDM2 expression in A375 cells expressing the GAr. ( D ) The levels of MDM2 WT and the MDM2-C464A mutant that prevents autoubiquitination, following treatment with two (CAL-101 and PI-3065) PI3Kdelta inhibitors (0.5 muM for 24 hours). ( E ) The relative levels of E2F1 mRNA bound to recombinant MDM2 protein. The RNA was isolated from cells treated with CAL-101 or DMSO. Actin was used a loading control in all WBs and represent one of three independent experiments. Statistical significance was calculated using t tests (*** P < 0.001, ** P < 0.01 and * P < 0.05).
- Submitted by
- Invitrogen Antibodies (provider)
- Main image
- Experimental details
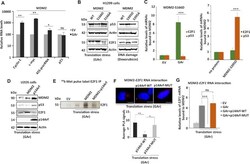
- Figure 5. MDM2's binding to the E2F1 mRNA is distinct from the binding to the p53 mRNA and blocked by the tumour suppressor p14Arf. ( A ) mRNA translation stress-mediated induction of E2F1 stimulates growth-promoting genes (cyclin E and c-myc) and ribosome biogenesis (45S pre-rRNA) in cells expressing MDM2. ( B ) WBs show the levels of p53 and E2F1 in cells expressing indicated MDM2 constructs under DNA damage (doxorubicin (1 muM for 4 h)) or mRNA translation stress conditions (GAr). ( C ) The relative levels of p53 or E2F1 mRNAs bound to indicated recombinant MDM2 proteins. The left graph shows recombinant MDM2-166D protein binding to indicated mRNAs isolated from cells expressing, or not, the GAr. The right graph shows the binding of indicated mRNAs derived from non-treated cells to a recombinant MDM2 carrying the ATM kinase MDM2-S395D phosphomimetic mutant. No MDM2 protein was used as reference value. ( D ) WBs show p53 and E2F1 levels in p14Arf U2OS cells expressing p14Arf or MDM2. ( E ) Autoradiograph shows the rate of E2F1 synthesis in the presence of MDM2 and the GAr with, or without, expression of p14Arf. ( F ) PLA shows the interactions between MDM2 and the E2F1 mRNA in cells expressing p14Arf, or an p14Arf that lacks the MDM2 binding domain (amino acids 2-14) (p14Arf-MUT). The graph below shows the quantification of interactions from three independent experiments. ( G ) The relative amount of E2F1 mRNA bound to recombinant MDM2. The RNA was isolated from cells
- Submitted by
- Invitrogen Antibodies (provider)
- Main image
- Experimental details
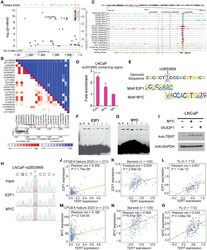
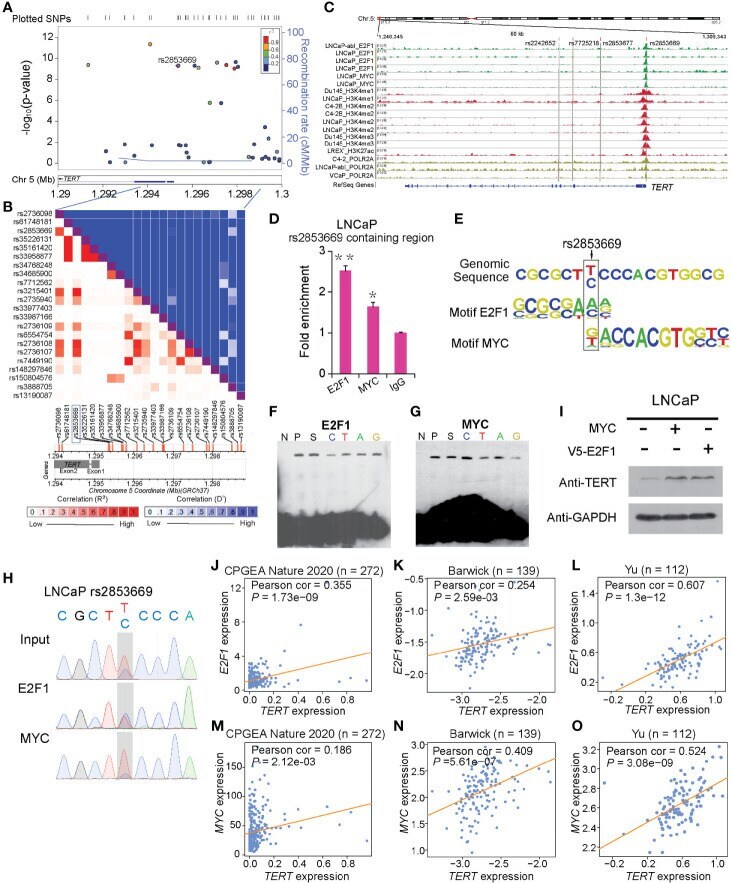
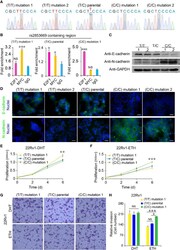
- Figure 1 rs2853669 modulated E2F1 and MYC binding to the TERT promoter region. (A) Regional plot of the associated SNPs at chr5:1.29mbp-1.30mbp. The plot showed the -log 10 p -values of association between the SNPs in this region and PCa. The intensity of red shading indicated the strength of LD ( r 2 ) with the index SNP (rs2853669). (B) LD matrix plot indicated the LD pattern in the 50-kb region around the 5'-UTR region of TERT based on 1000 Genome CEU population. (C) ChIP-seq enrichment signals showing the bindings of E2F1 and MYC at the TERT promoter region. (D) ChIP-qPCR confirmation of the chromatin bindings of E2F1 and MYC at the rs2853669-containing region in LNCaP cells over background levels using a nonspecific IgG antibody. (E) rs2853669 resided within the DNA-binding motifs of E2F1 and MYC. E2F1 was predicted to preferentially bind to C allele of rs2853669, while MYC favored T allele of rs2853669. (F, G) The C allele of rs2853669 showed stronger binding affinity for E2F1 than the T allele in an electrophoresis mobility shift assay (EMSA) (F) . The T allele of rs2853669 showed stronger binding affinity for MYC than the C allele in an EMSA (G) . Lane N represented no protein extract for DNA to bind. The binding of the consensus sequence to E2F1 (F) or MYC (G) (lane P) was competed by a scrambled sequence (lane S) and by sequences containing the C allele (lane C) and T allele (lane T) of rs2853669 or permutations of an A base (lane A) or G base (lane G) at the same c
- Submitted by
- Invitrogen Antibodies (provider)
- Main image
- Experimental details
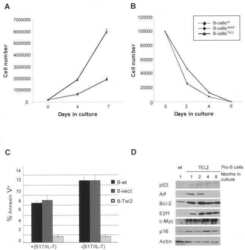
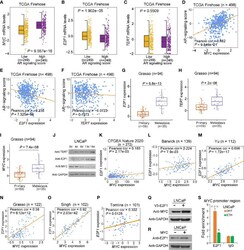
- Figure 2 Effect of AR singling on E2F1 , MYC , and TERT expression. (A , D) MYC was upregulated in the group with high AR signaling signature score ( SOX9 , RAN , TNK2 , EP300 , PXN , NCOA2 , AR , NRIP1 , NCOR1 , and NCOR2 ). MYC was significantly positively correlated with AR signaling score. (B , E) E2F1 was downregulated in AR signaling high group compared to AR signaling low group. E2F1 was negatively correlated with AR signaling score. (C, F) No significant correlation was observed for TERT upon the AR signaling signature in the TCGA cohort. The Z score sum of the ten-gene AR signaling signature was stratified based on the median score. p- values were calculated using Mann-Whitney U test. (G-I) mRNA levels of E2F1 (G) , TERT (H) , and MYC (I) were elevated in human benign, primary, and metastasis PCa in the Grasso cohort. p- values were calculated using Kruskal-Wallis test. (J) Western blot showing protein levels of TERT, E2F1, and MYC in LNCaP cells with hormone-deprived medium for the indicated days. GAPDH was used as a loading control. (K-O) Expression correlation of MYC with E2F1 in human prostate tissues. Scatter plot showing the direct correlation between MYC with E2F1 expression in the CPGEA cohort ( n = 272) (K) , Barwick cohort ( n = 139) (L) , Yu cohort ( n = 112) (M) , Grasso cohort ( n = 122) (N) Singh cohort ( n = 102) (O) , and Tomlins ( n = 101) (P) . (Q, R) Western blot showing the protein level of MYC in LNCaP cells overexpressing V5 tagged E2F1 (P) and

- Submitted by
- Invitrogen Antibodies (provider)
- Main image
- Experimental details
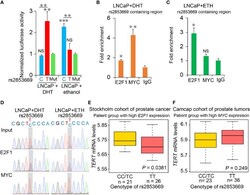
- Figure 3 The binding preference of E2F1 and MYC at rs2853669 affected TERT expression. (A) Luciferase reporter assays showing increased promoter activity of the T allele at rs2853669 relative to the C allele in LNCaP cells after androgen treatment. The promoter activity of the T allele at rs2853669 relative to the C allele was diminished in LNCaP cells after removing androgen. Mut, deletion of MYC or E2F1-binding site with rs2853669. (B, C) ChIP-qPCR results showed MYC and E2F1 chromatin binding at rs2853669-containing region in LNCaP cells under androgen stimulation (B) or withdrawal (C) . (D) MYC or E2F1 favored binding to the T or C allele at rs2853669 with or without androgen treatment determined by ChIP followed by Sanger sequencing. (E, F) The association between rs2853669 genotype and TERT expression in prostate tumor samples. C allele of rs2853669 was significantly associated with elevated mRNA expression of TERT in E2F1 high expression group (E) ; Homozygous TT genotype of rs2853669 was correlated with higher expression of TERT in MYC high expression group (F) . Patients were pre-stratified based on median expression of E2F1 or MYC . p- values were examined by a log-rank test. Error bars, s.e.m. n = 3 technical replicates. * p < 0.05, ** p < 0.01, *** p < 0.001, Student's t tests. NS, Non significance.

- Submitted by
- Invitrogen Antibodies (provider)
- Main image
- Experimental details
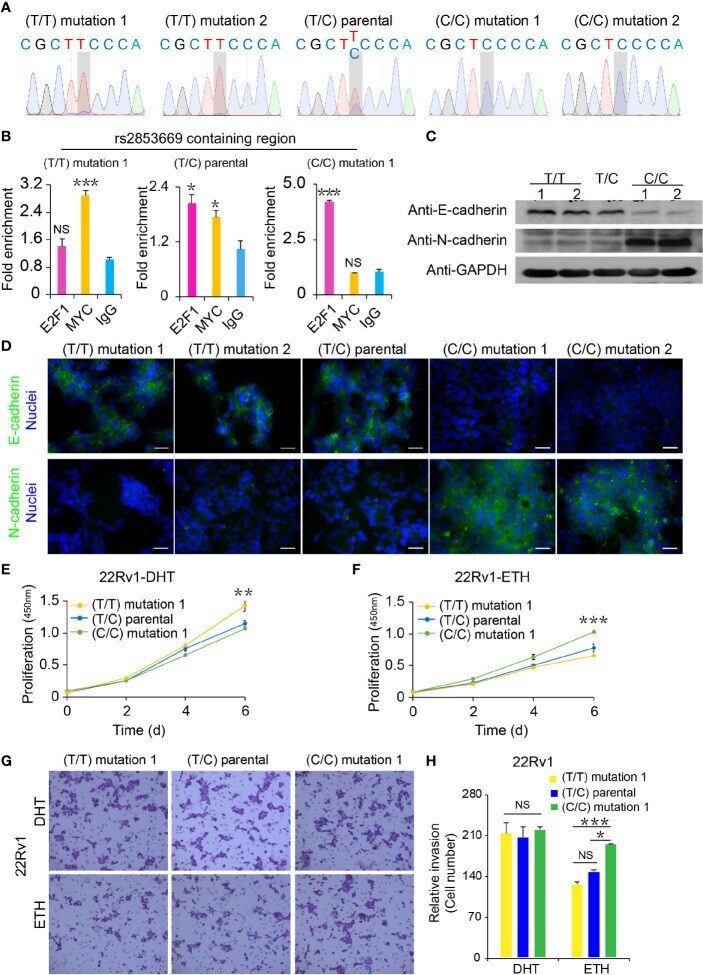
- Figure 4 Functional analysis of CRISPR/Cas9-modified PCa cells with different rs2853669 genotype. (A) Sanger sequencing of CRISPR/Cas9-modified and parental 22Rv1 cells. (B) Chromatin enrichment of E2F1 and MYC at the rs2853669 site measured by ChIP-qPCR. (C) Western blot showing the protein levels of E-cadherin and N-cadherin in CRISPR/Cas9-modified and parental 22Rv1 cell lines. GAPDH was used as a loading control. (D) Representative microscopy analysis of E-cadherin (green; upper panels) and N-cadherin (green; lower panels) expression in CRISPR/Cas9-modified and parental 22Rv1 cell lines. Nuclei were counterstained with DAPI (blue). Scale bars, 20 mum. (E, F) Cell proliferation analysis of the TT genotype, TC genotype, and CC genotype at rs2853669 in 22Rv1 cells under androgen stimulation (E) or withdrawal (F) , mean +- SD of triplicate experiments. (G, H) Representative images of invasion (G) assays for cells under androgen stimulation or withdrawal. Scale bars, 100 um. The number of cells in invasion (H) assays. +- s.e.m. from three biological replicates, * p < 0.05, ** p < 0.01, *** p < 0.001, Student's t test. NS, Non significance.
- Submitted by
- Invitrogen Antibodies (provider)
- Main image
- Experimental details
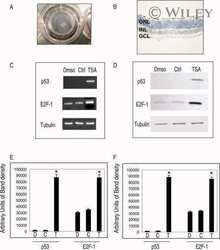
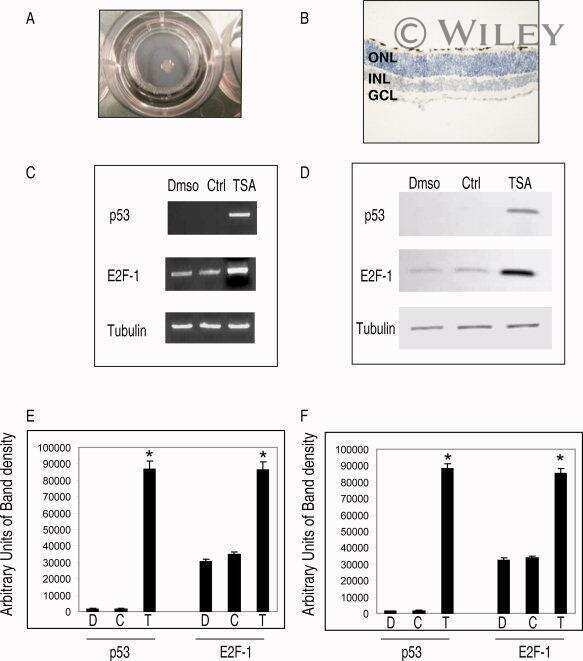
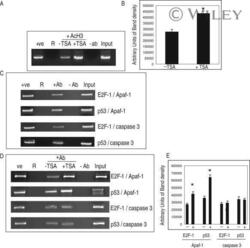
- 7 Inhibition of HDAC activity results in acetylation of the Apaf-1 promoter and increased binding of E2F-1 and p53. ChIP assays: +ve, genomic DNA isolated from 661W cells used as a positive control for PCR reaction; R, random sequence outside E2F-1/p53 binding area; +ab, promoter-specific-primer in the presence of antibody specific to E2F-1, p53, or H4; -1degab, assay performed in the absence of E2F-1, p53, or H4 antibody; Input, input sample of total chromatin isolated. A: Untreated 661W cells were fixed in formaldehyde and immunoprecipitated with an antibody specific to the acetylated form of histone 4. Isolated DNA was analyzed by using primers flanking regions incorporating a region of the core promoter. As can be seen, treatment of 661W cells with TSA results in increased acetylation levels of the Apaf-1 promoter. B: Results are representative of three individual experiments, and statistical analysis was performed. *Significant at P < 0.05. C: Untreated 661W cells were formaldehyde fixed and immunoprecipitated with antibodies specific to E2F-1 or p53 and isolated DNA analyzed by using primers flanking regions incorporating identified E2F-1 and p53 binding sites in the Apaf-1 and caspase 3 promoters. Both E2F-1 and p53 bind to the Apaf-1 and caspase 3 promoters. D: Untreated (-TSA) or TSA treated (+TSA) (100 nM for 20 hr) 661W cells were fixed and immunoprecipitated with antibodies specific to E2F-1 or p53 and isolated DNA analyzed by using primers flanking regions in
