Explore
 Validate
 Learn
Learn Western blot
 Immunocytochemistry
Antibody data
- Antibody Data
- Antigen structure
- References [16]
- Comments [0]
- Validations
- Immunocytochemistry [2]
- Immunohistochemistry [1]
- Other assay [10]
Submit
Validation data
Reference
Comment
Report error
- Product number
- MA5-14889 - Provider product page

- Provider
- Invitrogen Antibodies
- Product name
- PPAR gamma Monoclonal Antibody (K.242.9)
- Antibody type
- Monoclonal
- Antigen
- Synthetic peptide
- Description
- It is not recommended to aliquot this antibody.
- Reactivity
- Human, Mouse
- Host
- Rabbit
- Isotype
- IgG
- Antibody clone number
- K.242.9
- Vial size
- 100 μL
- Concentration
- 125 μg/mL
- Storage
- -20°C
Submitted references Hepatic PPARα Is Destabilized by SIRT1 Deacetylase in Undernourished Male Mice.
Cell fate determining molecular switches and signaling pathways in Pax7-expressing somitic mesoderm.
β-RA Targets Mitochondrial Metabolism and Adipogenesis, Leading to Therapeutic Benefits against CoQ Deficiency and Age-Related Overweight.
Defining the lineage of thermogenic perivascular adipose tissue.
Protective Effects of Foam Rolling against Inflammation and Notexin Induced Muscle Damage in Rats.
Dermal Adipocyte Lipolysis and Myofibroblast Conversion Are Required for Efficient Skin Repair.
1α, 25-dihydroxy Vitamin D3 containing fractions of Catharanthus roseus leaf aqueous extract inhibit preadipocyte differentiation and induce lipolysis in 3T3-L1 cells.
Cross-talk between microtubules and the linker of nucleoskeleton complex plays a critical role in the adipogenesis of human adipose-derived stem cells.
Id1 Promotes Obesity by Suppressing Brown Adipose Thermogenesis and White Adipose Browning.
Cytoglobin: a potential marker for adipogenic differentiation in preadipocytes in vitro.
A new hope for obesity management: Boron inhibits adipogenesis in progenitor cells through the Wnt/β-catenin pathway.
DNA Topoisomerase IIα contributes to the early steps of adipogenesis in 3T3-L1 cells.
FoxO1 antagonist suppresses autophagy and lipid droplet growth in adipocytes.
Tamoxifen reduces fat mass by boosting reactive oxygen species.
Targeting FoxO1 with AS1842856 suppresses adipogenesis.
Ebf2 is a selective marker of brown and beige adipogenic precursor cells.
Suh JH, Kim KH, Conner ME, Moore DD, Preidis GA
Frontiers in nutrition 2022;9:831879
Frontiers in nutrition 2022;9:831879
Cell fate determining molecular switches and signaling pathways in Pax7-expressing somitic mesoderm.
Fung CW, Zhou S, Zhu H, Wei X, Wu Z, Wu AR
Cell discovery 2022 Jun 28;8(1):61
Cell discovery 2022 Jun 28;8(1):61
β-RA Targets Mitochondrial Metabolism and Adipogenesis, Leading to Therapeutic Benefits against CoQ Deficiency and Age-Related Overweight.
Hidalgo-Gutiérrez A, Barriocanal-Casado E, Díaz-Casado ME, González-García P, Zenezini Chiozzi R, Acuña-Castroviejo D, López LC
Biomedicines 2021 Oct 13;9(10)
Biomedicines 2021 Oct 13;9(10)
Defining the lineage of thermogenic perivascular adipose tissue.
Angueira AR, Sakers AP, Holman CD, Cheng L, Arbocco MN, Shamsi F, Lynes MD, Shrestha R, Okada C, Batmanov K, Susztak K, Tseng YH, Liaw L, Seale P
Nature metabolism 2021 Apr;3(4):469-484
Nature metabolism 2021 Apr;3(4):469-484
Protective Effects of Foam Rolling against Inflammation and Notexin Induced Muscle Damage in Rats.
Pablos A, Ceca D, Jorda A, Rivera P, Colmena C, Elvira L, Martínez-Arnau FM, Valles SL
International journal of medical sciences 2020;17(1):71-81
International journal of medical sciences 2020;17(1):71-81
Dermal Adipocyte Lipolysis and Myofibroblast Conversion Are Required for Efficient Skin Repair.
Shook BA, Wasko RR, Mano O, Rutenberg-Schoenberg M, Rudolph MC, Zirak B, Rivera-Gonzalez GC, López-Giráldez F, Zarini S, Rezza A, Clark DA, Rendl M, Rosenblum MD, Gerstein MB, Horsley V
Cell stem cell 2020 Jun 4;26(6):880-895.e6
Cell stem cell 2020 Jun 4;26(6):880-895.e6
1α, 25-dihydroxy Vitamin D3 containing fractions of Catharanthus roseus leaf aqueous extract inhibit preadipocyte differentiation and induce lipolysis in 3T3-L1 cells.
Borah AK, Singh A, Yasmin R, Doley R, Mattaparthi VSK, Saha S
BMC complementary and alternative medicine 2019 Nov 29;19(1):338
BMC complementary and alternative medicine 2019 Nov 29;19(1):338
Cross-talk between microtubules and the linker of nucleoskeleton complex plays a critical role in the adipogenesis of human adipose-derived stem cells.
Yang Y, Qu R, Fan T, Zhu X, Feng Y, Yang Y, Deng T, Peng Y, Huang W, Ouyang J, Dai J
Stem cell research & therapy 2018 May 2;9(1):125
Stem cell research & therapy 2018 May 2;9(1):125
Id1 Promotes Obesity by Suppressing Brown Adipose Thermogenesis and White Adipose Browning.
Patil M, Sharma BK, Elattar S, Chang J, Kapil S, Yuan J, Satyanarayana A
Diabetes 2017 Jun;66(6):1611-1625
Diabetes 2017 Jun;66(6):1611-1625
Cytoglobin: a potential marker for adipogenic differentiation in preadipocytes in vitro.
Doğan A, Demirci S, Kıratlı B, Şahin F
Cytotechnology 2017 Feb;69(1):157-165
Cytotechnology 2017 Feb;69(1):157-165
A new hope for obesity management: Boron inhibits adipogenesis in progenitor cells through the Wnt/β-catenin pathway.
Doğan A, Demirci S, Apdik H, Bayrak OF, Gulluoglu S, Tuysuz EC, Gusev O, Rizvanov AA, Nikerel E, Şahin F
Metabolism: clinical and experimental 2017 Apr;69:130-142
Metabolism: clinical and experimental 2017 Apr;69:130-142
DNA Topoisomerase IIα contributes to the early steps of adipogenesis in 3T3-L1 cells.
Jacobsen RG, Mazloumi Gavgani F, Mellgren G, Lewis AE
Cellular signalling 2016 Oct;28(10):1593-603
Cellular signalling 2016 Oct;28(10):1593-603
FoxO1 antagonist suppresses autophagy and lipid droplet growth in adipocytes.
Liu L, Zheng LD, Zou P, Brooke J, Smith C, Long YC, Almeida FA, Liu D, Cheng Z
Cell cycle (Georgetown, Tex.) 2016 Aug 2;15(15):2033-41
Cell cycle (Georgetown, Tex.) 2016 Aug 2;15(15):2033-41
Tamoxifen reduces fat mass by boosting reactive oxygen species.
Liu L, Zou P, Zheng L, Linarelli LE, Amarell S, Passaro A, Liu D, Cheng Z
Cell death & disease 2015 Jan 8;6(1):e1586
Cell death & disease 2015 Jan 8;6(1):e1586
Targeting FoxO1 with AS1842856 suppresses adipogenesis.
Zou P, Liu L, Zheng L, Liu L, Stoneman RE, Cho A, Emery A, Gilbert ER, Cheng Z
Cell cycle (Georgetown, Tex.) 2014;13(23):3759-67
Cell cycle (Georgetown, Tex.) 2014;13(23):3759-67
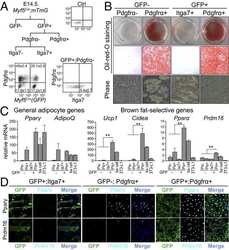
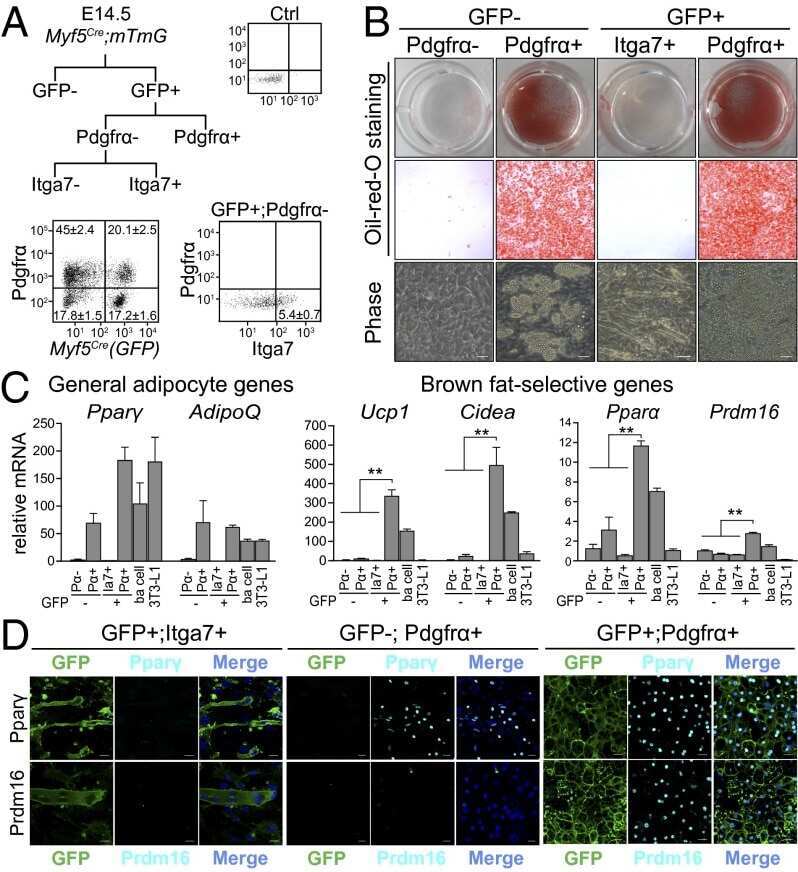
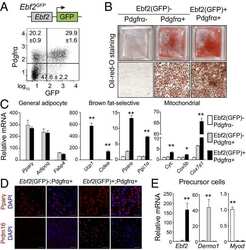
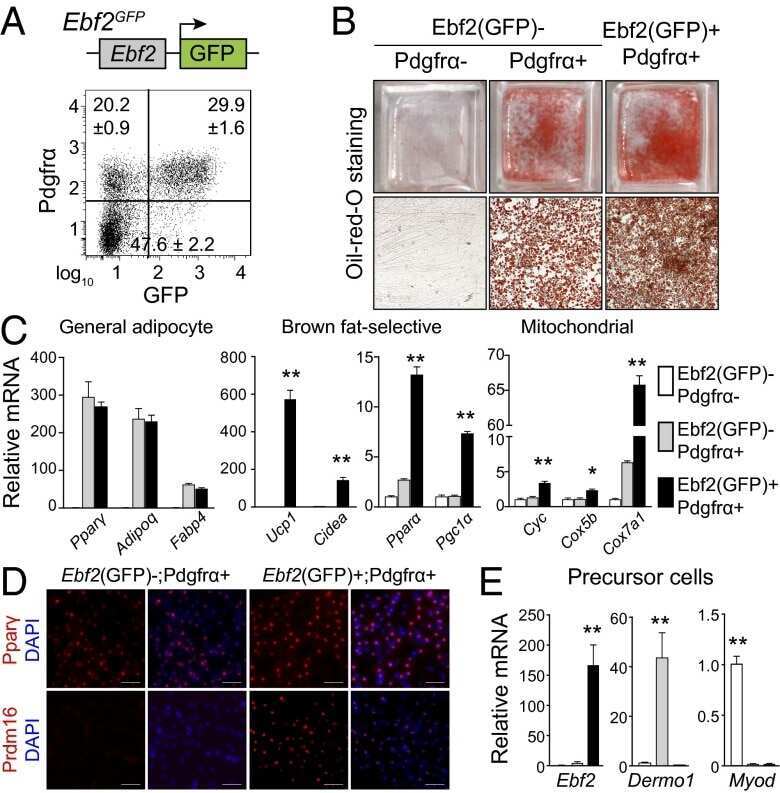
Ebf2 is a selective marker of brown and beige adipogenic precursor cells.
Wang W, Kissig M, Rajakumari S, Huang L, Lim HW, Won KJ, Seale P
Proceedings of the National Academy of Sciences of the United States of America 2014 Oct 7;111(40):14466-71
Proceedings of the National Academy of Sciences of the United States of America 2014 Oct 7;111(40):14466-71
No comments: Submit comment
Supportive validation
- Submitted by
- Invitrogen Antibodies (provider)
- Main image

- Experimental details
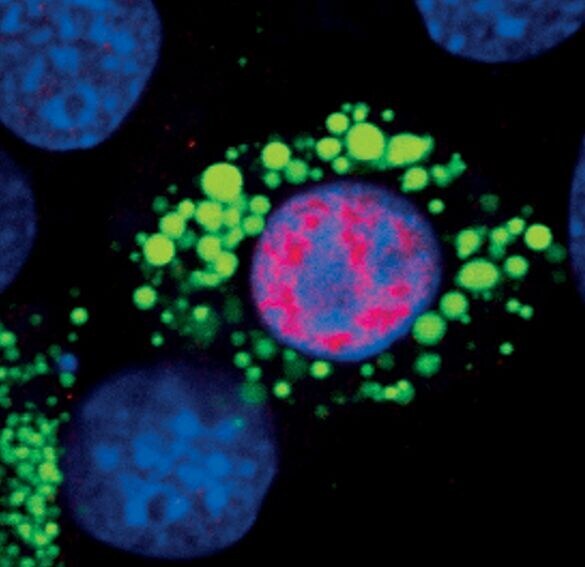
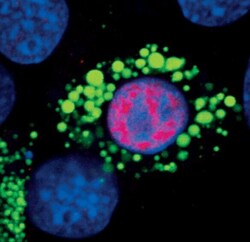
- Immunofluorescent analysis of PPAR-gamma in 3T3-L1 cells using a PPAR-gamma monoclonal antibody (Product # MA5-14889) (red) showing nuclear localization in differentiated cells. Lipid droplets have been labeled with a BODIPY fluorescent dye (green). DNA is labeled using a fluorescent blue dye.
- Submitted by
- Invitrogen Antibodies (provider)
- Main image
- Experimental details
- Immunofluorescent analysis of PPAR-gamma in 3T3-L1 cells using a PPAR-gamma monoclonal antibody (Product # MA5-14889) (red) showing nuclear localization in differentiated cells. Lipid droplets have been labeled with a BODIPY fluorescent dye (green). DNA is labeled using a fluorescent blue dye.

Supportive validation
- Submitted by
- Invitrogen Antibodies (provider)
- Main image

- Experimental details
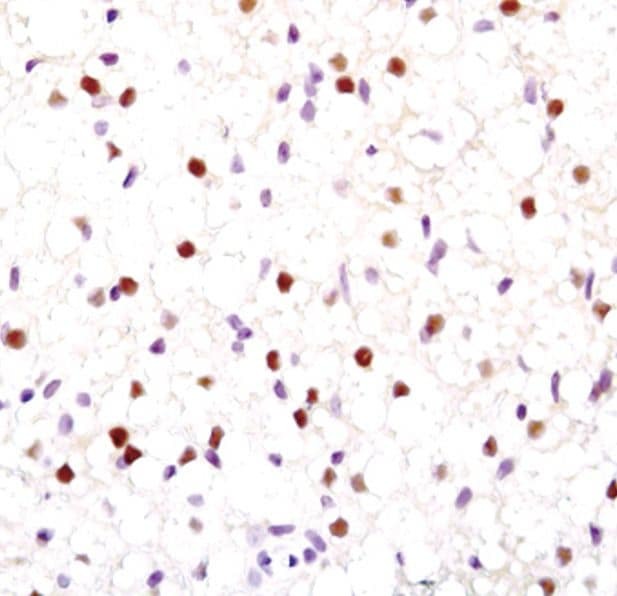
- Immunohistochemical analysis of PPAR-gamma in paraffin-embedded mouse brown fat using a PPAR-gamma monoclonal antibody (Product # MA5-14889).
Supportive validation
- Submitted by
- Invitrogen Antibodies (provider)
- Main image
- Experimental details
- NULL
- Submitted by
- Invitrogen Antibodies (provider)
- Main image
- Experimental details
- NULL
- Submitted by
- Invitrogen Antibodies (provider)
- Main image
- Experimental details
- NULL
- Submitted by
- Invitrogen Antibodies (provider)
- Main image
- Experimental details
- NULL
- Submitted by
- Invitrogen Antibodies (provider)
- Main image
- Experimental details
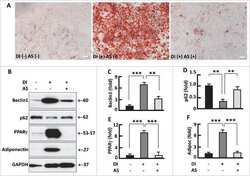
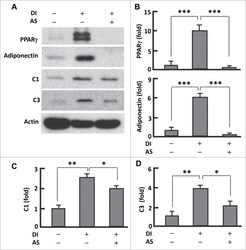
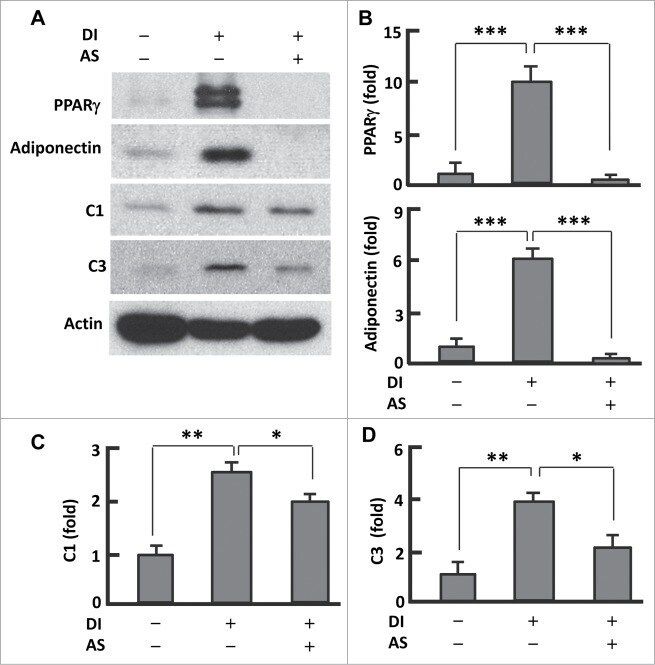
- Figure 2. AS1842856 suppressed PPARgamma and mitochondrial protein expression. ( A ) Western blots showing the effect of AS1842856 on PPARgamma, adiponectin, mitochondrial proteins C1 and C3. beta-actin was probed as the loading control. DI, differentiation induction; AS, AS1842856. ( B-D ) Densitometric analysis of western blot images with NIH ImageJ software; n = 3-5. * P < 0 .05; **, P < 0 .01; and ***, P < 0 .0001.
- Submitted by
- Invitrogen Antibodies (provider)
- Main image
- Experimental details
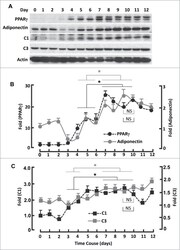
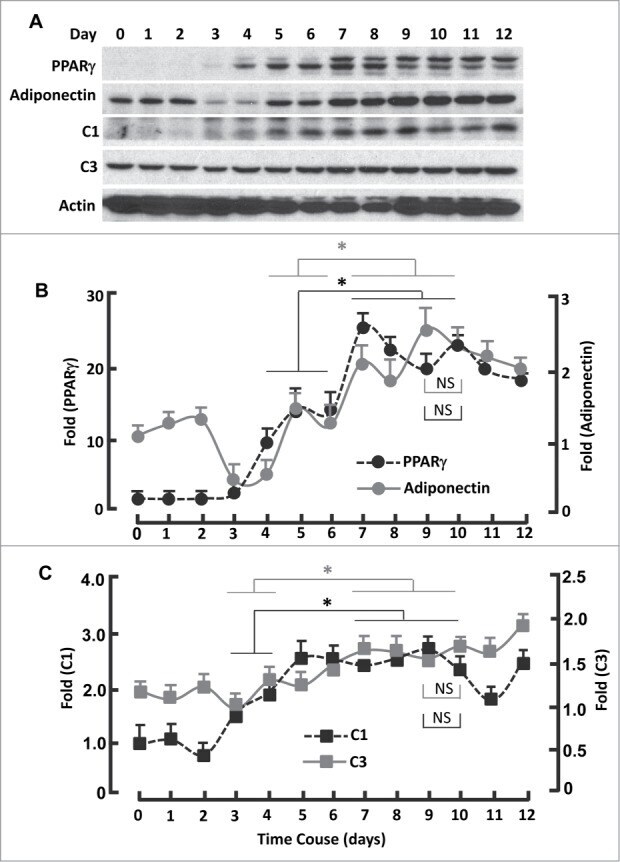
- Figure 4. Kinetics of FoxO1-regulated protein expression during adipogenesis. ( A ) Western blots showing the expression of PPARgamma, adiponectin, mitochondrial proteins C1 and C3. beta-actin was probed as the loading control. ( B ) Densitometric analysis of western blot images for PPARgamma and adiponectin with NIH ImageJ software. ( C ) Densitometric analysis of protein gel blot images for C1 and C3 with NIH ImageJ software. n = 3-5. * P < 0 .05; NS, not significant.
- Submitted by
- Invitrogen Antibodies (provider)
- Main image

- Experimental details
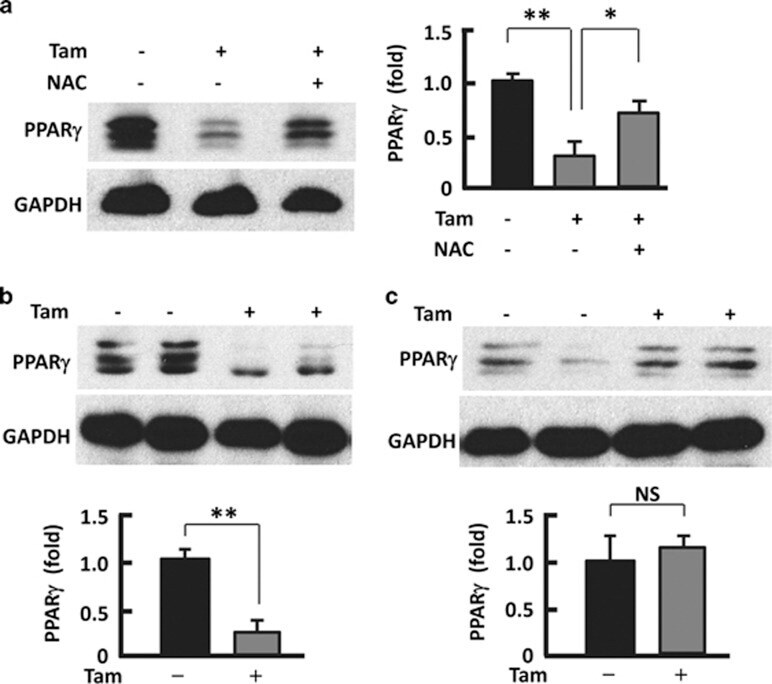
- Figure 6 Counteracting or normalizing ROS reduced Tam effect on PPAR gamma . ( a ) Western blotting analysis (left panel) of PPAR gamma in 3T3L1 adipocytes after 48-h treatment with Tam (128 mu M) or Tam (128 mu M) plus NAC (1 mM), with densitometric analysis (right panel) of western blotting images using the NIH ImageJ software; n =3-5. ( b ) At week 2 after Tam administration, western blotting (upper panel) was performed to analyze PPAR gamma , with densitometric analysis (lower panel) of western blotting images using the NIH ImageJ software; n =3-5. ( c ) At week 6 after Tam administration, western blotting (upper panel) was performed to analyze PPAR gamma , with densitometric analysis (lower panel) of western blotting images using the NIH ImageJ software; n =3-5. GAPDH (glyceraldehyde 3-phosphate dehydrogenase) was probed as a loading control. * P
- Submitted by
- Invitrogen Antibodies (provider)
- Main image
- Experimental details
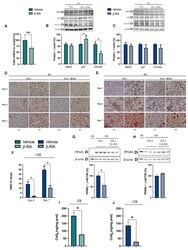
- Figure 7 Direct effects of beta-RA on adipogenesis. ( A ) Percentage of 3TL1 cells after seven days of treatment with 1 mM beta-RA relative to the number of untreated 3TL1 cells. Cells cultured in proliferative conditions. ( B ) Levels of the proteins SKP2, p27, and CYCA2, which were involved in the control of the cell cycle. The 3TL1 cells were treated for seven days with 1 mM beta-RA in proliferative conditions. ( C ) Levels of the proteins SKP2, p27, and CYCA2, which were involved in cell cycle control. The 3TL1 cells were treated for seven days with 1 mM beta-RA in differentiative conditions. ( D , E ) Oil Red O staining in 3TL1 cells cultured under proliferative ( D ) and proliferative + differentiative ( F ) conditions. The 3TL1 cells were treated with 1 mM beta-RA from day 0 in both conditions and the stains were performed on three different days (2, 4, and 7). ( F ) Percentage of the area corresponding to the Oil Red O stains in the 3TL1 cells in differentiative conditions after days 4 and 7 of treatment with 1 mM beta-RA. ( G , H ) Levels of PPARgamma and PPARdelta in the 3TL1 cells cultured in proliferative + differentiative ( F ) conditions and treated with 1 mM beta-RA. The results in non-differentiated cells are shown in line one as the negative control. ( I , J ) Levels of CoQ 9 in the 3TL1 cells cultured in proliferative conditions ( I ) and differentiative conditions ( J ) and treated with 1 mM beta-RA. Data are expressed as mean +- SD. * p < 0.05, *** p < 0.0

- Submitted by
- Invitrogen Antibodies (provider)
- Main image
- Experimental details
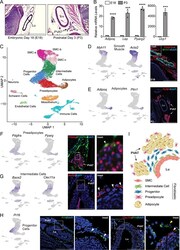
- Fig. 2 Identification of multiple fibroblast populations in developing aortic PVAT (A) H&E staining of retroperitoneum en bloc from E18 and P3 CD1 mice (scale bar, 517.6 mum). Representative of n=3 experiments. (B) mRNA levels of indicated genes in thoracic aorta from E18 and P3 CD1 mice (n=3 biological replicates of pooled aortas; mean+/-SEM). Two sample, two-sided t-test ( Adipoq : p= 0.000011; Lep : p= 0.000618; Pparg2 : p= 0.000016; Ucp1 : p= 0.0002). (C) UMAP of gene expression in 17,957 cells from P3 thoracic aorta of P3 CD1 mice. (D) UMAP showing expression of smooth muscle marker genes (left) and immunostaining of PDGFRa (red) and MYH11 (green) in sections of E18 thoracic aorta (right) (scale bar, 271.8 mum). Representative of n=2 experiments. (E) UMAP showing expression of adipocyte marker genes (left) and immunostaining of PLIN1 (red) in P3 thoracic aorta. (scale bar, 543.5 mum). Representative of n=3 experiments. (F) UMAP showing expression of preadipocyte marker genes and immunostaining of PPARg (red) and PDGFRa (green) in P3 thoracic aorta. Arrowheads show preadipocytes (scale bar, 135.9 mum). Representative of n=2 experiments. (G) UMAP showing expression of intermediate cell genes and mRNA in-situ hybridization of Bace2 (red) in P3 thoracic aorta. Arrowheads indicate intermediate cells. (scale bar, 145 mum). Representative of n=2 experiments. (H) UMAP showing expression of the progenitor marker gene Pi16 (left) and mRNA in-situ of hybridization of: (1) Pi16 (gre

- Submitted by
- Invitrogen Antibodies (provider)
- Main image
- Experimental details
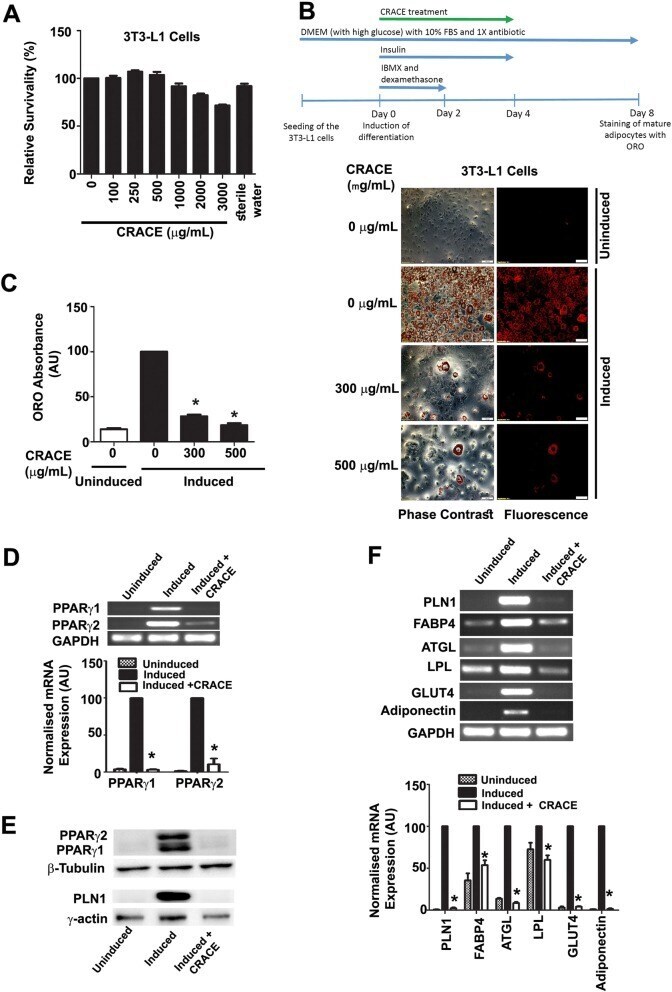
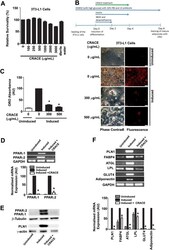
- Fig. 1 CRACE inhibited differentiation of 3T3-L1 preadipocytes. a. Percent survivability of 3T3-L1 cells as measured by MTT assay after exposure to different doses of CRACE for 24 h. b. CRACE reduced lipid accumulation in differentiating 3T3-L1 cells. Top panel represents the design of the experiment. 3T3-L1 cells were induced with adipogenic cocktail +- CRACE at the displayed doses for 4 days and subsequently kept in maintenance medium for an additional 4 days. Thereafter, ORO staining was performed. Images represent micrographs of ORO stained cells. Scale bar: 100 mum. c. Graph represents absorbance of extracted ORO from different groups of cells represented in panel b . d. Expression of PPARgamma1 and PPARgamma2 transcripts were reduced in CRACE treated group of induced 3T3-L1 cells. 3T3-L1 cells were induced for differentiation +- CRACE (500 mug/mL equivalent) in the same way as described in panel b . Gel images and bar diagram represent RT-PCR analysis of total RNA isolated after 8 days of induction. e. CRACE reduced PPARgamma1, PPARgamma2 and PLN1 protein level in differentiating 3T3-L1 cells are represented in panel a . Gel pictures represent western blot analysis of proteins isolated after 8 days of induction. f. CRACE reduced expression of PPARgamma target genes . Cell differentiation, and treatment is the same as in panel d . Gel images and bar diagram represent RT-PCR analysis of PPARgamma regulated adipocyte factors: PLN1, FABP4, ATGL, LPL, GLUT4, and Adiponectin