Explore
 Validate
 Learn
 Western blot
 Immunocytochemistry
Antibody data
- Antibody Data
- Antigen structure
- References [2]
- Comments [0]
- Validations
- Immunocytochemistry [6]
- Other assay [2]
Submit
Validation data
Reference
Comment
Report error
- Product number
- MA5-27686 - Provider product page

- Provider
- Invitrogen Antibodies
- Product name
- GRP78 Monoclonal Antibody (1H11-1H7)
- Antibody type
- Monoclonal
- Antigen
- Other
- Description
- 0.5 µg/mL of MA5-27686 was sufficient for detection of Grp78 in 10 µg of rat tissue lysate by ECL immunoblot analysis.|Detects approximately 78kDa.
- Reactivity
- Human, Mouse, Rat, Bovine, Hamster, Rabbit, Xenopus, Yeast
- Host
- Mouse
- Isotype
- IgG
- Antibody clone number
- 1H11-1H7
- Vial size
- 100 μg
- Concentration
- 1 mg/mL
- Storage
- -20°C
Submitted references Melatonin activates ABCA1 via the BiP/NRF1 pathway to suppress high-cholesterol-induced apoptosis of mesenchymal stem cells.
Endoplasmic reticulum stress attenuation promotes bovine oocyte maturation in vitro.
Kim JS, Jung YH, Lee HJ, Chae CW, Choi GE, Lim JR, Kim SY, Lee JE, Han HJ
Stem cell research & therapy 2021 Feb 5;12(1):114
Stem cell research & therapy 2021 Feb 5;12(1):114
Endoplasmic reticulum stress attenuation promotes bovine oocyte maturation in vitro.
Khatun H, Wada Y, Konno T, Tatemoto H, Yamanaka KI
Reproduction (Cambridge, England) 2020 Apr;159(4):361-370
Reproduction (Cambridge, England) 2020 Apr;159(4):361-370
No comments: Submit comment
Supportive validation
- Submitted by
- Invitrogen Antibodies (provider)
- Main image
- Experimental details
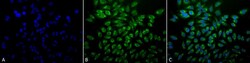
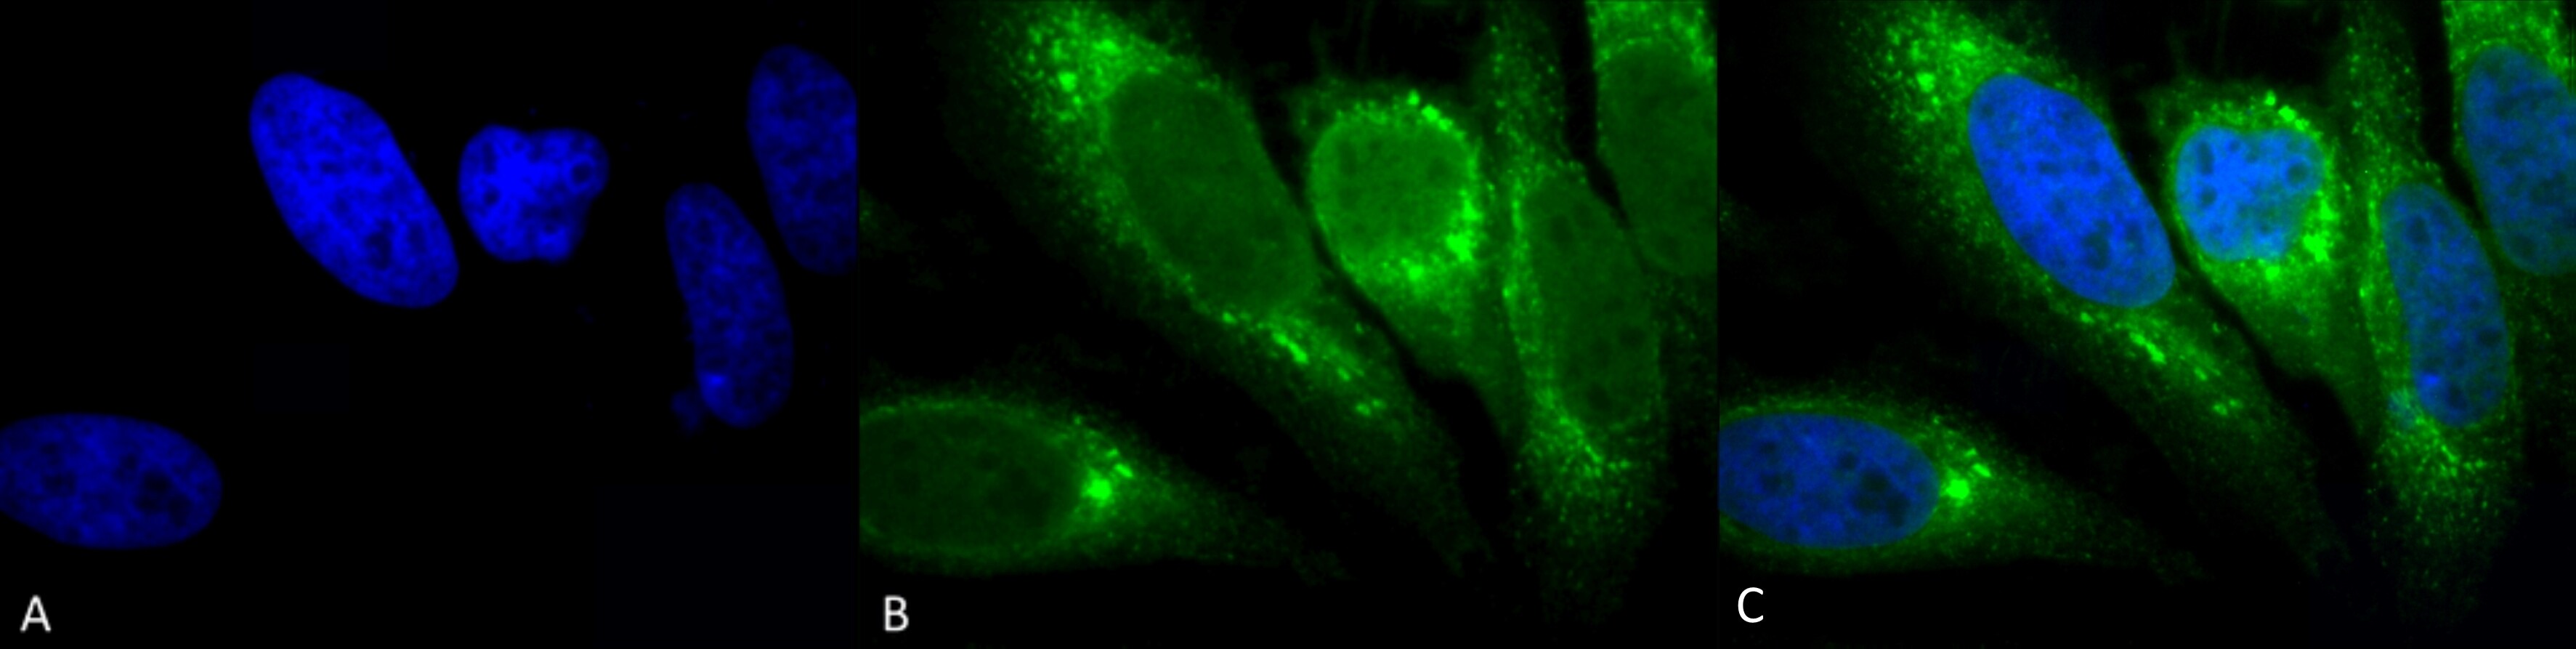
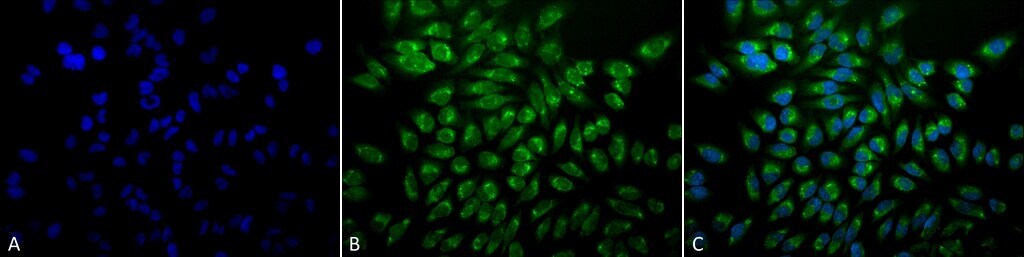
- Immunofluorescent analysis of GRP78 in human heat shocked HeLa cells. Sample was fixed using 2% formaldehyde (20 min at RT), incubated with GRP78 monoclonal antibody (Product # MA5-27686) using a dilution of 1:100 (12 hours at 4°C), and followed by FITC Goat Anti-Mouse (green) at 1:200 for 2 hours at RT. Counterstain: DAPI (blue) nuclear stain at 1:40000 for 2 hours at RT. Localization: Endoplasmic reticulum lumen. Melanosome. Magnification: 20x. (A) DAPI (blue) nuclear stain. (B) Anti-GRP78 Antibody. (C) Composite. Heat Shocked at 42°C for 1h. at a dilution of 1:200. Images are shown as follows: A) DAPI (blue) nuclear stain, B) Anti-GRP78 Antibody, C) Composite image, Heat Shocked at 42°C for 1h. Magnification: 20x.
- Submitted by
- Invitrogen Antibodies (provider)
- Main image
- Experimental details
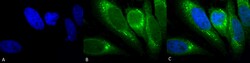
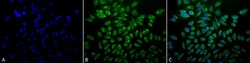
- Immunofluorescent analysis of GRP78 in human heat shocked HeLa cells. Sample was fixed with 2% formaldehyde (20 min at RT), incubated with GRP78 monoclonal antibody (Product # MA5-27686) using a dilution of 1:100 (12 hours at 4°C), and followed by FITC Goat Anti-Mouse (green) and DAPI secondary antibody at a dilution of 1:200 and 1:40,000 (2 hours at RT). Images are shown as follows: (A) DAPI (blue) nuclear stain, (B) Anti-GRP78 Antibody, (C) Merged image. Magnification: 100x.
- Submitted by
- Invitrogen Antibodies (provider)
- Main image
- Experimental details
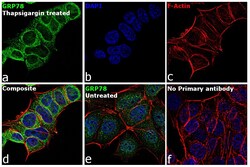
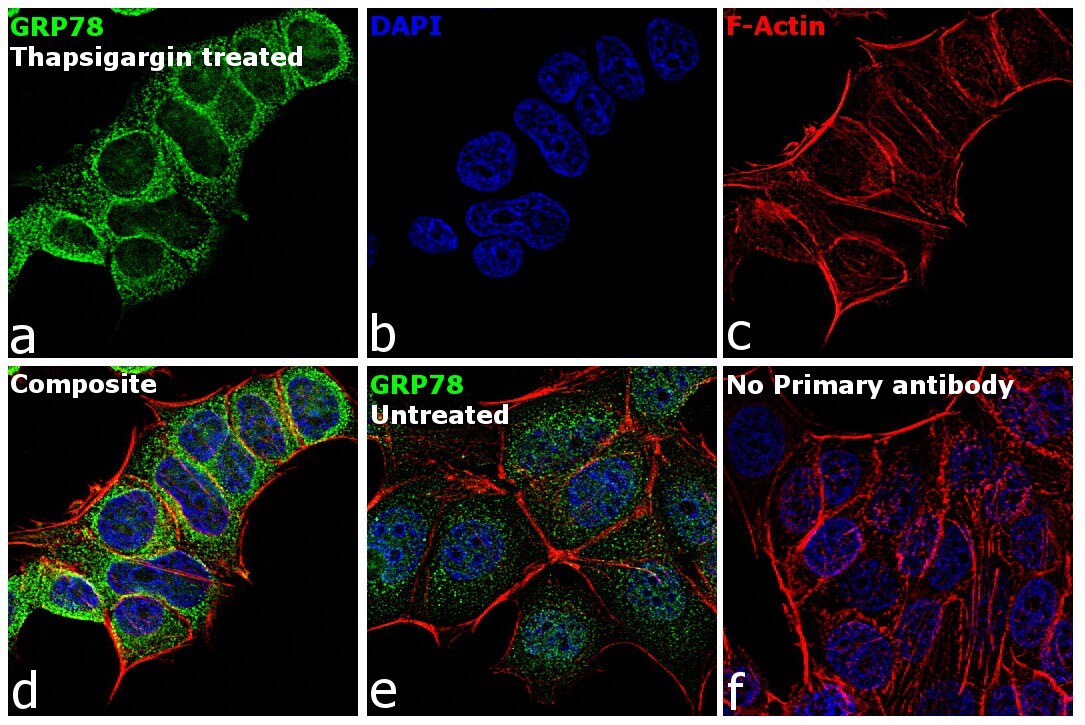
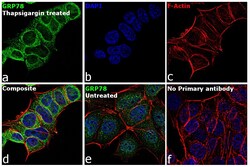
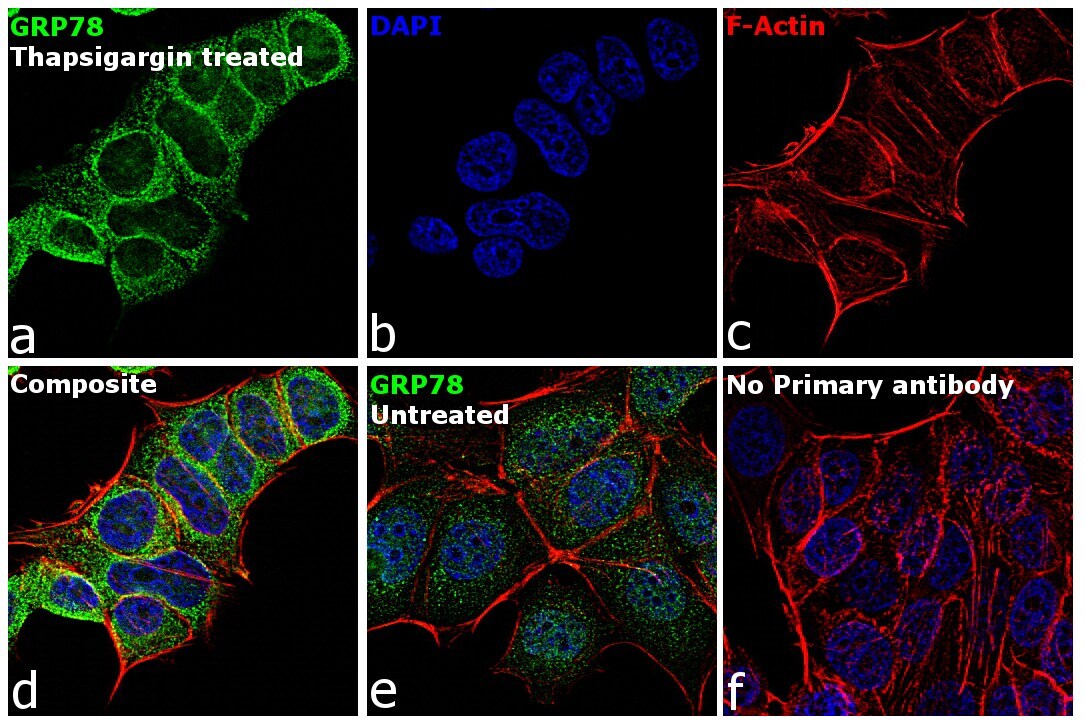
- Immunofluorescence analysis of GRP78 was performed using 70% confluent log phase MCF7 cells and MCF7 cells treated with 1 µM of Thapsigargin for 24 hours. The cells were fixed with 4% paraformaldehyde for 10 minutes, permeabilized with 0.1% Triton™ X-100 for 15 minutes, and blocked with 2% BSA for 1 hour at room temperature. The cells were labeled with GRP78 Mouse Monoclonal Antibody (1H11-1H7) (Product # MA5-27686) at 5 µg/mL in 0.1% BSA, incubated at 4 degree Celsius overnight and then with Goat anti-Mouse IgG (H+L) Superclonal™ Secondary Antibody, Alexa Fluor® 488 conjugate (Product # A28175) at a dilution of 1:2000 for 45 minutes at room temperature (Panel a: green). Nuclei (Panel b: blue) were stained with ProLong™ Diamond Antifade Mountant with DAPI (Product # P36962). F-actin (Panel c: red) was stained with Rhodamine Phalloidin (Product # R415, 1:300). Panel d represents the merged image showing strong cytoplasmic localization. Panel e shows untreated cells with weak cytoplasmic signal. Panel f represents control cells with no primary antibody to assess background. The images were captured at 60X magnification.
- Submitted by
- Invitrogen Antibodies (provider)
- Main image
- Experimental details
- Immunofluorescent analysis of GRP78 in human heat shocked HeLa cells. Sample was fixed using 2% formaldehyde (20 min at RT), incubated with GRP78 monoclonal antibody (Product # MA5-27686) using a dilution of 1:100 (12 hours at 4°C), and followed by FITC Goat Anti-Mouse (green) at 1:200 for 2 hours at RT. Counterstain: DAPI (blue) nuclear stain at 1:40000 for 2 hours at RT. Localization: Endoplasmic reticulum lumen. Melanosome. Magnification: 20x. (A) DAPI (blue) nuclear stain. (B) Anti-GRP78 Antibody. (C) Composite. Heat Shocked at 42°C for 1h. at a dilution of 1:200. Images are shown as follows: A) DAPI (blue) nuclear stain, B) Anti-GRP78 Antibody, C) Composite image, Heat Shocked at 42°C for 1h. Magnification: 20x.
- Submitted by
- Invitrogen Antibodies (provider)
- Main image
- Experimental details
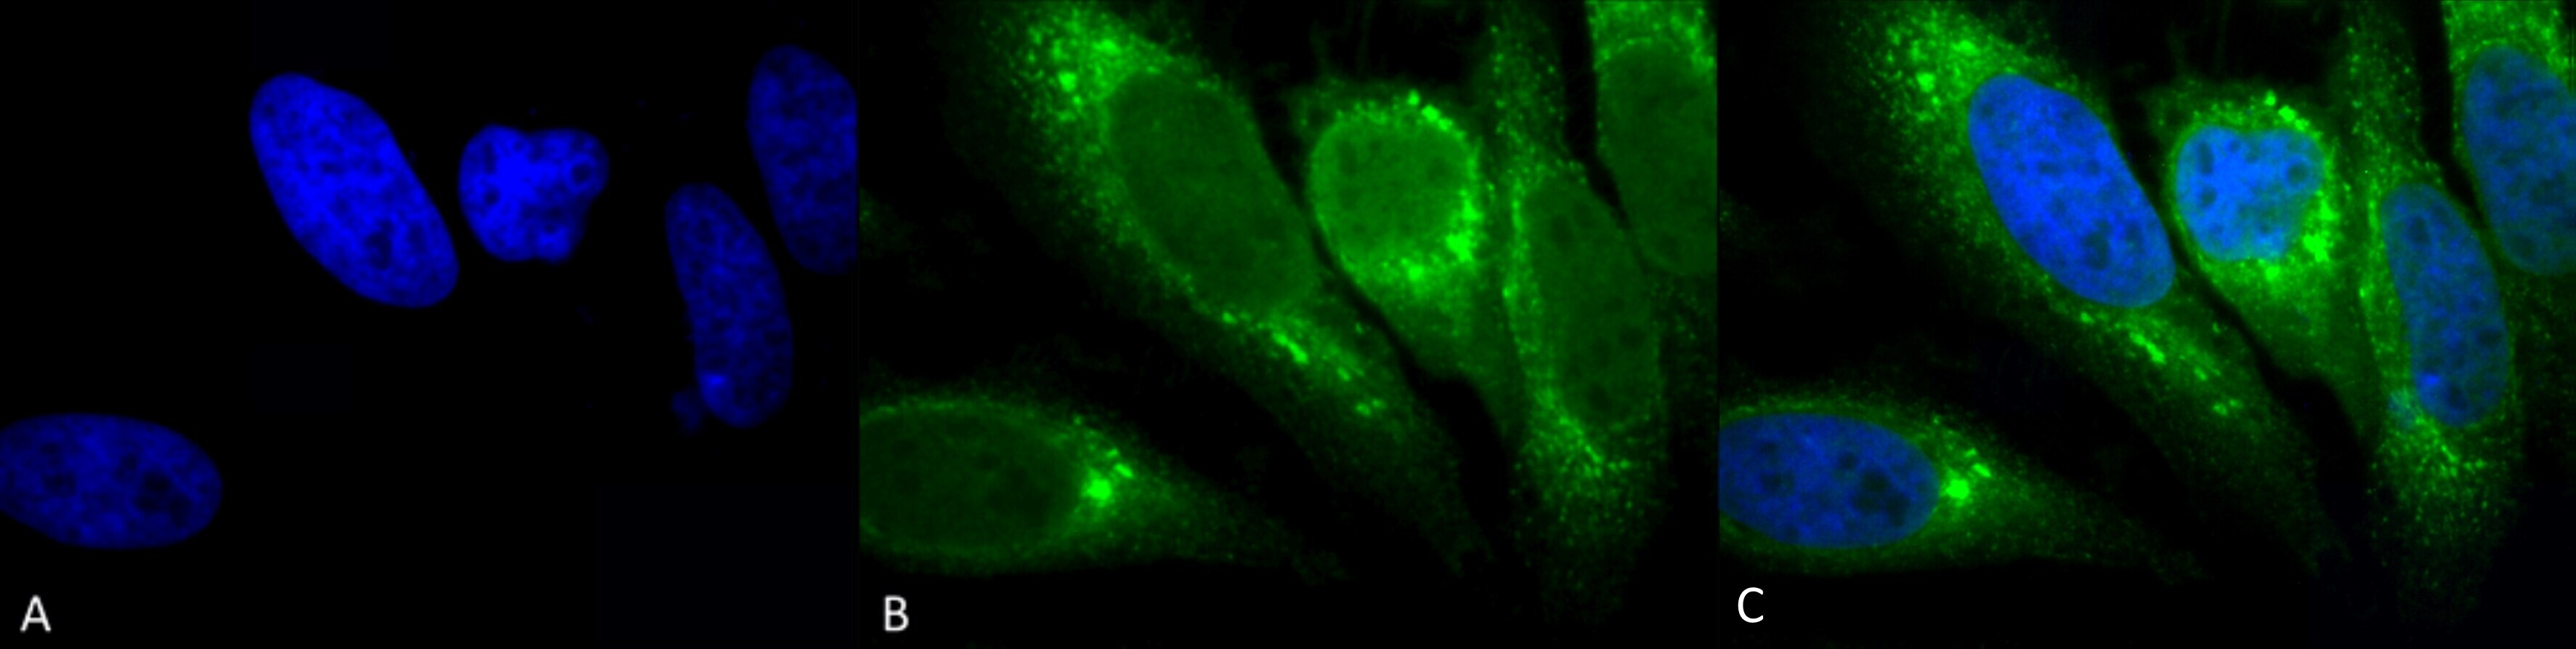
- Immunofluorescent analysis of GRP78 in human heat shocked HeLa cells. Sample was fixed with 2% formaldehyde (20 min at RT), incubated with GRP78 monoclonal antibody (Product # MA5-27686) using a dilution of 1:100 (12 hours at 4°C), and followed by FITC Goat Anti-Mouse (green) and DAPI secondary antibody at a dilution of 1:200 and 1:40,000 (2 hours at RT). Images are shown as follows: (A) DAPI (blue) nuclear stain, (B) Anti-GRP78 Antibody, (C) Merged image. Magnification: 100x.
- Submitted by
- Invitrogen Antibodies (provider)
- Main image
- Experimental details
- Immunofluorescence analysis of GRP78 was performed using 70% confluent log phase MCF7 cells and MCF7 cells treated with 1 µM of Thapsigargin for 24 hours. The cells were fixed with 4% paraformaldehyde for 10 minutes, permeabilized with 0.1% Triton™ X-100 for 15 minutes, and blocked with 2% BSA for 1 hour at room temperature. The cells were labeled with GRP78 Mouse Monoclonal Antibody (1H11-1H7) (Product # MA5-27686) at 5 µg/mL in 0.1% BSA, incubated at 4 degree Celsius overnight and then with Goat anti-Mouse IgG (H+L) Superclonal™ Secondary Antibody, Alexa Fluor® 488 conjugate (Product # A28175) at a dilution of 1:2000 for 45 minutes at room temperature (Panel a: green). Nuclei (Panel b: blue) were stained with ProLong™ Diamond Antifade Mountant with DAPI (Product # P36962). F-actin (Panel c: red) was stained with Rhodamine Phalloidin (Product # R415, 1:300). Panel d represents the merged image showing strong cytoplasmic localization. Panel e shows untreated cells with weak cytoplasmic signal. Panel f represents control cells with no primary antibody to assess background. The images were captured at 60X magnification.
Supportive validation
- Submitted by
- Invitrogen Antibodies (provider)
- Main image
- Experimental details
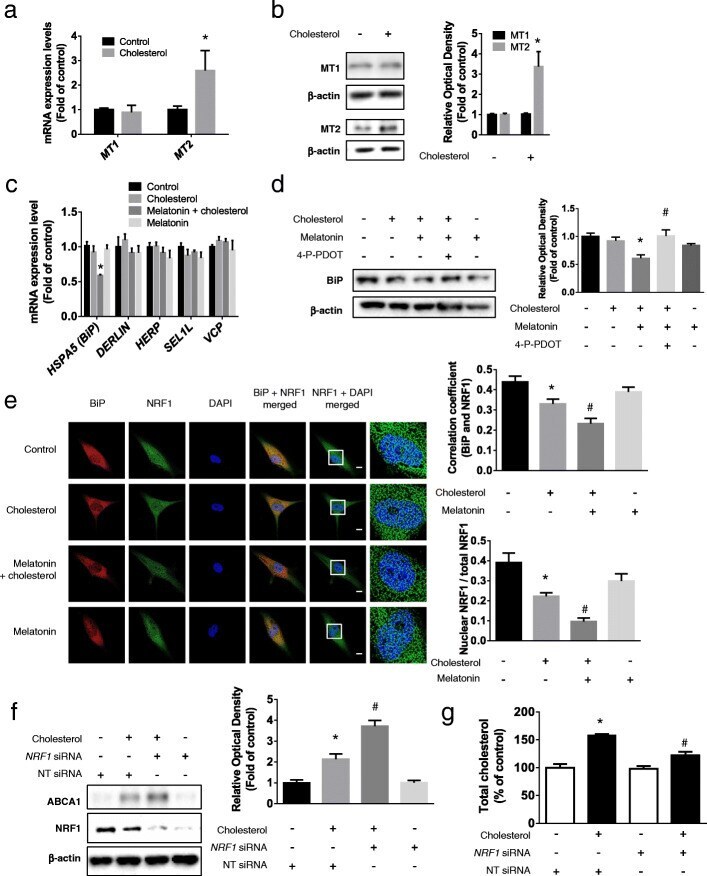
- Fig. 4 Involvement of MT2/Bip/NRF1 pathway in melatonin-induced ABCA1 expression. a and b Cholesterol (200 muM, 24 h) was treated to UCB-MSCs and the changes in expression levels of MT1 and MT2 were measured by qPCR or western blotting ( n = 5, * p < 0.05 vs control). c Melatonin (1 muM) was pretreated to UCB-MSCs before cholesterol treatment (200 muM, 24 h) and then the expression levels of HSPA5 , DERLIN , HERP , SEL1L , and VCP were compared by qPCR ( n = 5, * p < 0.05 vs cholesterol). d MT2 inhibitor, 4-P-PDOT (10 muM) were pretreated prior to melatonin treatment (1 muM) and the expression level of BiP was measured by western blotting ( n = 5, * p < 0.05 vs control, # p < 0.05 vs cholesterol + melatonin). e Immunocytochemistry was conducted with NRF1 (green) and BiP (red) specific antibodies and DAPI (blue) and then visualized by SRRF imaging system. Scale bar was set as 8 mum (magnification x 1000) ( n = 5, * p < 0.05 vs control, # p < 0.05 vs cholesterol). f , g NRF1 or NT siRNA was transfected to UCB-MSCs using transfection reagents prior to cholesterol treatment (200 muM, 24 h). The expression levels of ABCA1 and NRF1 were measured by western blotting and the level of total cholesterol was quantified with cholesterol quantification kit ( n = 5, * p < 0.05 vs NT siRNA, # p < 0.05 vs NT siRNA + cholesterol). All blot and images are representative and quantitative data are presented as a mean +- standard error of the mean
- Submitted by
- Invitrogen Antibodies (provider)
- Main image
- Experimental details
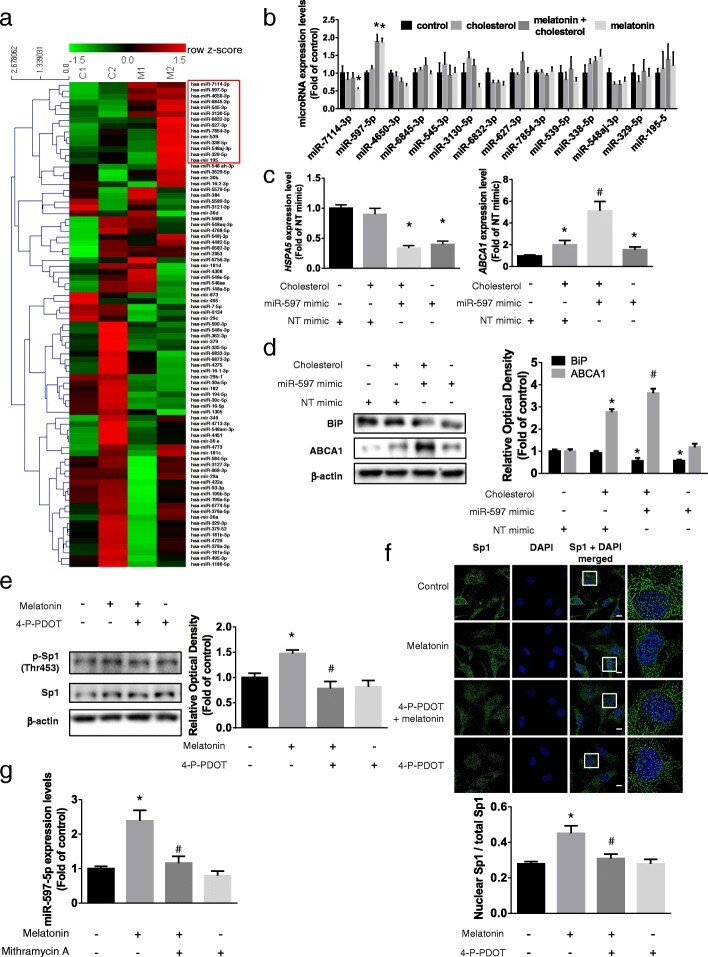
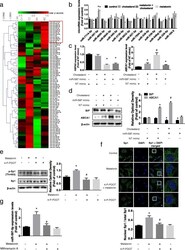
- Fig. 6 Involvement of melatonin-activated Sp1/miR-597 pathway in BiP suppression. a UCB-MSCs were treated with melatonin (1 muM, 24 h) and total RNAs were extracted. MicroRNA microarray was conducted and the expression levels of microRNAs were analyzed using hierarchical clustering with heatmap. b A cluster of expression-increased microRNAs was selected and their expression levels under high cholesterol and melatonin condition were analyzed by qPCR ( n = 5, *p < 0.05 vs control). c , d miR-597 mimic was transfected to UCB-MSCs for 24 h prior to cholesterol treatment (200 muM, 12 h). The mRNA expressions of HSPA5 and ABCA1 and protein expression levels of BiP and ABCA1 were quantified with qPCR and western blotting ( n = 5, * p < 0.05 vs NT mimic, # p < 0.05 vs NT mimic + cholesterol). e , f MT2 inhibitor 4-P-PDOT (10 muM) was pretreated prior to melatonin treatment (1 muM, 12 h). e The phosphorylation of Sp1 (Thr453) were measured by western blotting ( n = 5, * p < 0.05 vs control, # p < 0.05 vs melatonin). f Immunocytochemistry was conducted with Sp1 (green) specific antibody and DAPI (blue). Scale bar was set as 8 mum (magnification x 1000, n = 5, * p < 0.05 vs control, # p < 0.05 vs melatonin). g Sp1 inhibitor Mithramycin A (5 nM) was pretreated prior to melatonin treatment (1 muM, 12 h), and the change of expression level of miR-597-5p was assessed through qPCR ( n = 5, * p < 0.05 vs control, # p < 0.05 vs melatonin). All images are representative and quantitative data ar