Explore
 Validate
 Learn
Learn Western blot
 Immunocytochemistry
Antibody data
- Antibody Data
- Antigen structure
- References [3]
- Comments [0]
- Validations
- Immunocytochemistry [2]
- Immunohistochemistry [2]
- Flow cytometry [2]
- Other assay [4]
Submit
Validation data
Reference
Comment
Report error
- Product number
- PA5-11418 - Provider product page

- Provider
- Invitrogen Antibodies
- Product name
- GRP78 Polyclonal Antibody
- Antibody type
- Polyclonal
- Antigen
- Recombinant full-length protein
- Reactivity
- Human, Mouse
- Host
- Rabbit
- Isotype
- IgG
- Vial size
- 200 μL
- Concentration
- 1.5 mg/mL
- Storage
- Store at 4°C short term. For long term storage, store at -20°C, avoiding freeze/thaw cycles.
Submitted references Dyskerin Downregulation Can Induce ER Stress and Promote Autophagy via AKT-mTOR Signaling Deregulation.
Smac mimetic LCL161 overcomes protective ER stress induced by obatoclax, synergistically causing cell death in multiple myeloma.
Characterization of the autophagy marker protein Atg8 reveals atypical features of autophagy in Plasmodium falciparum.
Maiello D, Varone M, Vicidomini R, Belli V, De Rosa M, Dama P, Furia M, Turano M
Biomedicines 2022 May 8;10(5)
Biomedicines 2022 May 8;10(5)
Smac mimetic LCL161 overcomes protective ER stress induced by obatoclax, synergistically causing cell death in multiple myeloma.
Ramakrishnan V, Gomez M, Prasad V, Kimlinger T, Painuly U, Mukhopadhyay B, Haug J, Bi L, Rajkumar SV, Kumar S
Oncotarget 2016 Aug 30;7(35):56253-56265
Oncotarget 2016 Aug 30;7(35):56253-56265
Characterization of the autophagy marker protein Atg8 reveals atypical features of autophagy in Plasmodium falciparum.
Navale R, Atul, Allanki AD, Sijwali PS
PloS one 2014;9(11):e113220
PloS one 2014;9(11):e113220
No comments: Submit comment
Supportive validation
- Submitted by
- Invitrogen Antibodies (provider)
- Main image
- Experimental details
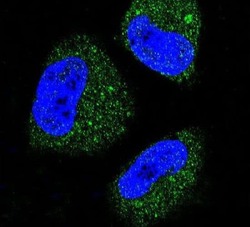
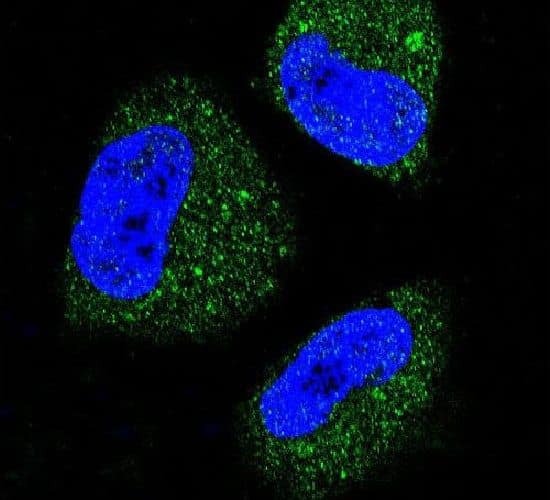
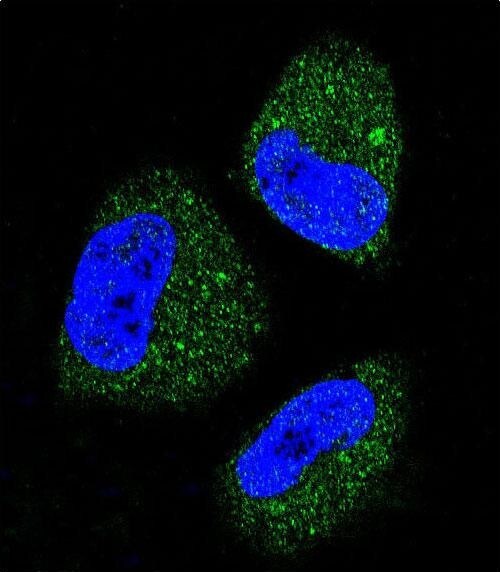
- Immunofluorescent analysis of NCI-H460 cells using a GRP78/HSPA5 polyclonal antibody (Product # PA5-11418) at a dilution of 1:10-50, followed by a fluor-conjugated goat anti-rabbit secondary antibody (green). Nuclei were stained with DAPI (blue).
- Submitted by
- Invitrogen Antibodies (provider)
- Main image

- Experimental details
- Immunocytochemistry analysis of GRP78 in NCI-H460 cells. Samples were incubated in GRP78 polyclonal antibody (Product # PA5-11418) followed by Alexa Fluor 488-conjugated goat anti-rabbit lgG (green). DAPI was used to stain the cell nuclear (blue).
Supportive validation
- Submitted by
- Invitrogen Antibodies (provider)
- Main image
- Experimental details
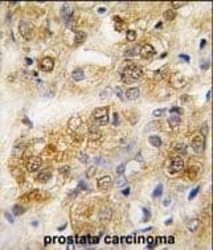
- Immunohistochemistry analysis of GRP78 in formalin-fixed and paraffin-embedded human prostate carcinoma tissue. Samples were incubated with GRP78 polyclonal antibody (Product # PA5-11418) which was peroxidase-conjugated to the secondary antibody, followed by DAB staining. This data demonstrates the use of this antibody for immunohistochemistry; clinical relevance has not been evaluated.
- Submitted by
- Invitrogen Antibodies (provider)
- Main image

- Experimental details
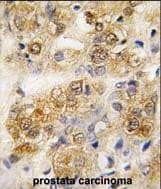
- Immunohistochemistry analysis of GRP78 in formalin-fixed and paraffin-embedded human testis tissue. Samples were incubated with GRP78 polyclonal antibody (Product # PA5-11418) which was peroxidase-conjugated to the secondary antibody, followed by AEC staining. This data demonstrates the use of this antibody for immunohistochemistry; clinical relevance has not been evaluated.

Supportive validation
- Submitted by
- Invitrogen Antibodies (provider)
- Main image
- Experimental details
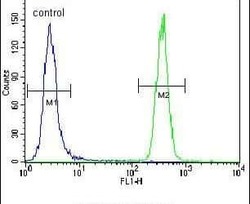
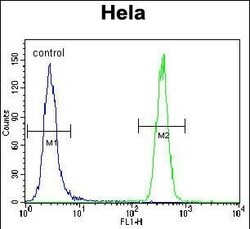
- Flow cytometry analysis of HeLa cells using a GRP78/HSPA5 polyclonal antibody (Product # PA5-11418) (right) compared to a negative control cell (left) at a dilution of 1:10-50, followed by a FITC-conjugated goat anti-rabbit antibody
- Submitted by
- Invitrogen Antibodies (provider)
- Main image
- Experimental details
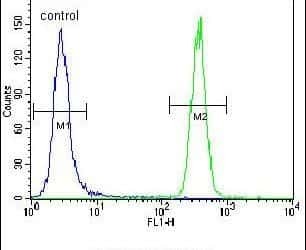
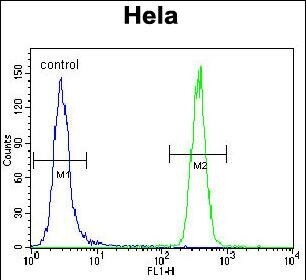
- Flow cytometry of GRP78 in Hela cells (right histogram). Samples were incubated with GRP78 polyclonal antibody (Product # PA5-11418) followed by FITC-conjugated goat-anti-rabbit secondary antibody. Negative control cell (left histogram).
Supportive validation
- Submitted by
- Invitrogen Antibodies (provider)
- Main image

- Experimental details
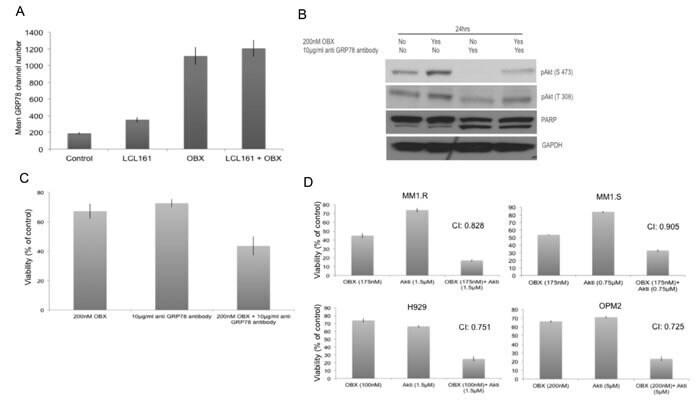
- Figure 5 A. MM1.R was left untreated or treated with 150nM OBX, 2muM LCL161 or the combination for 12hrs and cell surface expression of GRP78 was examined using flow cytometry. Y-axis represents mean GRP78 expression channel number. OBX has high auto fluorescence and hence results are presented as mean GRP78 expression channel number, which is the difference between mean channel number with GRP78 antibody and the mean channel number without GRP78 antibody for each treatment condition. Experiments were performed two times and error bars represent one standard deviation. B. MM1.R cells were treated with indicated concentrations of OBX, anti-GRP78 antibody (polyclonal antibody) or the combination and pAkt (S473), pAkt (T308) and PARP levels were examined by western blotting. GAPDH was used as a loading control. Experiments were performed two times and results from a representative experiment are shown. C. MM1.R cells were treated with indicated concentrations of OBX, anti GRP78 antibody (Clone C38) or the combination for 72hrs following which viability was measured by a MTT assay. OBX+GRP78 induced significantly more cell death than either of the agents alone ( p < 0.05). The results presented are the mean of 5 independent experiments. D. MM1.R, MM1.S, H929 and OPM2 cells were treated with various concentrations of OBX for 72hrs, various concentrations of Akti for 48hrs or the drugs in combination. MTT assays were performed. Synergy was seen across multiple concentrations. The c
- Submitted by
- Invitrogen Antibodies (provider)
- Main image
- Experimental details
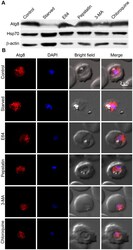
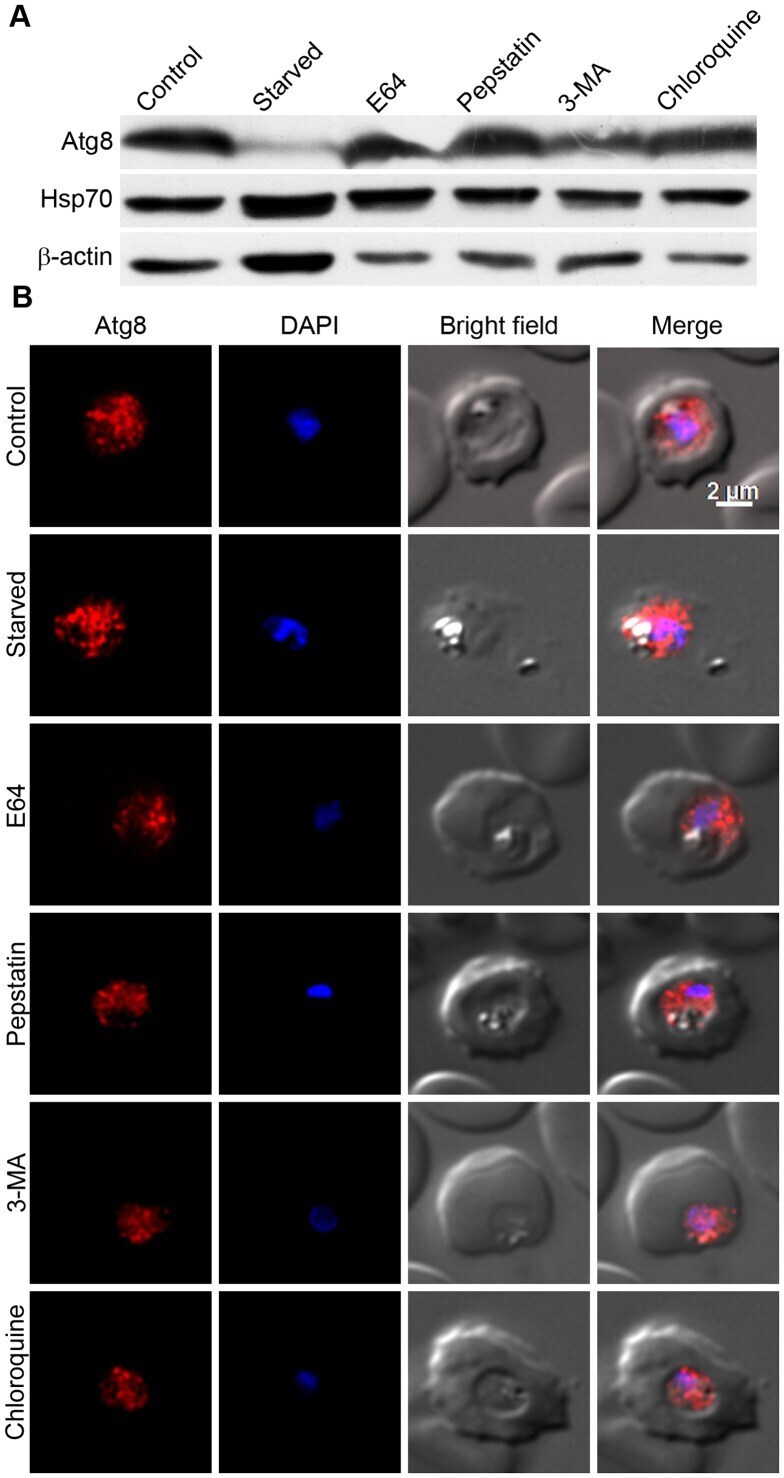
- Figure 8 Effects of typically used autophagy inducer/inhibitors on Atg8 levels and localization. Early/mid trophozoite stage parasites were cultured in HBSS (Starved) or in complete medium containing DMSO (Control) or the indicated autophagy inhibitors (5 mM 3MA, 30 nM CQ, 22 uM E64, and 220 uM pepstatin (Pep); all except 3MA are at concentrations 3x IC 50 ) for 8 hours, and then parasites were evaluated for expression of Atg8 by western blotting (A) or for localization of Atg8 by IFA (B) using anti-Atg8 antibodies as described in the Materials and Methods section. The same parasite samples were assessed for expression of the control proteins beta-actin (beta-Actin) and Hsp70 by western blotting as described in the Materials and Methods section. A . The immunoblot shows drastically reduced Atg8 levels in starved parasites and almost similar Atg8 levels in other parasite samples compared to control parasites. Both Hsp70 and beta-actin levels are similar in all except the starved parasites, which may be due to a starvation-induced stress response. B . The parasite images are labelled as in Figure 2 , and show similar Atg8 signal regardless of the treatment. The experiment was repeated three times, and the results were reproducible.
- Submitted by
- Invitrogen Antibodies (provider)
- Main image
- Experimental details
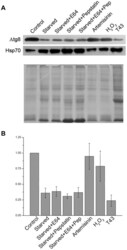
- Figure 10 Effects of stresses on autophagy. Early/mid trophozoite stage parasites were exposed to a variety of stresses by culturing in complete medium (Control) or in HBSS containing DMSO (Starved) or the indicated inhibitors (22 uM E64 (Starved+E64), 220 uM pepstatin (Starved+pepstatin), or both (Starved+E64+Pep)) at 37degC for 8 hours. For oxidative stress, parasites were grown in complete medium containing the indicated oxidative stress-causing agents (90 nM artemisinin (Artemisinin), 100 uM H 2 O 2 (H 2 O 2 )) at 37degC for 8 hours. For heat shock (T43), parasites were cultured in complete medium at 43degC for 8 hours. After 8 hours of the indicated treatments, equal amounts of parasite samples were evaluated for expression levels of Atg8 and Hsp70 by western blotting as described in the Materials and Methods section. Signal intensities of Atg8 in stressed parasite samples were compared with that in the control sample as mentioned in the Materials and Methods section. A . The blot clearly shows significantly lower Atg8 levels in starved and heat shock-stressed parasites than the control parasites; whereas artemisinin and H 2 O 2 -treated parasites have Atg8 expression levels similar to that of the control. Hsp70 expression, as expected, is significantly upregulated in starved and heat shock-stressed parasites. Notably, no effect of E64 and pepstatin alone or together on expression level of Atg8 in starved parasites suggests that downregulation of Atg8 levels is not due t

- Submitted by
- Invitrogen Antibodies (provider)
- Main image

- Experimental details
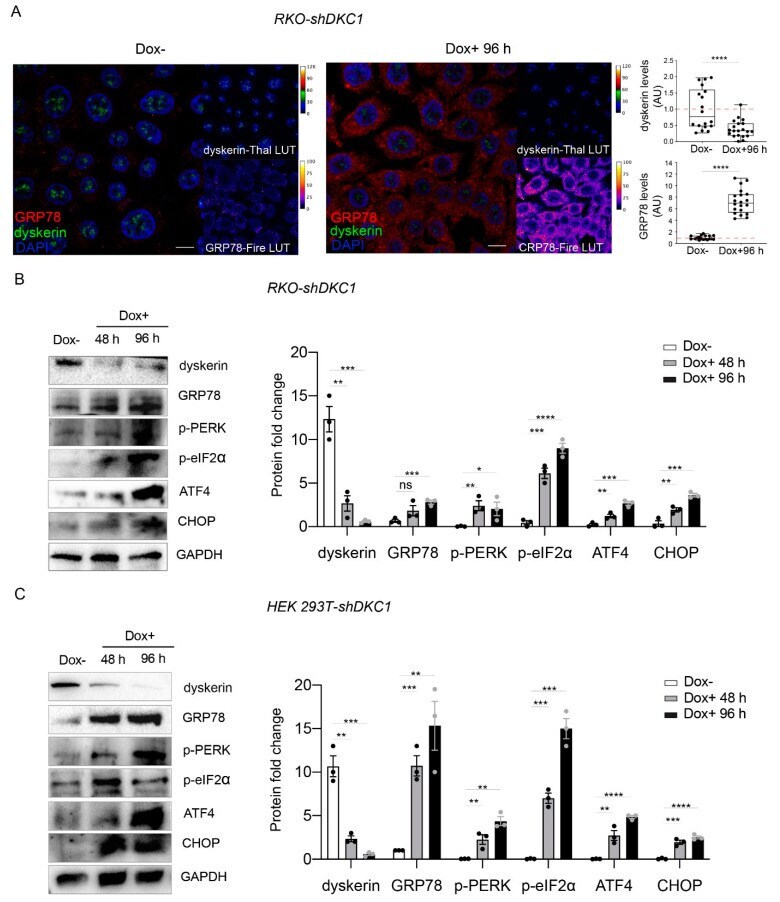
- Dyskerin depletion induces ERS and increases UPR markers. ( A ) Confocal images showing the dramatic increase in GRP78/BiP (red or Fire-Lut) expression in RKO-shDKC1 cells treated with Dox for 96 h (Dox+, right panel) compared to untreated control cells (Dox-, left panel). Dyskerin (green or Thal-Lut) downregulation is evident from the strong reduction in the relative signal in Dox+ cells. Nuclei were counterstained with DAPI. GRP78/BiP and dyskerin levels were quantified in multiple cells ( n = 18 RKO-shDKC1 Dox-; n = 20 RKO-shDKC1 Dox+ 96 h), normalized and reported relative to the Dox- condition as mean +- SEM. Scale bars 10 mum. ( B , C ) Western blot analysis confirming the upregulation of GRP78/BiP and showing the induction of key components of the PERK branch of UPR in RKO-shDKC1 ( B ) and HEK 293T-shDKC1 ( C ) Dox-treated (Dox+) cells for 48 or 96 h. Protein levels were normalized to GAPDH. Data are shown as mean +- SEM ( n = 3). All statistical analyses were performed using an unpaired one-tailed t -test in pairwise comparisons with respect to the Dox- condition (**** p < 0.0001; *** p < 0.001; ** p < 0.01; * p < 0.05; ns, p > 0.05).