Explore
 Validate
 Learn
Learn Western blot
 Other assay
Antibody data
- Antibody Data
- Antigen structure
- References [1]
- Comments [0]
- Validations
- Other assay [7]
Submit
Validation data
Reference
Comment
Report error
- Product number
- MA5-45984 - Provider product page

- Provider
- Invitrogen Antibodies
- Product name
- Factor VIII Monoclonal Antibody (F8-5.5.72)
- Antibody type
- Monoclonal
- Antigen
- Purifed from natural sources
- Description
- MA1-10589 detects full-length human Factor VIII. This antibody does not cross-react with von Willebrand factor. MA1-10589 has been successfully used in ELISA and Western blot applications. The MA1-10589 immunogen is purified human Factor VIII.
- Reactivity
- Human
- Host
- Mouse
- Isotype
- IgG
- Antibody clone number
- F8-5.5.72
- Vial size
- 1 mg
- Concentration
- 0.9 mg/mL
- Storage
- -20° C, Avoid Freeze/Thaw Cycles
Submitted references Factor VIII Is Synthesized in Human Endothelial Cells, Packaged in Weibel-Palade Bodies and Secreted Bound to ULVWF Strings.
Turner NA, Moake JL
PloS one 2015;10(10):e0140740
PloS one 2015;10(10):e0140740
No comments: Submit comment
Supportive validation
- Submitted by
- Invitrogen Antibodies (provider)
- Main image
- Experimental details
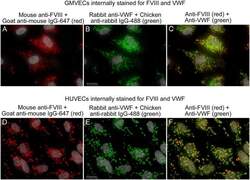
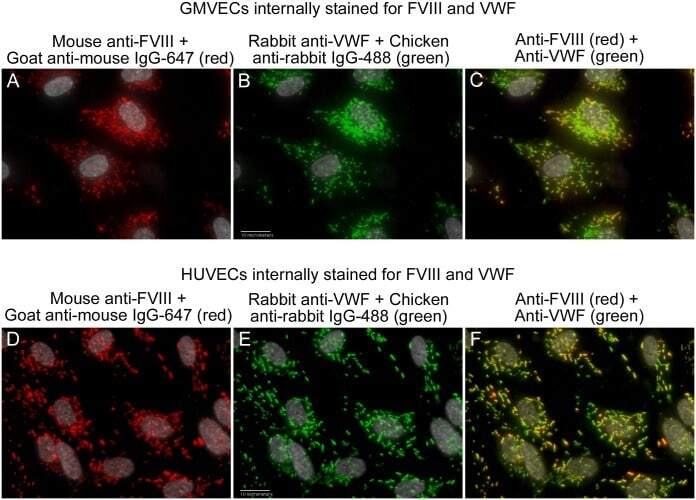
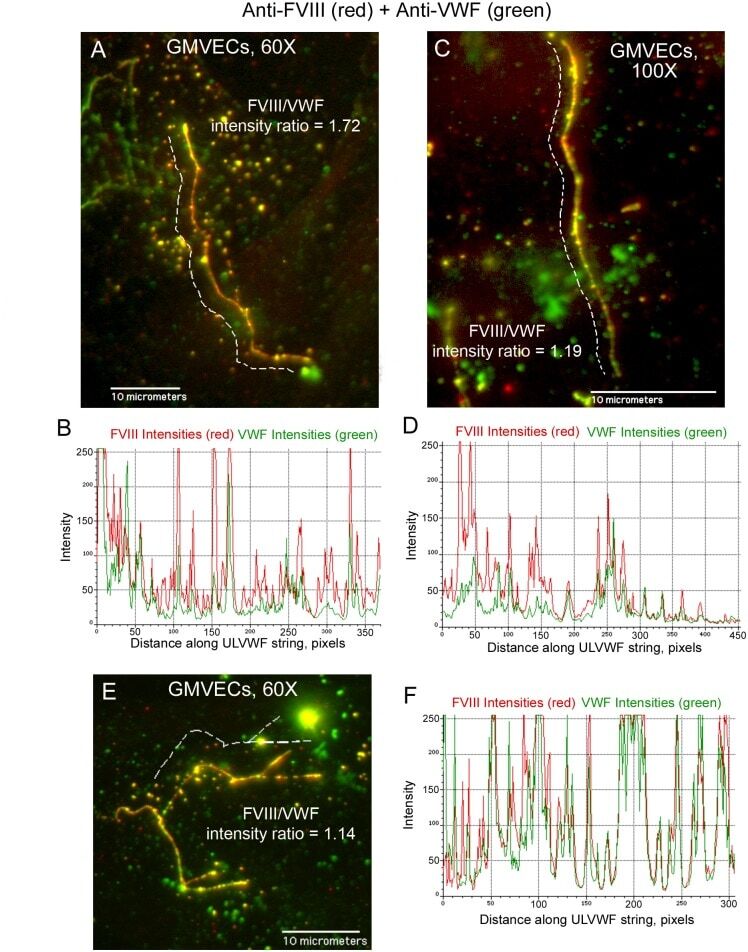
- Fig 3 FVIII and VWF are present in the WPBs of GMVECs and HUVECs. Unstimulated GMVECs and HUVECs were fixed and treated with Triton-X to allow intracellular staining. Cells were then stained with mouse monoclonal anti-human FVIII plus goat anti-mouse AF IgG-647 (red), followed by staining with rabbit anti-human VWF plus chicken anti-rabbit AF IgG-488 (green). GMVEC images: (A) anti-FVIII detection (red); (B) anti-VWF detection (green); and (C) merged image of anti-FVIII plus anti-VWF. HUVEC images: (D) anti-FVIII detection (red); (E) anti-VWF detection (green); and (F) anti-FVIII plus anti-VWF. Images at 60x are shown merged with DAPI-detected nuclei (gray) and are representative of 5-7 experiments.
- Submitted by
- Invitrogen Antibodies (provider)
- Main image
- Experimental details
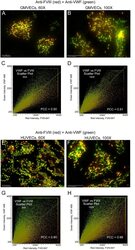
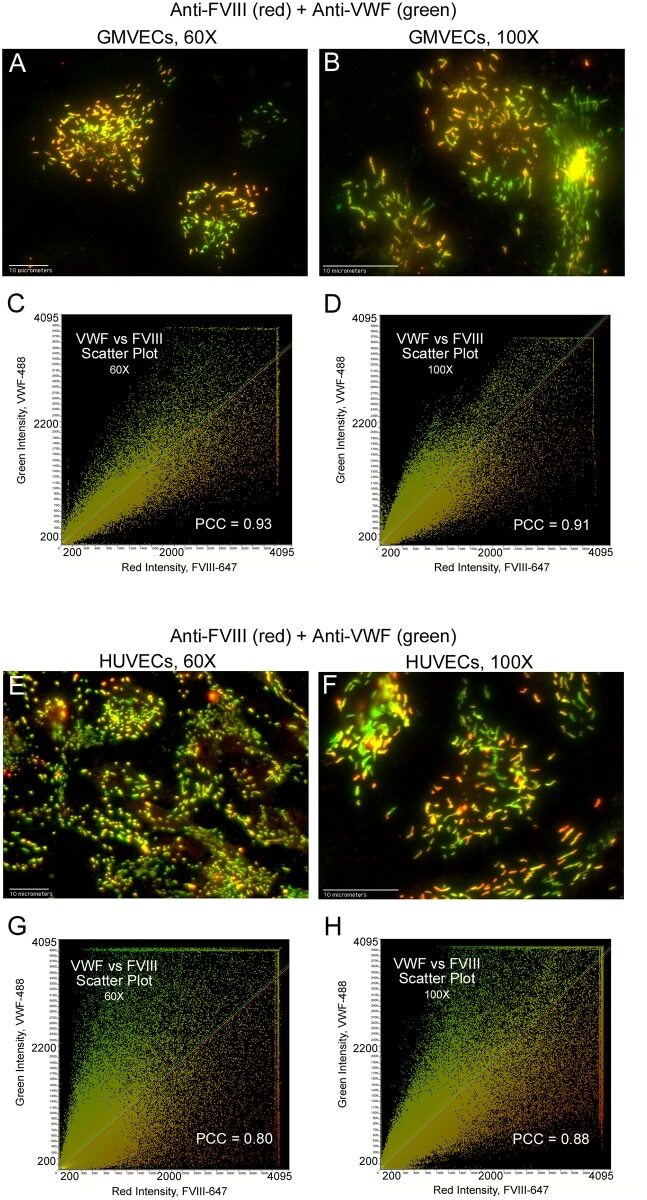
- Fig 5 Statistical confirmation of the presence of FVIII and VWF in WPBs. GMVECs and HUVECs were treated with Triton-X to allow internal staining. Cells were then stained with mouse monoclonal anti-human FVIII plus goat anti-mouse IgG AF-647 (red) followed by staining with rabbit anti-human VWF plus chicken anti-rabbit IgG AF-488 (green). Merged images of FVIII and VWF detection, along with the corresponding intensity scatter plot, are shown in: (A and C) GMVECs at 60x, N = 4; (B and D) GMVECs at 100x, N = 5; (E and G) HUVECs at 60x, N = 7; and (F and H) HUVECs at 100x, N = 7. Values for Pearson's correlation coefficient (PCC) are on each scatter plot.
- Submitted by
- Invitrogen Antibodies (provider)
- Main image

- Experimental details
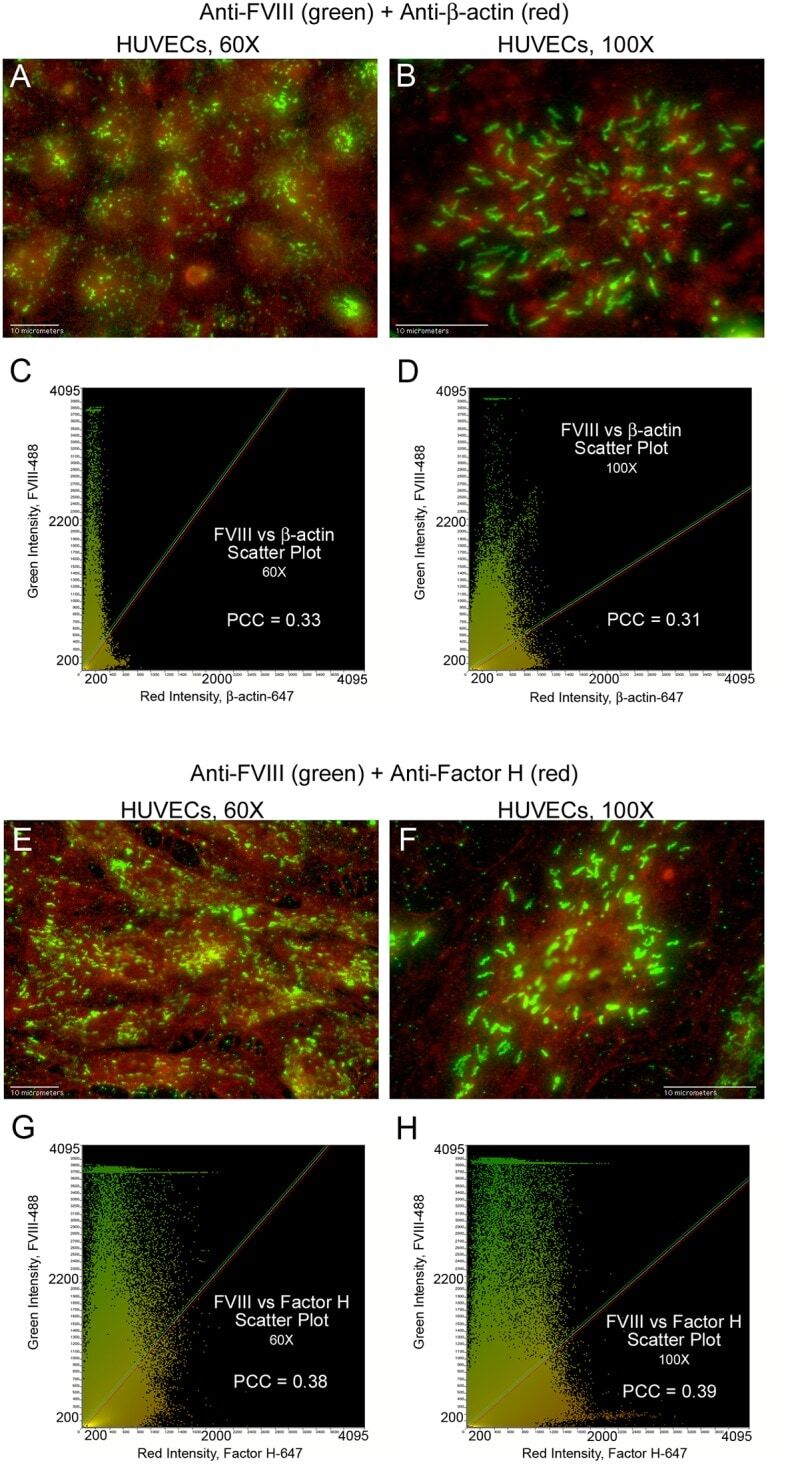
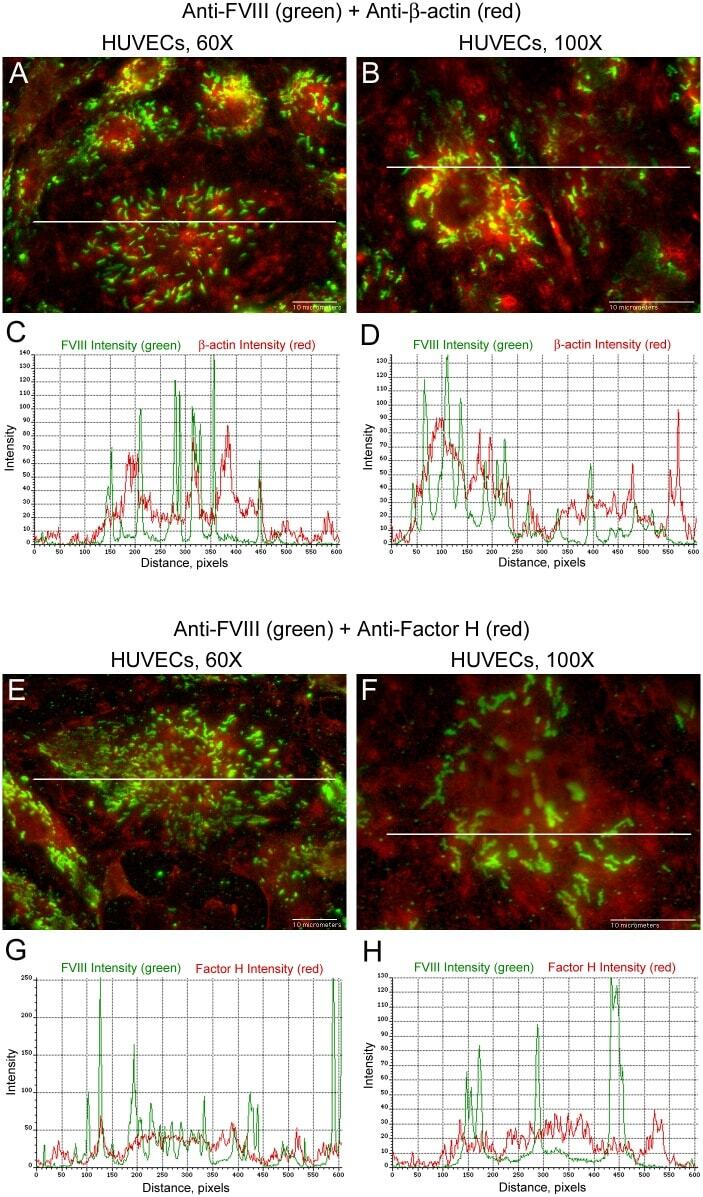
- Fig 6 FVIII in HUVEC WPBs does not overlap with beta-actin or Factor H. HUVECs were fixed and treated with Triton-X prior to staining with mouse monoclonal anti-FVIII plus donkey anti-mouse IgG AF-488 (green). This was followed by staining either with goat anti-beta-actin plus chicken anti-goat IgG AF-647 (red) or with goat anti-Factor H plus chicken anti-goat IgG AF-647 (red). Merged images and the corresponding intensity scatter plots are: (A and C) FVIII and beta-actin at 60x, N = 4; (B and D) FVIII and beta-actin at 100x, N = 4; (E and G) FVIII and Factor H at 60x, N = 3; and (F and H) FVIII and Factor H at 100x, N = 3. Values for Pearson's correlation coefficient (PCC) are on each scatter plot.
- Submitted by
- Invitrogen Antibodies (provider)
- Main image
- Experimental details
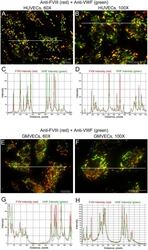
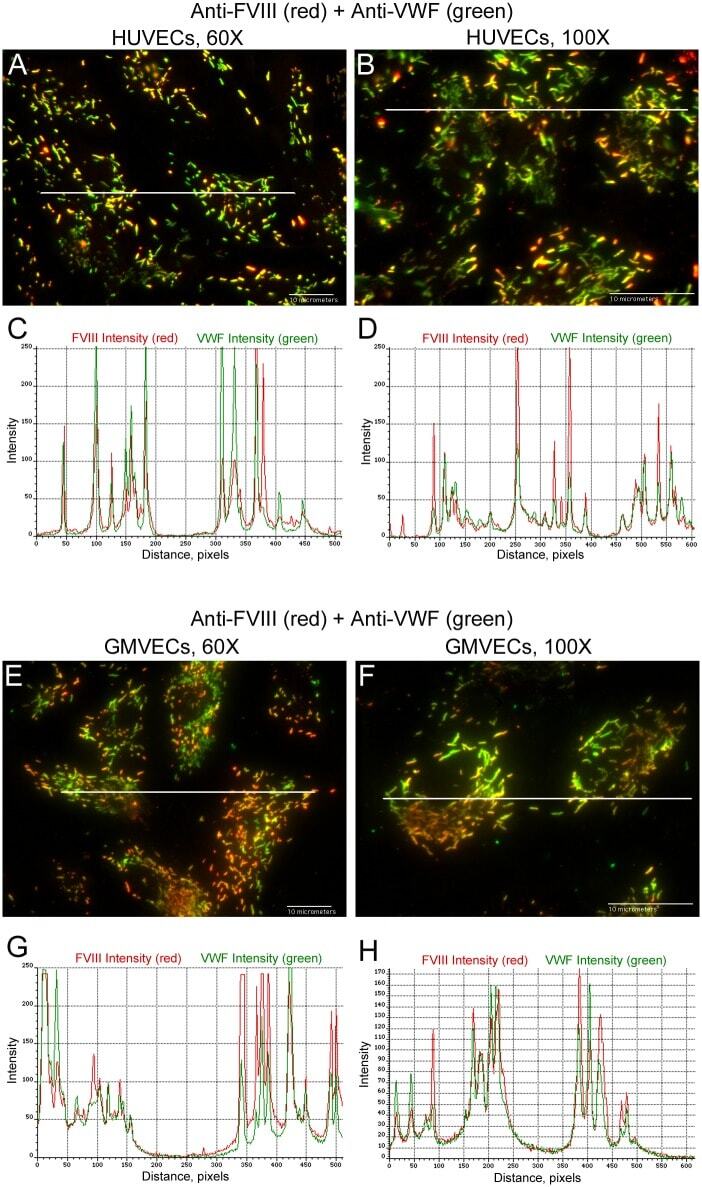
- Fig 7 Intensity measurements of FVIII in WPBs synchronize with VWF intensities at identical locations. HUVECs (A and B) and GMVECs (E and F) were internally stained with mouse monoclonal anti-human FVIII plus goat anti-mouse IgG AF-647 (red) and with rabbit anti-human VWF plus chicken anti-rabbit IgG AF-488 (green). Graphs show the red (FVIII) and green (VWF) intensity values measured along a 68-mum line (from 60x images in graphs C and G) and a 35-mum line (from 100x images in graphs D and H) that traverses the WPBs. The data are representative of 5 experiments with GMVECs and 7 experiments with HUVECs.
- Submitted by
- Invitrogen Antibodies (provider)
- Main image
- Experimental details
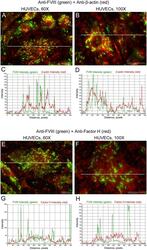
- Fig 8 Intensity measurements of FVIII in HUVEC WPBs are not synchronized with intensities of beta-actin or Factor H. HUVECs were internally stained with mouse monoclonal anti-human FVIII plus donkey anti-mouse IgG AF-488 (green), followed by staining either (A and B) with goat anti-beta-actin plus chicken anti-goat IgG AF-647 (red) or (E and F) with goat anti-Factor H plus chicken anti-goat IgG AF-647 (red). Graphs below each merged image show the green intensity values of FVIII plus either: (C and D) the red intensity values of beta-actin; or (G and H) the red intensity values of Factor H. The intensity values in the graphs were measured along lines that traverses FVIII detection in WPBs. Line lengths are 68 mum in 60x images and 35 mum in 100x images. N = 4 for FVIII measurement with beta-actin and N = 3 for FVIII measurement with Factor H.
- Submitted by
- Invitrogen Antibodies (provider)
- Main image
- Experimental details
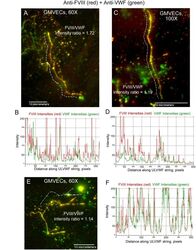
- Fig 9 FVIII is secreted from stimulated GMVECs bound to ULVWF strings. GMVECs were stimulated with 100 muM histamine for 2 min. Cells were then stained with rabbit anti-VWF plus chicken anti-rabbit IgG AF-488 (green), washed and fixed. Following fixation, the cells were stained with mouse monoclonal anti-FVIII plus goat anti-mouse IgG AF-647 (red). Panels (A, C and E) show representative ULVWF strings with bound FVIII from merged images. Dashed lines (that were moved away to not obscure the string image) indicate the measured portions of the string. Corresponding graphs (B from image A, D from image C, and F from image E) show the intensities from the 488-nm (VWF, green) and 647-nm (FVIII, red) channels measured along the ULVWF string (in pixels) in the merged image. In the 60x images (A and E) 100 pixels = 11.4 mum and in the 100x image (C) 200 pixels = 11.8 mum. The ratio of FVIII intensity/VWF intensity is shown for each ULVWF string. Images are representative of 9-11 experiments.
- Submitted by
- Invitrogen Antibodies (provider)
- Main image
- Experimental details
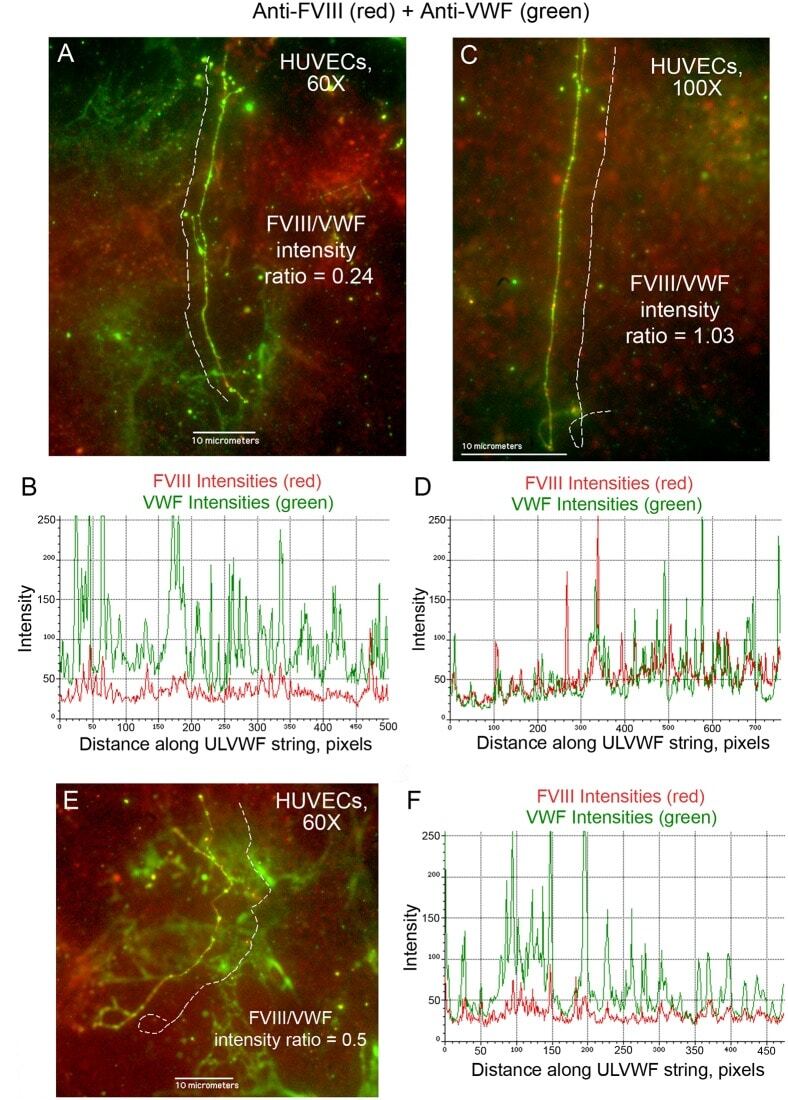
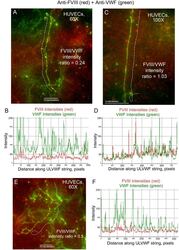
- Fig 10 Less FVIII is bound to secreted/anchored ULVWF strings from stimulated HUVECs compared to GMVECs. HUVECs were stimulated with 100muM histamine for 2 min. Cells were then stained as described in the legend for Fig 9 with rabbit anti-VWF plus chicken anti-rabbit IgG AF-488 (green), and with mouse monoclonal anti-FVIII plus goat anti-mouse IgG AF-647 (red). Panels (A, C and E) show representative ULVWF strings with bound FVIII from merged images. The HUVEC-secreted/anchored ULVWF string in panel (A) has predominant VWF detection and further verifies the specificity of the VWF and FVIII antibodies and their distinct fluorescent signals. Dashed lines (that were moved away to not obscure the string image) indicate the measured portions of the string. Graphs (B from image A, D from image C, and F from image E) show the intensities from the 488-nm (VWF, green) and 647-nm (FVIII, red) channels measured along the ULVWF string (in pixels) from the corresponding merged image. In the 60x images (A and E) 100 pixels = 11.4 mum and in the 100x image (C) 200 pixels = 11.8 mum. The ratio of FVIII intensity/VWF intensity is shown for each ULVWF string. Images are representative of 4 experiments.