Explore
 Validate
 Learn
Learn Western blot
 Immunohistochemistry
Antibody data
- Antibody Data
- Antigen structure
- References [18]
- Comments [0]
- Validations
- Immunohistochemistry [1]
- Flow cytometry [1]
- Other assay [29]
Submit
Validation data
Reference
Comment
Report error
- Product number
- 38-5400 - Provider product page

- Provider
- Invitrogen Antibodies
- Product name
- SMAD1 Polyclonal Antibody
- Antibody type
- Polyclonal
- Antigen
- Synthetic peptide
- Reactivity
- Human, Mouse
- Host
- Rabbit
- Isotype
- IgG
- Vial size
- 100 μg
- Concentration
- 0.25 mg/mL
- Storage
- -20°C
Submitted references Pinhead antagonizes Admp to promote notochord formation.
Bone morphogenetic protein 7 promotes resistance to immunotherapy.
Pinhead signaling regulates mesoderm heterogeneity via the FGF receptor-dependent pathway.
TGF-β family ligands exhibit distinct signalling dynamics that are driven by receptor localisation.
The Dynamics of TGF-β Signaling Are Dictated by Receptor Trafficking via the ESCRT Machinery.
ZC4H2 stabilizes Smads to enhance BMP signalling, which is involved in neural development in Xenopus.
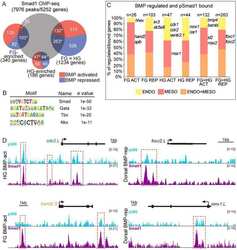
Genomic integration of Wnt/β-catenin and BMP/Smad1 signaling coordinates foregut and hindgut transcriptional programs.
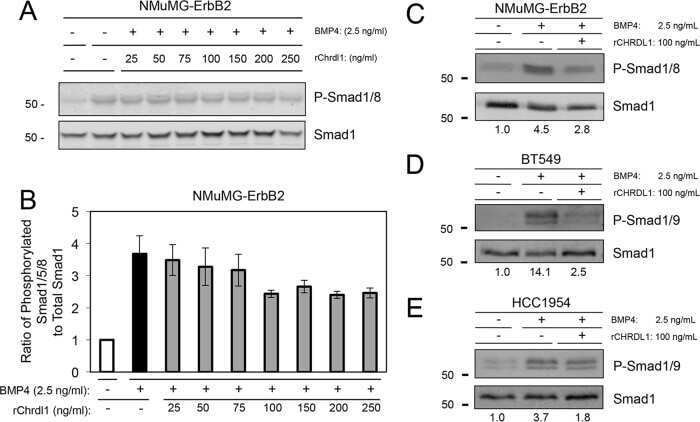
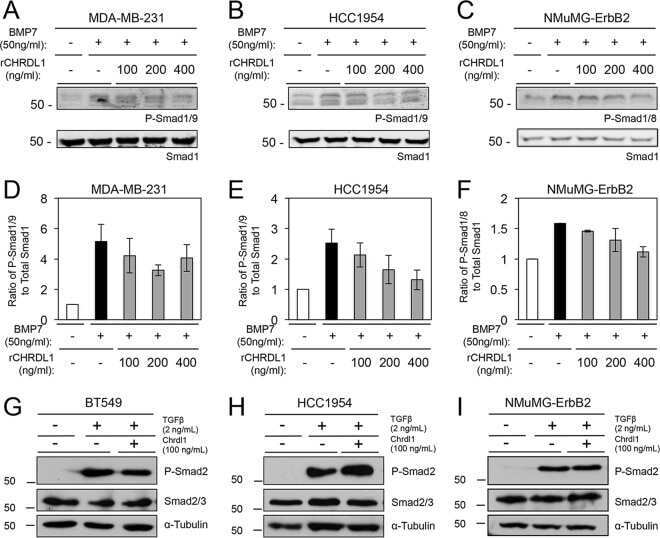
Chordin-Like 1 Suppresses Bone Morphogenetic Protein 4-Induced Breast Cancer Cell Migration and Invasion.
BMPR1A antagonist differentially affects cartilage and bone formation during fracture healing.
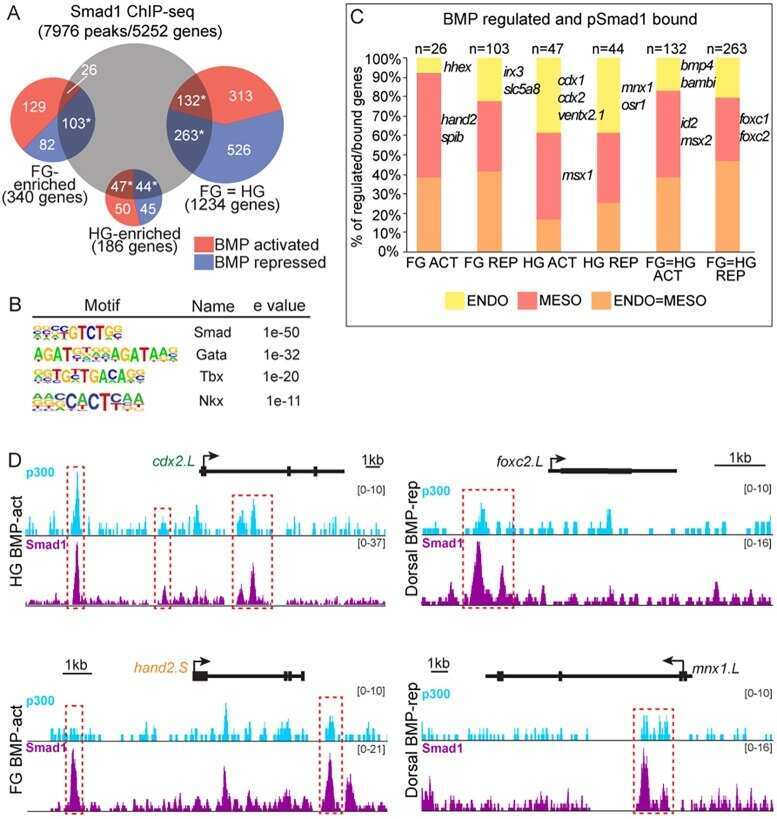
The Proto-oncogene Transcription Factor Ets1 Regulates Neural Crest Development through Histone Deacetylase 1 to Mediate Output of Bone Morphogenetic Protein Signaling.
Pyruvate Dehydrogenase Kinase 4 Promotes Vascular Calcification via SMAD1/5/8 Phosphorylation.
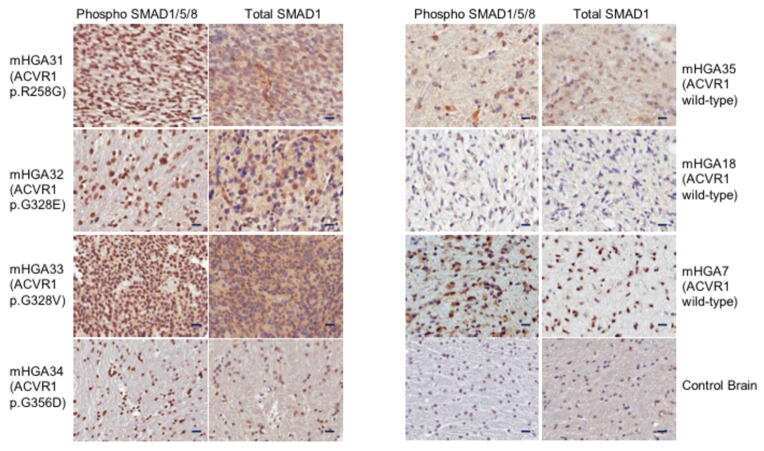
Recurrent somatic mutations in ACVR1 in pediatric midline high-grade astrocytoma.
Expression of GATA3 in MDA-MB-231 triple-negative breast cancer cells induces a growth inhibitory response to TGFß.
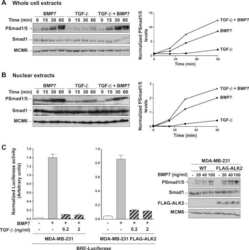
Transforming growth factor β inhibits bone morphogenetic protein-induced transcription through novel phosphorylated Smad1/5-Smad3 complexes.
SNW1 is a critical regulator of spatial BMP activity, neural plate border formation, and neural crest specification in vertebrate embryos.
Distinct modes of inhibition by sclerostin on bone morphogenetic protein and Wnt signaling pathways.
Growth/differentiation factor-15 inhibits differentiation into osteoclasts--a novel factor involved in control of osteoclast differentiation.
BMP7 and SHH regulate Pax2 in mouse retinal astrocytes by relieving TLX repression.
Itoh K, Ossipova O, Sokol SY
iScience 2021 Jun 25;24(6):102520
iScience 2021 Jun 25;24(6):102520
Bone morphogenetic protein 7 promotes resistance to immunotherapy.
Cortez MA, Masrorpour F, Ivan C, Zhang J, Younes AI, Lu Y, Estecio MR, Barsoumian HB, Menon H, Caetano MDS, Ramapriyan R, Schoenhals JE, Wang X, Skoulidis F, Wasley MD, Calin G, Hwu P, Welsh JW
Nature communications 2020 Sep 24;11(1):4840
Nature communications 2020 Sep 24;11(1):4840
Pinhead signaling regulates mesoderm heterogeneity via the FGF receptor-dependent pathway.
Ossipova O, Itoh K, Radu A, Ezan J, Sokol SY
Development (Cambridge, England) 2020 Sep 11;147(17)
Development (Cambridge, England) 2020 Sep 11;147(17)
TGF-β family ligands exhibit distinct signalling dynamics that are driven by receptor localisation.
Miller DSJ, Schmierer B, Hill CS
Journal of cell science 2019 Jul 15;132(14)
Journal of cell science 2019 Jul 15;132(14)
The Dynamics of TGF-β Signaling Are Dictated by Receptor Trafficking via the ESCRT Machinery.
Miller DSJ, Bloxham RD, Jiang M, Gori I, Saunders RE, Das D, Chakravarty P, Howell M, Hill CS
Cell reports 2018 Nov 13;25(7):1841-1855.e5
Cell reports 2018 Nov 13;25(7):1841-1855.e5
ZC4H2 stabilizes Smads to enhance BMP signalling, which is involved in neural development in Xenopus.
Ma P, Ren B, Yang X, Sun B, Liu X, Kong Q, Li C, Mao B
Open biology 2017 Aug;7(8)
Open biology 2017 Aug;7(8)
Genomic integration of Wnt/β-catenin and BMP/Smad1 signaling coordinates foregut and hindgut transcriptional programs.
Stevens ML, Chaturvedi P, Rankin SA, Macdonald M, Jagannathan S, Yukawa M, Barski A, Zorn AM
Development (Cambridge, England) 2017 Apr 1;144(7):1283-1295
Development (Cambridge, England) 2017 Apr 1;144(7):1283-1295
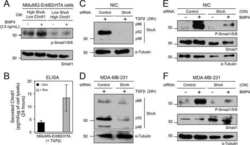
Chordin-Like 1 Suppresses Bone Morphogenetic Protein 4-Induced Breast Cancer Cell Migration and Invasion.
Cyr-Depauw C, Northey JJ, Tabariès S, Annis MG, Dong Z, Cory S, Hallett M, Rennhack JP, Andrechek ER, Siegel PM
Molecular and cellular biology 2016 May 15;36(10):1509-25
Molecular and cellular biology 2016 May 15;36(10):1509-25
BMPR1A antagonist differentially affects cartilage and bone formation during fracture healing.
Morgan EF, Pittman J, DeGiacomo A, Cusher D, de Bakker CM, Mroszczyk KA, Grinstaff MW, Gerstenfeld LC
Journal of orthopaedic research : official publication of the Orthopaedic Research Society 2016 Dec;34(12):2096-2105
Journal of orthopaedic research : official publication of the Orthopaedic Research Society 2016 Dec;34(12):2096-2105
The Proto-oncogene Transcription Factor Ets1 Regulates Neural Crest Development through Histone Deacetylase 1 to Mediate Output of Bone Morphogenetic Protein Signaling.
Wang C, Kam RK, Shi W, Xia Y, Chen X, Cao Y, Sun J, Du Y, Lu G, Chen Z, Chan WY, Chan SO, Deng Y, Zhao H
The Journal of biological chemistry 2015 Sep 4;290(36):21925-38
The Journal of biological chemistry 2015 Sep 4;290(36):21925-38
Pyruvate Dehydrogenase Kinase 4 Promotes Vascular Calcification via SMAD1/5/8 Phosphorylation.
Lee SJ, Jeong JY, Oh CJ, Park S, Kim JY, Kim HJ, Doo Kim N, Choi YK, Do JY, Go Y, Ha CM, Choi JY, Huh S, Ho Jeoung N, Lee KU, Choi HS, Wang Y, Park KG, Harris RA, Lee IK
Scientific reports 2015 Nov 12;5:16577
Scientific reports 2015 Nov 12;5:16577
Recurrent somatic mutations in ACVR1 in pediatric midline high-grade astrocytoma.
Fontebasso AM, Papillon-Cavanagh S, Schwartzentruber J, Nikbakht H, Gerges N, Fiset PO, Bechet D, Faury D, De Jay N, Ramkissoon LA, Corcoran A, Jones DT, Sturm D, Johann P, Tomita T, Goldman S, Nagib M, Bendel A, Goumnerova L, Bowers DC, Leonard JR, Rubin JB, Alden T, Browd S, Geyer JR, Leary S, Jallo G, Cohen K, Gupta N, Prados MD, Carret AS, Ellezam B, Crevier L, Klekner A, Bognar L, Hauser P, Garami M, Myseros J, Dong Z, Siegel PM, Malkin H, Ligon AH, Albrecht S, Pfister SM, Ligon KL, Majewski J, Jabado N, Kieran MW
Nature genetics 2014 May;46(5):462-6
Nature genetics 2014 May;46(5):462-6
Expression of GATA3 in MDA-MB-231 triple-negative breast cancer cells induces a growth inhibitory response to TGFß.
Chu IM, Lai WC, Aprelikova O, El Touny LH, Kouros-Mehr H, Green JE
PloS one 2013;8(4):e61125
PloS one 2013;8(4):e61125
Transforming growth factor β inhibits bone morphogenetic protein-induced transcription through novel phosphorylated Smad1/5-Smad3 complexes.
Grönroos E, Kingston IJ, Ramachandran A, Randall RA, Vizán P, Hill CS
Molecular and cellular biology 2012 Jul;32(14):2904-16
Molecular and cellular biology 2012 Jul;32(14):2904-16
SNW1 is a critical regulator of spatial BMP activity, neural plate border formation, and neural crest specification in vertebrate embryos.
Wu MY, Ramel MC, Howell M, Hill CS
PLoS biology 2011 Feb 15;9(2):e1000593
PLoS biology 2011 Feb 15;9(2):e1000593
Distinct modes of inhibition by sclerostin on bone morphogenetic protein and Wnt signaling pathways.
Krause C, Korchynskyi O, de Rooij K, Weidauer SE, de Gorter DJ, van Bezooijen RL, Hatsell S, Economides AN, Mueller TD, Löwik CW, ten Dijke P
The Journal of biological chemistry 2010 Dec 31;285(53):41614-26
The Journal of biological chemistry 2010 Dec 31;285(53):41614-26
Growth/differentiation factor-15 inhibits differentiation into osteoclasts--a novel factor involved in control of osteoclast differentiation.
Vanhara P, Lincová E, Kozubík A, Jurdic P, Soucek K, Smarda J
Differentiation; research in biological diversity 2009 Nov;78(4):213-22
Differentiation; research in biological diversity 2009 Nov;78(4):213-22
BMP7 and SHH regulate Pax2 in mouse retinal astrocytes by relieving TLX repression.
Sehgal R, Sheibani N, Rhodes SJ, Belecky Adams TL
Developmental biology 2009 Aug 15;332(2):429-43
Developmental biology 2009 Aug 15;332(2):429-43
No comments: Submit comment
Supportive validation
- Submitted by
- Invitrogen Antibodies (provider)
- Main image
- Experimental details
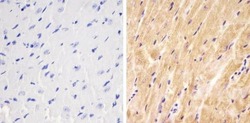
- Immunohistochemistry analysis of SMAD1 showing staining in the cytoplasm of paraffin-embedded mouse heart tissue (right) compared to a negative control without primary antibody (left). To expose target proteins, antigen retrieval was performed using 10mM sodium citrate (pH 6.0), microwaved for 8-15 min. Following antigen retrieval, tissues were blocked in 3% H2O2-methanol for 15 min at room temperature, washed with ddH2O and PBS, and then probed with a SMAD1 Rabbit Polyclonal Antibody (Product # 38-5400) diluted in 3% BSA-PBS at a dilution of 1:20 overnight at 4°C in a humidified chamber. Tissues were washed extensively in PBST and detection was performed using an HRP-conjugated secondary antibody followed by colorimetric detection using a DAB kit. Tissues were counterstained with hematoxylin and dehydrated with ethanol and xylene to prep for mounting.

Supportive validation
- Submitted by
- Invitrogen Antibodies (provider)
- Main image
- Experimental details
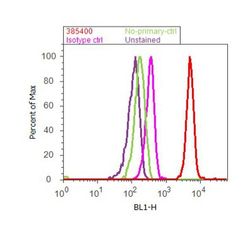
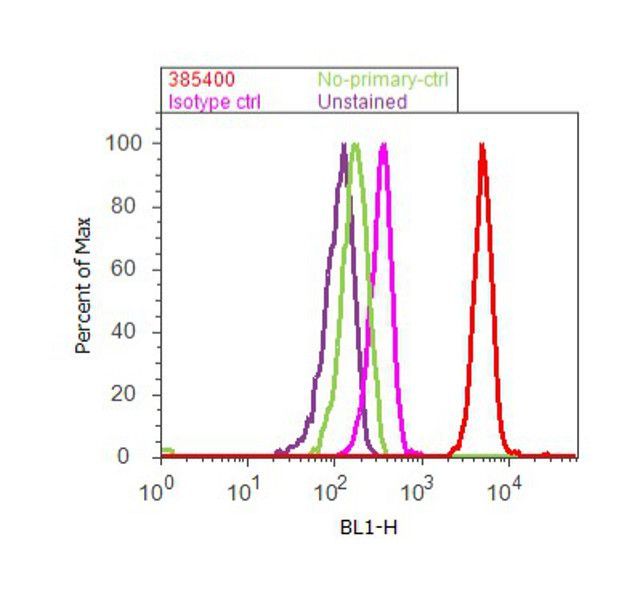
- Flow cytometry analysis of SMAD1 was done on A549 cells. Cells were fixed with 70% ethanol for 10 minutes, permeabilized with 0.25% Tritonª X-100 for 20 minutes, and blocked with 5% BSA for 30 minutes at room temperature. Cells were labeled with SMAD1 Recombinant Rabbit Polyclonal Antibody (385400, red histogram) or with rabbit isotype control (pink histogram) at 3-5 µg/million cells in 2.5% BSA. After incubation at room temperature for 2 hours, the cells were labeled with Alexa Fluor¨ 488 Goat Anti-Rabbit Secondary Antibody (A11008) at a dilution of 1:400 for 30 minutes at room temperature. The representative 10,000 cells were acquired and analyzed for each sample using an Attune¨ Acoustic Focusing Cytometer. The purple histogram represents unstained control cells and the green histogram represents no-primary-antibody control.
Supportive validation
- Submitted by
- Invitrogen Antibodies (provider)
- Main image
- Experimental details
- NULL

- Submitted by
- Invitrogen Antibodies (provider)
- Main image
- Experimental details
- NULL

- Submitted by
- Invitrogen Antibodies (provider)
- Main image
- Experimental details
- NULL
- Submitted by
- Invitrogen Antibodies (provider)
- Main image
- Experimental details
- NULL

- Submitted by
- Invitrogen Antibodies (provider)
- Main image

- Experimental details
- NULL
- Submitted by
- Invitrogen Antibodies (provider)
- Main image

- Experimental details
- NULL
- Submitted by
- Invitrogen Antibodies (provider)
- Main image
- Experimental details
- NULL

- Submitted by
- Invitrogen Antibodies (provider)
- Main image
- Experimental details
- NULL
- Submitted by
- Invitrogen Antibodies (provider)
- Main image

- Experimental details
- NULL
- Submitted by
- Invitrogen Antibodies (provider)
- Main image
- Experimental details
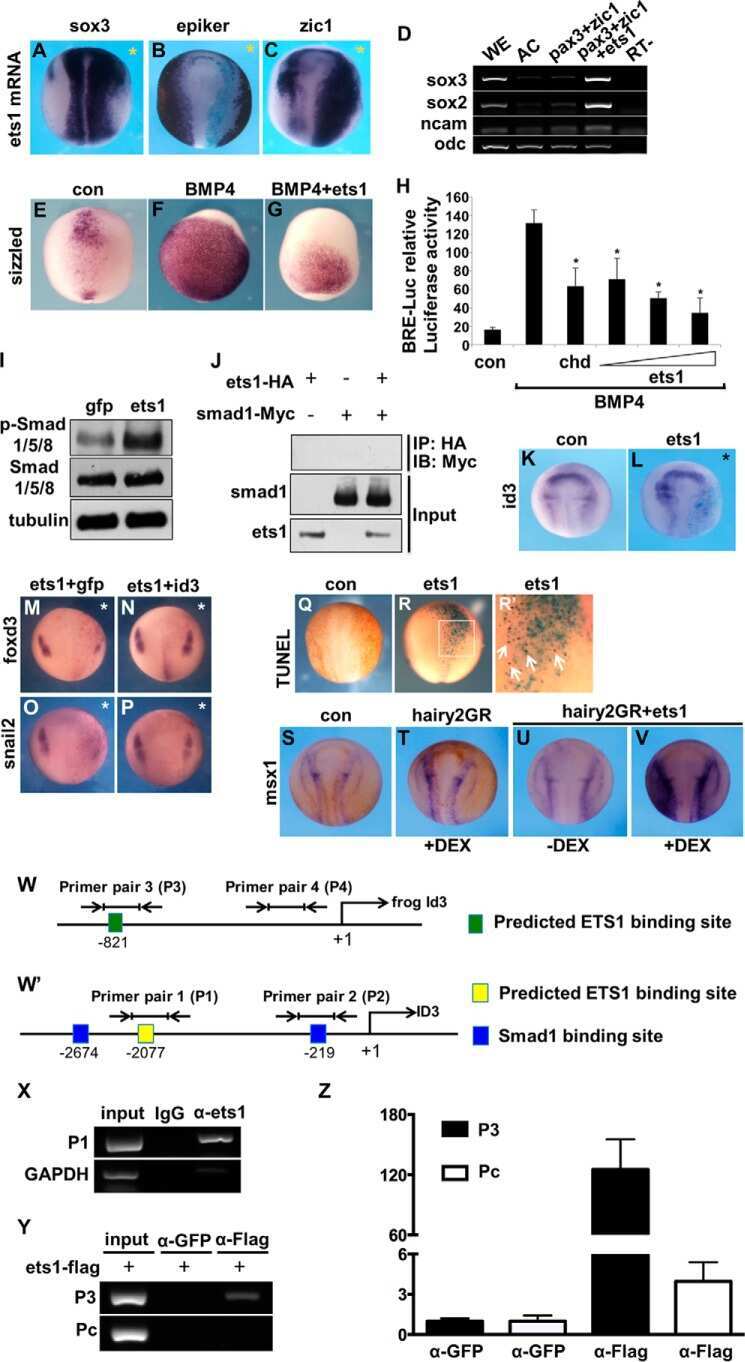
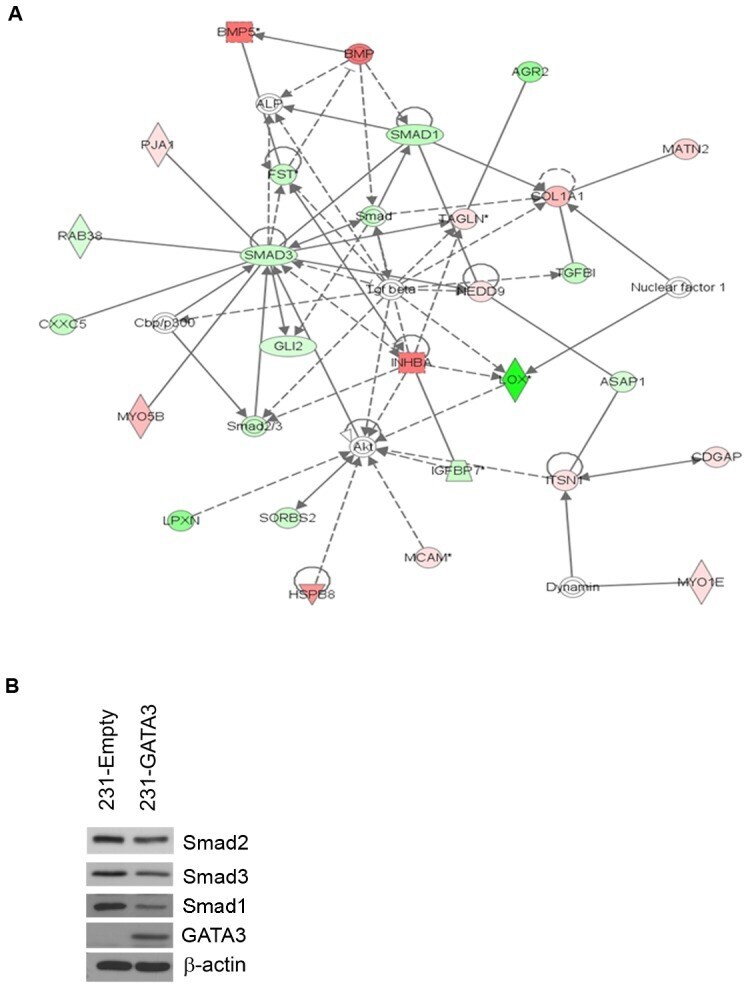
- Figure 2 GATA3 reduces effectors in the TGFss1 pathway in MB-231 cells. (A) Ingenuity network analysis of 231-Empty vs. 231-GATA3 cells. Genes that were differentially expressed in 231-Empty vs. 231-GATA3 cells (p1.5) were input into Ingenuity Pathway analysis. One of the top networks identified demonstrated changes in several TGFss1 effectors. (B) Western blot of 231-Empty and 231-GATA3 cells validating changes in expression of Smad2, Smad3 and Smad1 between 231-Emtpy and 231-GATA3 cells.
- Submitted by
- Invitrogen Antibodies (provider)
- Main image
- Experimental details
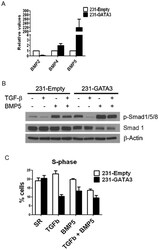
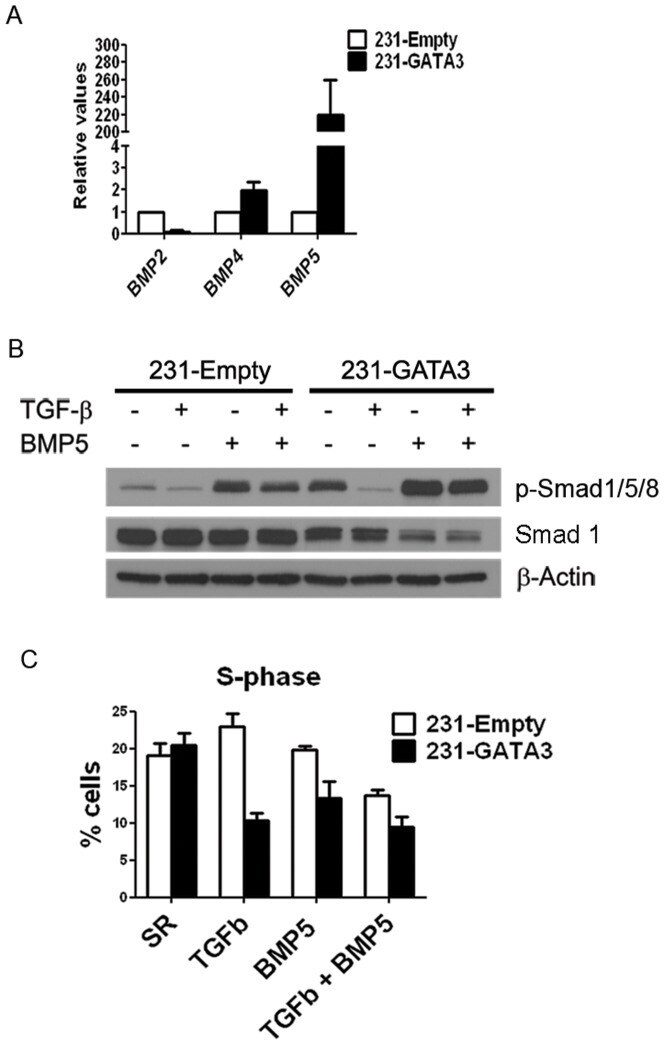
- Figure 7 GATA3 upregulates BMP5 in MB-231 cells. (A) Q-RT-PCR showing expression of BMP2, BMP4 and BMP5 in 231-Empty and 231-GATA3 cells. GATA3 significantly upregulates BMP5 expression in MB-231 cells. (B) Western Blot analysis showing increased pSMAD1/5/8 in TGFss1+BMP5 treated 231-GATA3 cells compared to 231-Empty cells. ss-actin was used as a loading control. (C) BrdU incorporation in pulse-labeled 231-Empty and 231-GATA3 cells as measured by flow cytometry. Bar graph shows % cells in S phase (mean +/- SEM).
- Submitted by
- Invitrogen Antibodies (provider)
- Main image
- Experimental details
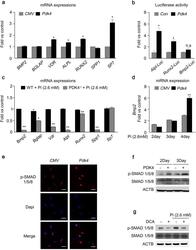
- Figure 4 The levels of PDK4 are positively correlated with osteogenic markers. (a) mRNA levels of osteogenic genes measured in human VSMCs after infection with Ad- Pdk4 (n = 3). * P < 0.005 compared with Ad- CMV . (b) Luciferase activity measured in HEK293 cells after transfection with a Pdk4 vector and luciferase reporter constructs for fragments of Runx2 (-4615/+60), Alpl (1.9 kb), and Bmp2 (-2712/+165) (n = 3). * P < 0.05 compared with Con (pc DNA) vector. n.s, non-significance. (c) RT-PCR analysis of osteogenic genes in VSMCs from WT and PDK4 -/- mice cultured with Pi (n = 3). * P < 0.05, ** P < 0.01 compared with WT. (d) RT-PCR analysis of Bmp2 gene expression in human VSMCs infected with Ad- CMV or Ad- Pdk4 (n = 3). ** P < 0.01 compared with Ad- CMV . (e) Immunostaining for p-SMAD1/5/8 in human VSMCs after Ad- CMV or Ad- Pdk4 infection. p-SMAD1/5/8 (red), DAPI for nuclei (blue). Scale bar = 50 mum. (f,g) Western blots of p-SMAD 1/5/8 and total SMAD 1/5/8 in human VSMCs infected with Ad- CMV or Ad- Pdk4 ( f ) and Effect of DCA on p-SMAD1/5/8 during calcification ( g ). Data presented in graphs represent means +- S.E.M.

- Submitted by
- Invitrogen Antibodies (provider)
- Main image
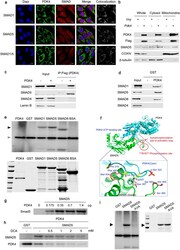
- Experimental details
- Figure 6 PDK4 directly interacts with SMAD1/5/8. ( a ) Immuno-fluorescence images of C2C12 cells infected with control retrovirus or Pdk4 -expressing retrovirus. The sections were co-stained with antibodies for PDK4 (green), SMAD1, SMAD5, SMAD1/5 (red), and DAPI (blue). Colocalization was confirmed by a LSM5 ZEISS exciter (white). Scale bar = 10 mum. (b) Western blot for SMAD5 and PDK4 in mitochondrial and cytosolic extracts from C2C12 cells infected with control retrovirus or Pdk4 expressing retrovirus (n = 3). (c) Co-immunoprecipitation analysis of C2C12 infected with control (Vxy) or C-terminal Flag epitope-tagged Pdk4 -expressing retrovirus. ( d ) GST pull-down assays with GST-PDK4 and 35 S-labelled SMADs. (e) In vitro kinase assay with [gamma- 32 P]-ATP showing phosphorylation of SMAD1, SMAD5, and SMAD8 by PDK4 (black arrow), auto-phosphorylation of PDK4 (positive control, gray arrow). (f) Structure osf the complex showing the S463 and S465 phosphorylation sites of the SMAD5 and PDK4 complex. ( g ) In vitro kinase assay showing the phosphorylation of SMAD5 by indicated doses of PDK4 proteins. ( h ) In vitro kinase assay showing that DCA inhibits the phosphorylation of SMAD5 and auto-phosphorylation induced by PDK4. ( i ) The elimination of SMAD5 phosphorylation by mutation of S463 and S465 of SMAD5 to Ala (SMAD5 AVA). Data presented in graphs represent means +- S.E.M.
- Submitted by
- Invitrogen Antibodies (provider)
- Main image
- Experimental details
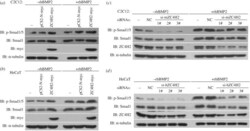
- Figure 9. ZC4H2 stabilizes Smad proteins in vivo . ( a,b ) ZC4H2 overexpression stabilized Smad proteins in C2C12 ( a ) and HeCaT ( b ) cells. C2C12 or HeCaT cells were transiently transfected with the indicated plasmids and treated with rhBMP2 or not for 24 h before harvesting. Cell lysates were analysed by western blotting. ( c,d ) ZC4H2 knockdown reduced Smad proteins in C2C12 ( c ) and HeCaT ( d ) cells. For knockdown of ZC4H2, three independent siRNAs against mouse or human ZC4H2 were transfected into C2C12 or HeCaT cells, respectively. Cells were treated for 24 h with rhBMP2 and harvested at 72 h after transfection. Cell lysates were analysed by western blotting. NC, negative control; IB, immunoblotting.
- Submitted by
- Invitrogen Antibodies (provider)
- Main image
- Experimental details
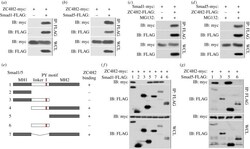
- Figure 6. ZC4H2 interacts with Smad1/5. ( a,b ) ZC4H2 was co-immunoprecipitated with Smad1 ( a ) or Smad5 ( b ). ( c,d ) Smad1 ( c ) or Smad5 ( d ) was coimmunoprecipitated with ZC4H2. HEK293 cells were transiently transfected with different combinations of expression vectors of ZC4H2 and Smad1/5, as indicated. Cell lysates were incubated with anti-FLAG beads, washed, and subsequently analysed by western blotting. ( e ) Schematic of the structures of Smad1/5 truncates. ( f,g ) The interaction between ZC4H2 and Smad1 ( f ) or Smad5 ( g ) different truncations. HEK293 cells were transiently transfected with different combinations of expression vectors of myc-tagged ZC4H2 and FLAG-tagged various Smad1 ( e ) or Smad5 ( f ) truncates, as indicated. Cell lysates were incubated with anti-FLAG beads and subsequently analysed by western blotting. WCL, whole-cell lysate; IB, immunoblot; IP, immunoprecipitation.
- Submitted by
- Invitrogen Antibodies (provider)
- Main image

- Experimental details
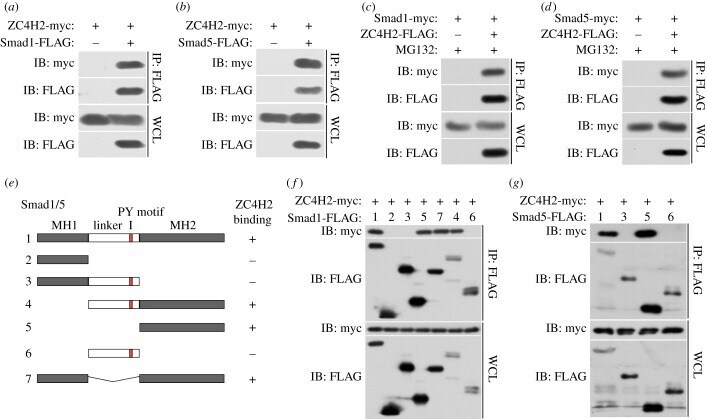
- Figure 8. ZC4H2 antagonizes Smurfs activity towards Smads by abolishing the association between Smurfs and Smads. ( a-d ) Effects of ZC4H2 on the polyubiquitination status of Smads mediated by Smurfs. HEK293 cells were transiently transfected with the indicated plasmids and treated for 8 h with MG132 before harvesting. Smad proteins were coimmunoprecipitated with anti-FLAG antibody and then detected for polyubiquitin chains with the antibody against ubiquitin. ( e-h ) Effects of ZC4H2 on the association between Smurfs and Smad1, Smad1-DeltaLinker ( e,f ) or Smad5 ( g,h ) proteins. HEK293 cells were transiently transfected with different combinations of expression vectors of ZC4H2 and Smad1, Smad5 or Smad-DeltaLinker, as indicated, and treated for 8 h with MG132 before harvesting. Cell lysates were incubated with anti-FLAG beads, washed, and subsequently analysed by western blotting. WCL, whole-cell lysate; IP, immunoprecipitation; IB, immunoblotting; WT, wild-type; DeltaL, Smad1-DeltaLinker truncates; CA, the ligase dead mutant for Smurf1; CG, the ligase dead mutant for Smurf2.
- Submitted by
- Invitrogen Antibodies (provider)
- Main image
- Experimental details
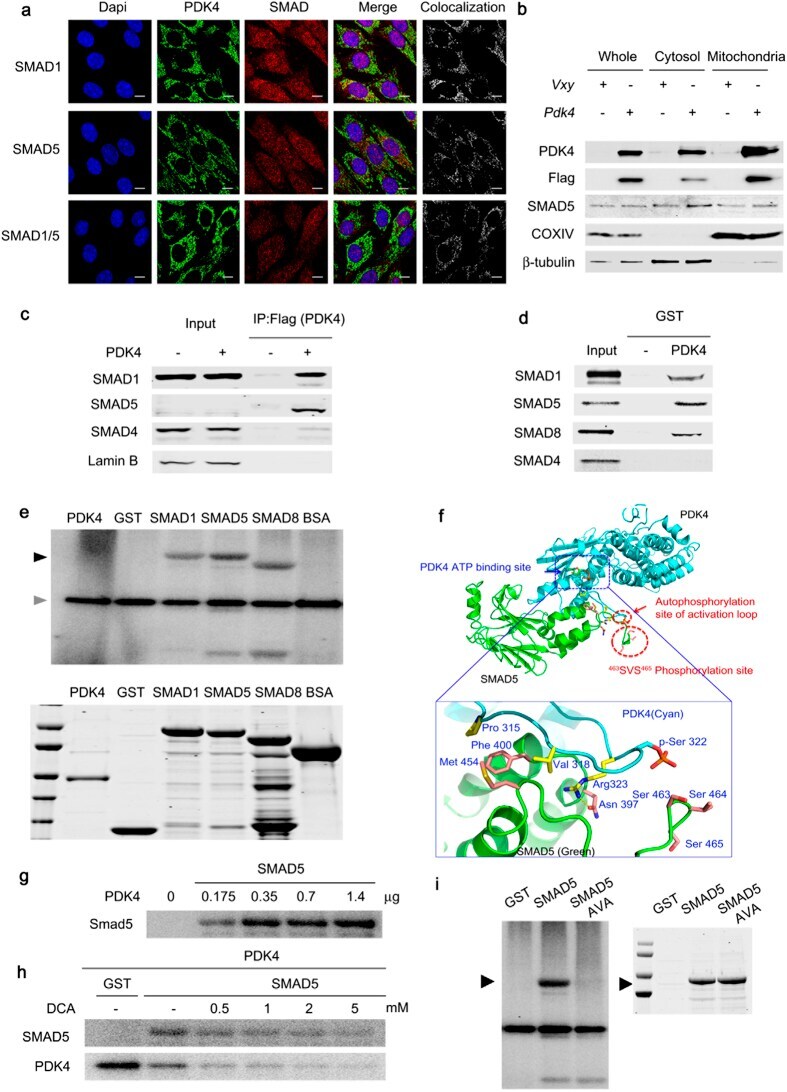
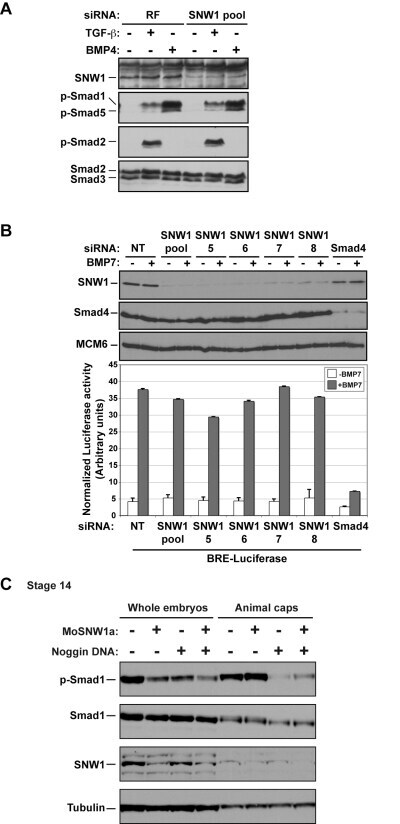
- Figure 5 SNW1 regulates BMP activity in Xenopus and zebrafish embryos and is essential for BMP activity at the border between neural and non-neural tissue. (A) One-cell Xenopus embryos were either uninjected (control) or injected with 20 ng of MoSNW1a or 500 pg of X. tropicalis ( Xt ) SNW1 . Embryos were harvested at the stages indicated, and whole embryo extracts were analyzed by Western blotting using antibodies against p-Smad1 and Tubulin, the latter as a loading control. Quantification of p-Smad1 levels relative to Tubulin is shown below the blots. (B) Xenopus embryos were either uninjected (control) or injected with 20 ng of MoSNW1a or 500 pg of X. tropicalis SNW1 mRNA at the one-cell stage, and bisected at stage 14 into dorsal (D) and ventral (V) halves. Whole cell extracts were analyzed by Western blotting using antibodies against SNW1, p-Smad1, Smad1, and Tubulin, the last as a loading control. WE, whole embryo. (C) Zebrafish embryos were either uninjected (U) or injected with increasing amounts (5, 10, 15, or 20 ng) of the splice-blocking MO MoZFSNW1. Embryos were harvested at 8, 10, or 12 hpf. Whole embryo extracts were analyzed by Western blotting using antibodies against SNW1, p-Smad1, and MCM6, the last as a loading control. (D) Knockdown of SNW1 strongly reduces ventral p-Smad1 levels at stage 13, but has no effect on the p-Smad1 ventral/dorsal gradient at stage 10. Embryos that were either uninjected (control) or injected with 20 ng of MoSNW1a at the one-cell s

- Submitted by
- Invitrogen Antibodies (provider)
- Main image

- Experimental details
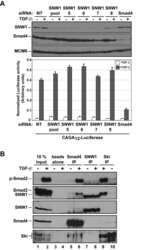
- Figure 7 SNW1 does not function downstream of the receptors in the BMP pathway in tissue culture cells or in Xenopus animal cap explants. (A) Knockdown of SNW1 had no effect on the levels of p-Smad1/5 or p-Smad2 in response to ligand stimulation. SNW1 was depleted in MDA-MB-231 cells using an siRNA pool containing four individual duplexes that specifically target the human SNW1 mRNA. 72 h after siRNA transfection, cells were either left uninduced or induced for 1 h with 20 ng/ml BMP4 (R&D Systems) or 2 ng/ml TGF-beta (PeproTech). Whole cell extracts were analyzed by Western blotting using antibodies against SNW1, p-Smad1/5, p-Smad2, and Smad2/3, the last serving as a loading control. In this gel system p-Smad1 and p-Smad5 are resolved into two bands. RiscFree (RF) siRNA is a non-targeting duplex used as a control. (B) siRNA-mediated knockdown of SNW1 in mammalian cells does not affect a BMP-responsive reporter activity. An MDA-MB-231 cell line stably expressing TK-Renilla and BRE-Luciferase was transfected with a non-targeting siRNA (NT), an siRNA pool against SNW1 , the four individual siRNAs that make up the pool, or an siRNA against Smad4 . 72 h after transfection, cells were induced with 200 ng/ml BMP7 (PeproTech). Samples were taken for Western blotting after 1 h and for Luciferase/Renilla assays after 8 h. The efficiency of knockdown is demonstrated in the Western blot shown. (C) SNW1 depletion affects BMP activity only in whole embryos and not in animal caps. Embryos w
- Submitted by
- Invitrogen Antibodies (provider)
- Main image

- Experimental details
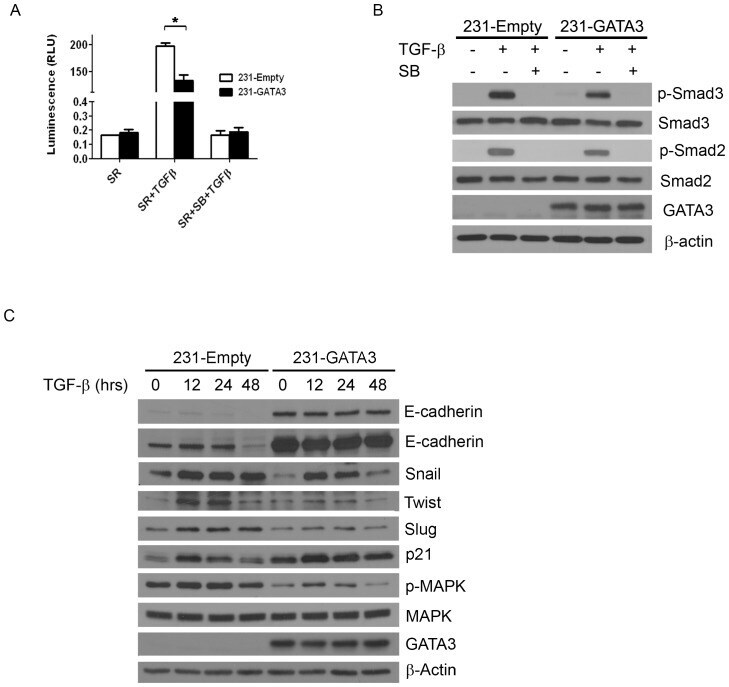
- Figure 3 GATA3 reduces the TGFss1 transcriptional response in MB-231 cells and abrogates TGFss1 mediated EMT. (A) Luciferase activity of 231-Empty and 231-GATA3 cells using the TGFss response reporter construct CAGA12. 231-GATA3 cells exhibited a reduced TGF-ss1-dependent activation of CAGA12 compared to 231-Empty cells. (B) Western blot analysis of 231-Empty and 231-GATA3 cells showing changes in activation of SMAD signaling in response to TGF-ss1. 231-GATA3 cells treated with TGF-ss1 for 1 hr. showed reduced p-SMAD 3 and p-SMAD 2 levels compared to 231-Empty cells. ss-actin was used as loading control. (C) Western blot analysis showing differences in expression of EMT markers at the indicated times. Cells were grown in SR media and treated with TGF-ss1 for 12, 24 or 48 hrs.
- Submitted by
- Invitrogen Antibodies (provider)
- Main image
- Experimental details
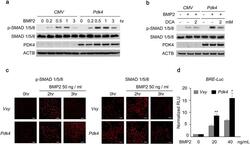
- Figure 5 The level of p-SMAD is augmented by PDK4 activity in BMP induction. ( a, b ) Immunoblot analysis of p-SMAD1/5/8 and SMAD1/5/8 in human VSMCs infected with Ad- CMV or Ad- Pdk4 under BMP2 (20 ng/ml) stimulation for indicated number of hours ( a ) with indicated concentrations of DCA ( b ) (n = 3). (c) Immunostaining for p-SMAD1/5/8 (left) and SMAD1/5/8 (right) in C2C12 cells infected with control retrovirus ( Vxy ) or retrovirus expressing Pdk4 after stimulation with BMP2 (50 ng/ml) (n = 3). Scale bar = 50 mum. (d) C2C12 cells infected with control retrovirus or Pdk4 expressing retrovirus were transfected with a BMP/luciferase reporter (BRE- Luc ) containing Bmp2 response element (12X GCGC ). Cells were stimulated for 48 h with BMP2 (n = 3). * P < 0.05, ** P < 0.01 compared with control ( Vxy ). Data presented in graphs represent means +- S.E.M.

- Submitted by
- Invitrogen Antibodies (provider)
- Main image
- Experimental details
- Fig. 2 BMP7 modulates MAPK14 in anti-PD1-resistant tumors and immune cells. a Reverse phase protein array (RPPA) results on expression levels and activation status of 243 proteins in 344SQP ( n = 3 biologically independent samples) and 344SQR ( n = 3 biologically independent samples) tumors treated with anti-PD1(10 mg/kg). Normalized data were first log2-transformed (log2(x + 1)). Proteins expressed at different levels between groups (downregulated proteins in green and upregulated proteins in red) were identified by a P value of

- Submitted by
- Invitrogen Antibodies (provider)
- Main image
- Experimental details
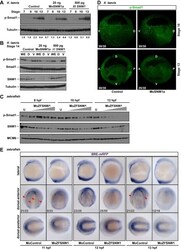
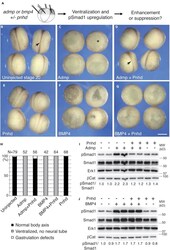
- Figure 2 Pnhd inhibits Admp ventralizing activity (A) Experimental scheme. Marginal zone of four-cell embryos was injected with admp or flag-bmp4 RNA (50 pg) and flag-pnhd RNA (150 pg) as indicated. (B-G) Typical embryo phenotypes at stage 20 are shown. Arrows (B, D) point to neural tubes, asterisk in (C) marks a ventralized embryo. Scale bar: 400 mum in (G). (H) Quantification of the experiments shown in (B-G). Ventralization activity in stage 20 embryos has been scored as indicated at the bottom of the panel. Numbers of scored embryos are shown above each bar. Data are representative of three independent experiments. (I and J) Pnhd inhibits Smad1 phosphorylation in response to Admp but not BMP4. Embryos were injected as shown in (A) and harvested at stage 11 for immunoblotting with anti-phospho-Smad1 (pSmad1) and anti-Smad1 antibodies. Normalized ratios of pSmad1 to Smad1 levels are shown. Independent biological replicas are included for each group. Erk1, and beta-catenin (betaCat) levels control loading.
- Submitted by
- Invitrogen Antibodies (provider)
- Main image
- Experimental details
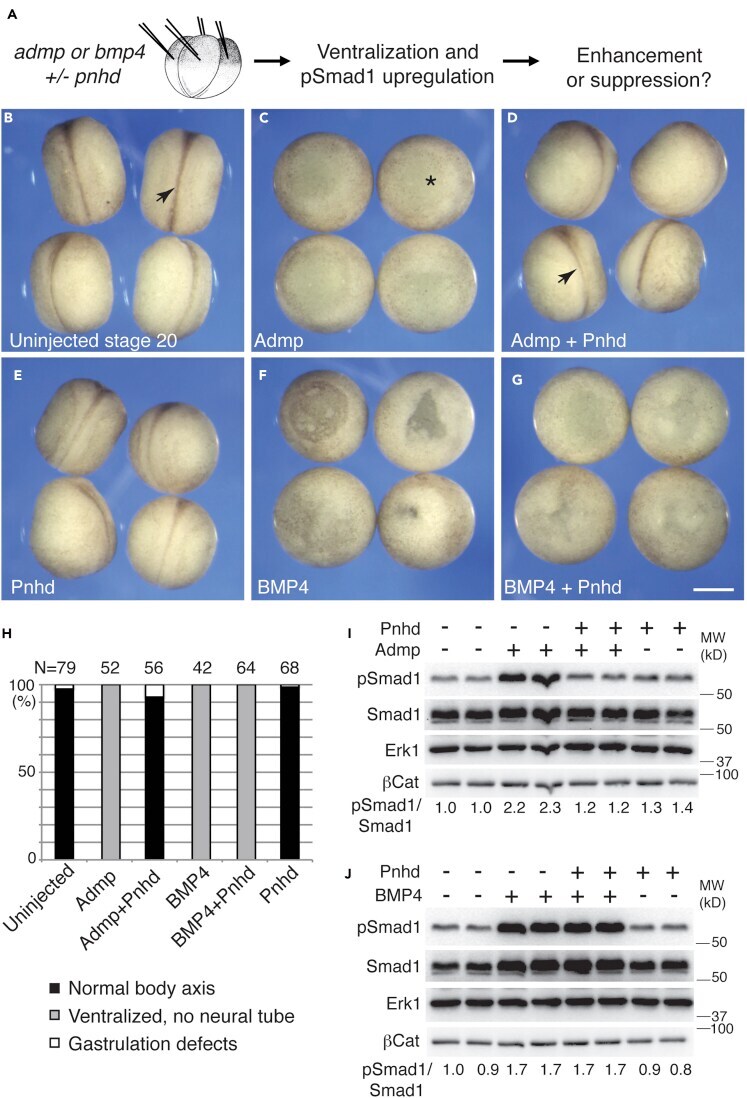
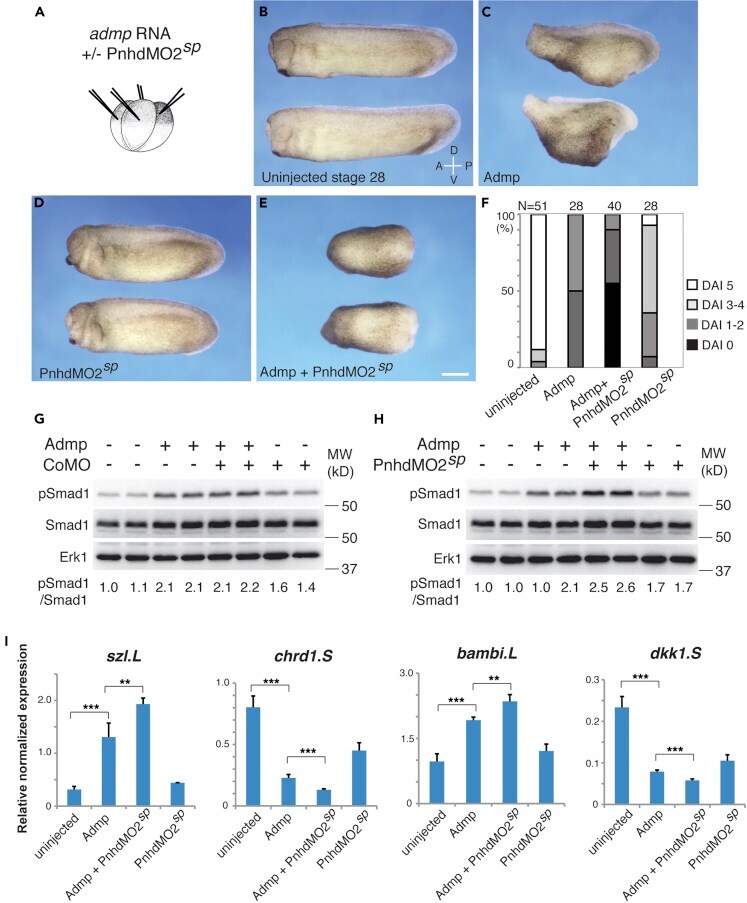
- Figure 4 Admp activity is enhanced by Pnhd depletion (A) Experimental scheme. Marginal zone of four-cell embryos was injected with admp RNA (50 pg) or PnhdMO2 sp (40 ng) as indicated. (B-F) Pnhd MO2 sp enhanced ventralization caused by Admp. Representative embryos are shown. (F) Quantification of the data shown in (B-E). Phenotypic scoring was done when uninjected embryos reached stage 28 using dorsoanterior index (DAI). Bar in E, 200 um. (G and H) Immunoblotting of lysates of stage 11 embryos with anti-pSmad1, anti-Smad1, and anti-Erk1 antibodies. (G), control MO; (H), PnhdMO2 sp . Normalized ratio of band intensities of pSmad1 relative to total Smad1 is indicated. Erk1 serves as a loading control. Independent biological replicas are included for each group (G, H). Data represent two to three independent experiments. (I) The effect of Admp on marginal zone markers is enhanced in Pnhd morphants. RNA was extracted from injected embryos at stage 11.5. RT-qPCR analysis of ventral ( szl and bambi ) or dorsal ( chrd1 and dkk1) markers is shown. These data are representative of three experiments. Means +- SD are shown. Significance was determined by the Student's t test, **p < 0.01, ***p < 0.001.
- Submitted by
- Invitrogen Antibodies (provider)
- Main image

- Experimental details
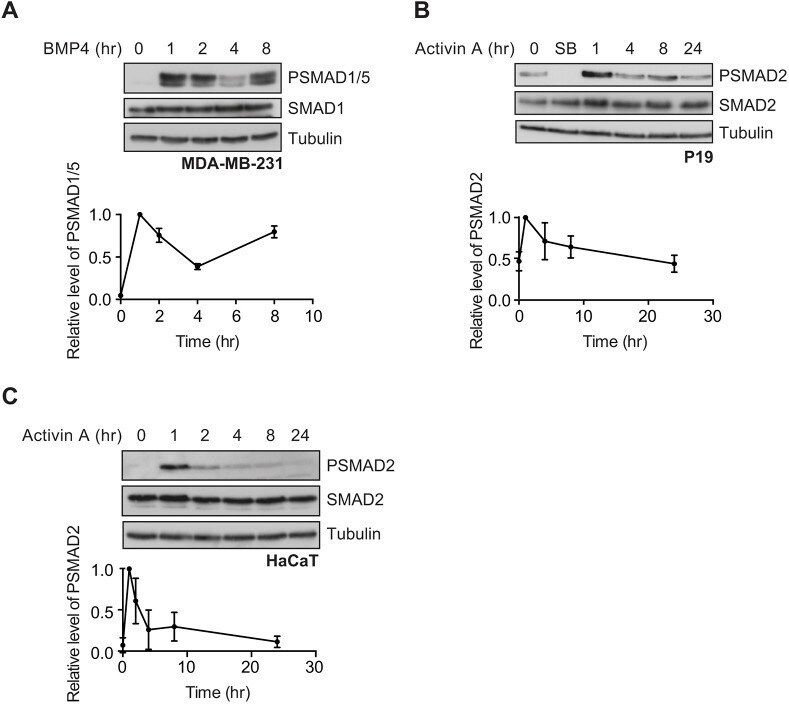
- Fig. 1. BMP4 and activin signal with distinct dynamics. (A) MDA-MB-231 cells were treated with BMP4 for the times indicated. (B,C) P19 cells (B) or HaCaT cells (C) were treated with activin A for the times indicated or SB-431542 (SB) overnight. Western blotting for PSMAD1/5, SMAD1, PSMAD2, SMAD2/3 and tubulin, as a loading control, was performed. Quantifications are normalised mean+-s.d. of densitometry measurements from three independent experiments, which are normalised to measurements in cells treated with growth factors for 1 h.
- Submitted by
- Invitrogen Antibodies (provider)
- Main image
- Experimental details
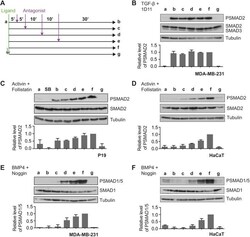
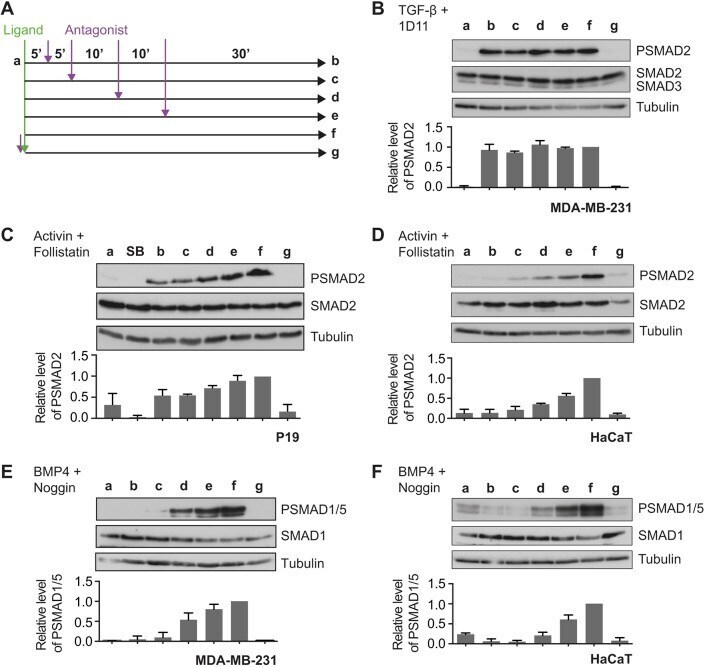
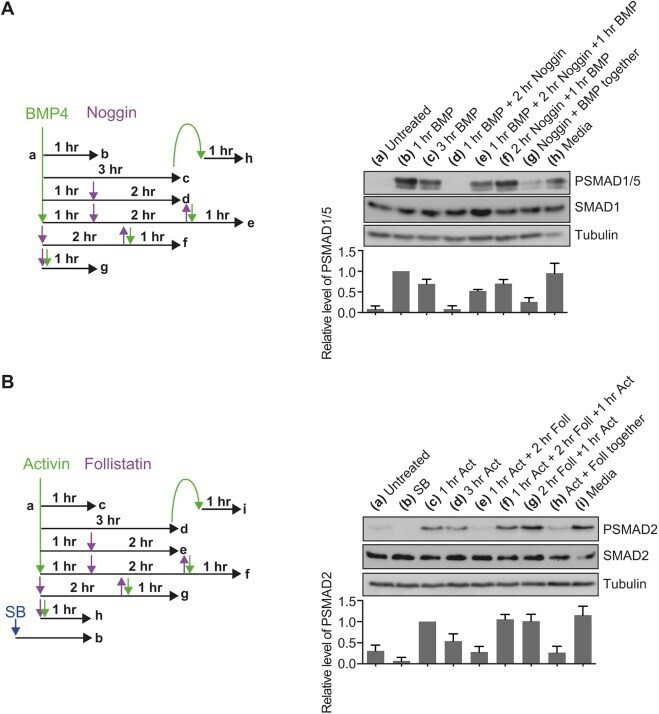
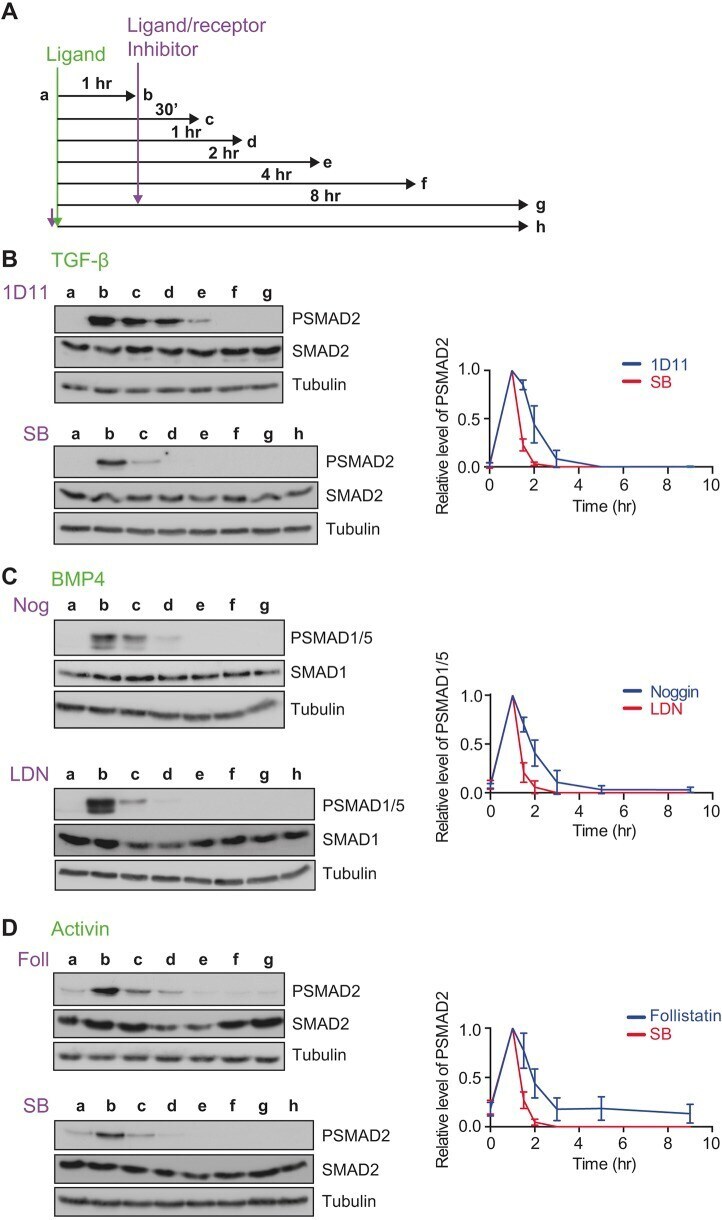
- Fig. 2. Activin and BMP4 signals are integrated over time, whereas TGF-beta signals are not. (A) Experimental scheme. Cells were untreated (a), or treated with ligand for 5 (b), 10 (c), 20 (d), 30 (e), or 60 (f) min, followed by the cognate ligand antagonist for the remainder of 60 min. To ensure that inhibitors were working as expected, cells were pre-treated with inhibitor for 5 min, followed by ligand for 60 min (g). (B) MDA-MB-231 cells were treated as in A with TGF-beta and the blocking antibody, 1D11. (C) P19 cells were treated as in A with activin and follistatin, and additionally overnight with SB-431542 (SB). (D) HaCaT cells were treated as in A with activin and follistatin. (E) MDA-MB-231 cells were treated as in A with BMP4 and noggin. (F) HaCaT cells were treated as in A with BMP4 and noggin. Western blotting for PSMAD1/5, SMAD1, PSMAD2, SMAD2/3 and tubulin, as a loading control, was performed. Quantifications are means+-s.d. of densitometry measurements from three independent experiments, which are normalised to measurements in cells treated with growth factors for 1 h.
- Submitted by
- Invitrogen Antibodies (provider)
- Main image
- Experimental details
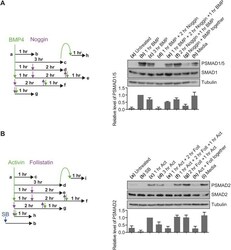
- Fig. 3. BMP4 and activin do not induce refractory behaviour. (A) Left, a schematic of the experimental set-up. NIH-3T3 cells were untreated (a) or treated with BMP4 for 1 h (b) or 3 h (c). After 1 h of BMP4 stimulation, the signal was brought down to baseline through treatment with noggin for 2 h (d), which was then washed out and cells were re-stimulated with BMP4 for 1 h (e). The efficacy of noggin washout was confirmed (f), as was its inhibitory ability by adding the ligand and antagonist simultaneously (g). To confirm that BMP4 was not depleted from the medium in the time period of these experiments, cells were stimulated with BMP4 for 3 h, then the medium transferred to naive cells for 1 h (h). Right, western blotting for PSMAD1/5, SMAD1 and tubulin, as a loading control, was performed. Quantifications are means+-s.d. of densitometry measurements from three independent experiments, which are normalised to measurements in cells treated with BMP4 for 1 h. (B) Left, a schematic of the experimental set-up. P19 cells were untreated (a), treated overnight with SB-431542 (b) or treated with activin for 1 h (c) or 3 h (d). After 1 h of activin stimulation, the signal was brought down to baseline through treatment with follistatin for 2 h (e), which was then washed out and cells were re-stimulated with activin for 1 h (f). The efficacy of follistatin washout was confirmed (g), as was its inhibitory ability (g). To confirm that activin was not depleted from the medium in the time
- Submitted by
- Invitrogen Antibodies (provider)
- Main image
- Experimental details
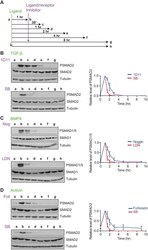
- Fig. 4. The distinct TGF-beta, activin and BMP4 signalling dynamics are not explained by the intracellular lifetimes of their receptors. (A) Experimental scheme. Cells were untreated (a), or treated for 1 h with ligand (b), then with ligand antagonist or receptor kinase inhibitors for 30 mins (c), 1 h (d), 2 h (e), 4 h (f) or 8 h (g), or with ligand and receptor kinase inhibitor together for 8 h (h). (B) MDA-MB-231 cells were treated as in A with TGF-beta, 1D11 or SB-431542 (SB). (C) MDA-MB-231 cells were treated as in A with BMP4, noggin (Nog) or LDN-193189 (LDN). (D) P19 cells were treated as in A with activin A, follistatin (Foll) or SB-431542 (SB). Western blotting for PSMAD1/5, SMAD1, PSMAD2, SMAD2/3 and tubulin, as a loading control, was performed. Quantifications are means+-s.d. of densitometry measurements from three independent experiments, which are normalised to measurements in cells treated with growth factors for 1 h.
- Submitted by
- Invitrogen Antibodies (provider)
- Main image
- Experimental details
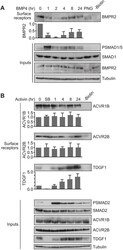
- Fig. 5. BMP4 and activin drive distinct receptor trafficking behaviours. (A) MDA-MB-231 cells were treated with BMP4 for the times indicated. (B) P19 cells were treated with activin for the times indicated or with SB-431542 overnight (SB). Whole-cell extracts were western blotted for BMPR2, PSMAD1/5, SMAD1, ACVR1B, ACVR2B, TDGF1, PSMAD2 and SMAD2/3, with tubulin as a loading control (Inputs). Surface biotinylation assays were performed to isolate surface receptor populations, which were western blotted for BMPR2, ACVR1B, ACVR2B and TDGF1. For the lane marked -Biotin, unstimulated cell extracts were treated identically to the other samples, but without the addition of biotin. In A, the lane marked PNG corresponds to a 0 time point where the sample was treated with PNGase to remove N-linked sugars from the receptors prior to gel electrophoresis. Quantifications are the normalised mean+-s.d. of densitometry measurements from three independent experiments, relative to the levels in untreated cells.

- Submitted by
- Invitrogen Antibodies (provider)
- Main image
- Experimental details
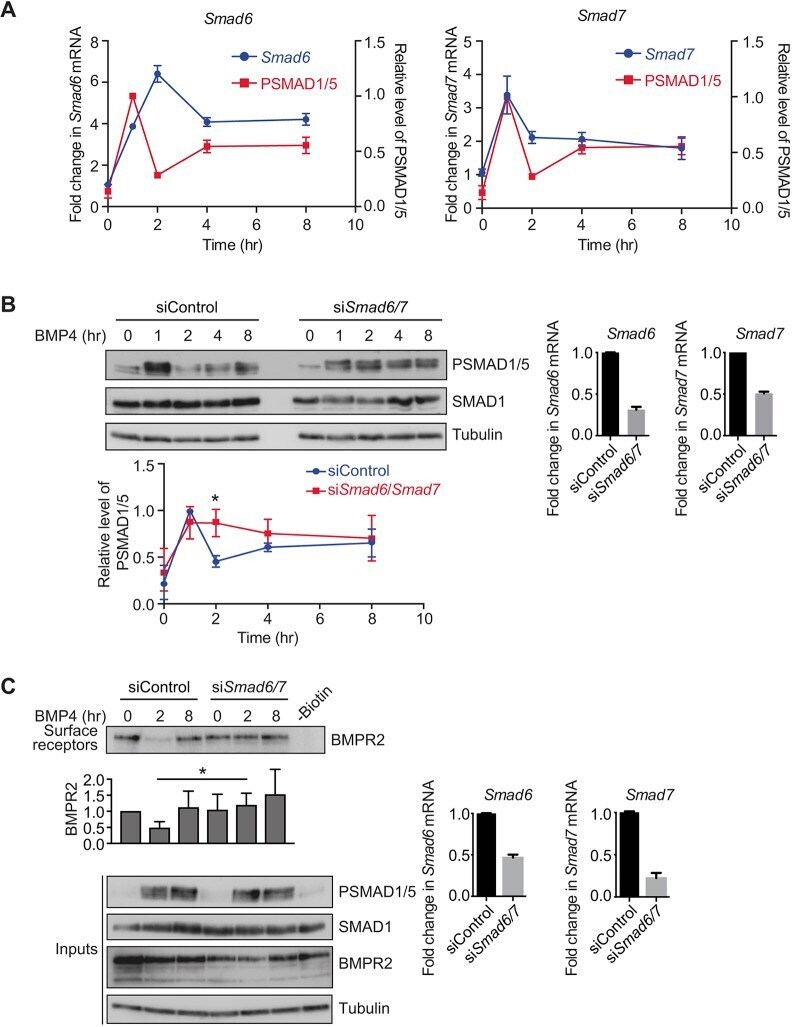
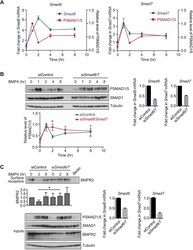
- Fig. 6. SMAD6 and SMAD7 are required for the oscillatory signalling response to BMP4. (A) NIH-3T3 cells were treated with BMP4 for the times indicated. Levels of Smad6 and Smad7 mRNA were assayed by qPCR. Shown are the normalised means and s.d.s from three independent experiments, expressed as fold change in mRNA level relative to the levels in untreated cells, overlaid with SMAD1/5 phosphorylation data from Fig. S2 . (B) NIH-3T3 cells were transfected with non-targeting control siRNAs (siControl) or siRNA SMARTpools targeting Smad6 and Smad7 (si Smad6/7 ), and were then treated with BMP4 for the times indicated. Western blotting for PSMAD1/5, SMAD1 and tubulin was performed. Quantifications are means+-s.d. of densitometry measurements from three independent experiments, which are normalised to measurements in siControl cells treated with BMP4 for 1 h. * P