Explore
 Validate
 Learn
Learn Western blot
 ELISA
ELISA Immunocytochemistry
Antibody data
- Antibody Data
- Antigen structure
- References [15]
- Comments [0]
- Validations
- Immunocytochemistry [5]
- Immunohistochemistry [1]
- Other assay [19]
Submit
Validation data
Reference
Comment
Report error
- Product number
- PA5-28612 - Provider product page

- Provider
- Invitrogen Antibodies
- Product name
- PGK1 Polyclonal Antibody
- Antibody type
- Polyclonal
- Antigen
- Recombinant full-length protein
- Description
- Recommended positive controls: 293T, PGK1 shRNA-transfected 293T, A431, HeLa, HepG2, mouse brain, Rat liver, Yeast wild type 303. Predicted reactivity: Mouse (97%), Rat (97%), Zebrafish (87%), Xenopus laevis (84%), Pig (96%), Chicken (88%), Sheep (96%), Rhesus Monkey (100%), Chimpanzee (100%), Bovine (96%). Store product as a concentrated solution. Centrifuge briefly prior to opening the vial.
- Reactivity
- Human, Mouse, Rat, Yeast
- Host
- Rabbit
- Isotype
- IgG
- Vial size
- 100 μL
- Concentration
- 0.048 mg/mL
- Storage
- Store at 4°C short term. For long term storage, store at -20°C, avoiding freeze/thaw cycles.
Submitted references Xrn1 is a deNADding enzyme modulating mitochondrial NAD-capped RNA.
The C-terminal domain of Hsp70 is responsible for paralog-specific regulation of ribonucleotide reductase.
Cex1 is a component of the COPI intracellular trafficking machinery.
The Smk1 MAPK and Its Activator, Ssp2, Are Required for Late Prospore Membrane Development in Sporulating Saccharomyces cerevisiae.
Epigenetic CRISPR Screens Identify Npm1 as a Therapeutic Vulnerability in Non-Small Cell Lung Cancer.
Andrographolide and Its 14-Aryloxy Analogues Inhibit Zika and Dengue Virus Infection.
Mitochondrial-nuclear heme trafficking in budding yeast is regulated by GTPases that control mitochondrial dynamics and ER contact sites.
Mps2 links Csm4 and Mps3 to form a telomere-associated LINC complex in budding yeast.
The anaphase-promoting complex regulates the degradation of the inner nuclear membrane protein Mps3.
Extra-mitochondrial Cu/Zn superoxide dismutase (Sod1) is dispensable for protection against oxidative stress but mediates peroxide signaling in Saccharomyces cerevisiae.
Molecular interactions between Hel2 and RNA supporting ribosome-associated quality control.
Cost-effective and rapid lysis of Saccharomyces cerevisiae cells for quantitative western blot analysis of proteins, including phosphorylated eIF2α.
Nuclear RNA Decay Pathways Aid Rapid Remodeling of Gene Expression in Yeast.
Cleavage of the SUN-domain protein Mps3 at its N-terminus regulates centrosome disjunction in budding yeast meiosis.
The Assembly Factor Pet117 Couples Heme a Synthase Activity to Cytochrome Oxidase Assembly.
Sharma S, Yang J, Grudzien-Nogalska E, Shivas J, Kwan KY, Kiledjian M
Nature communications 2022 Feb 16;13(1):889
Nature communications 2022 Feb 16;13(1):889
The C-terminal domain of Hsp70 is responsible for paralog-specific regulation of ribonucleotide reductase.
Knighton LE, Nitika, Omkar S, Truman AW
PLoS genetics 2022 Apr;18(4):e1010079
PLoS genetics 2022 Apr;18(4):e1010079
Cex1 is a component of the COPI intracellular trafficking machinery.
Enkler L, Rinaldi B, de Craene JO, Hammann P, Nureki O, Senger B, Friant S, Becker HD
Biology open 2021 Mar 22;10(3)
Biology open 2021 Mar 22;10(3)
The Smk1 MAPK and Its Activator, Ssp2, Are Required for Late Prospore Membrane Development in Sporulating Saccharomyces cerevisiae.
Durant M, Roesner JM, Mucelli X, Slubowski CJ, Klee E, Seitz BC, Wallis Z, Huang LS
Journal of fungi (Basel, Switzerland) 2021 Jan 14;7(1)
Journal of fungi (Basel, Switzerland) 2021 Jan 14;7(1)
Epigenetic CRISPR Screens Identify Npm1 as a Therapeutic Vulnerability in Non-Small Cell Lung Cancer.
Li F, Ng WL, Luster TA, Hu H, Sviderskiy VO, Dowling CM, Hollinshead KER, Zouitine P, Zhang H, Huang Q, Ranieri M, Wang W, Fang Z, Chen T, Deng J, Zhao K, So HC, Khodadadi-Jamayran A, Xu M, Karatza A, Pyon V, Li S, Pan Y, Labbe K, Almonte C, Poirier JT, Miller G, Possemato R, Qi J, Wong KK
Cancer research 2020 Sep 1;80(17):3556-3567
Cancer research 2020 Sep 1;80(17):3556-3567
Andrographolide and Its 14-Aryloxy Analogues Inhibit Zika and Dengue Virus Infection.
Li F, Khanom W, Sun X, Paemanee A, Roytrakul S, Wang D, Smith DR, Zhou GC
Molecules (Basel, Switzerland) 2020 Oct 30;25(21)
Molecules (Basel, Switzerland) 2020 Oct 30;25(21)
Mitochondrial-nuclear heme trafficking in budding yeast is regulated by GTPases that control mitochondrial dynamics and ER contact sites.
Martinez-Guzman O, Willoughby MM, Saini A, Dietz JV, Bohovych I, Medlock AE, Khalimonchuk O, Reddi AR
Journal of cell science 2020 May 20;133(10)
Journal of cell science 2020 May 20;133(10)
Mps2 links Csm4 and Mps3 to form a telomere-associated LINC complex in budding yeast.
Fan J, Jin H, Koch BA, Yu HG
Life science alliance 2020 Dec;3(12)
Life science alliance 2020 Dec;3(12)
The anaphase-promoting complex regulates the degradation of the inner nuclear membrane protein Mps3.
Koch BA, Jin H, Tomko RJ Jr, Yu HG
The Journal of cell biology 2019 Mar 4;218(3):839-854
The Journal of cell biology 2019 Mar 4;218(3):839-854
Extra-mitochondrial Cu/Zn superoxide dismutase (Sod1) is dispensable for protection against oxidative stress but mediates peroxide signaling in Saccharomyces cerevisiae.
Montllor-Albalate C, Colin AE, Chandrasekharan B, Bolaji N, Andersen JL, Wayne Outten F, Reddi AR
Redox biology 2019 Feb;21:101064
Redox biology 2019 Feb;21:101064
Molecular interactions between Hel2 and RNA supporting ribosome-associated quality control.
Winz ML, Peil L, Turowski TW, Rappsilber J, Tollervey D
Nature communications 2019 Feb 4;10(1):563
Nature communications 2019 Feb 4;10(1):563
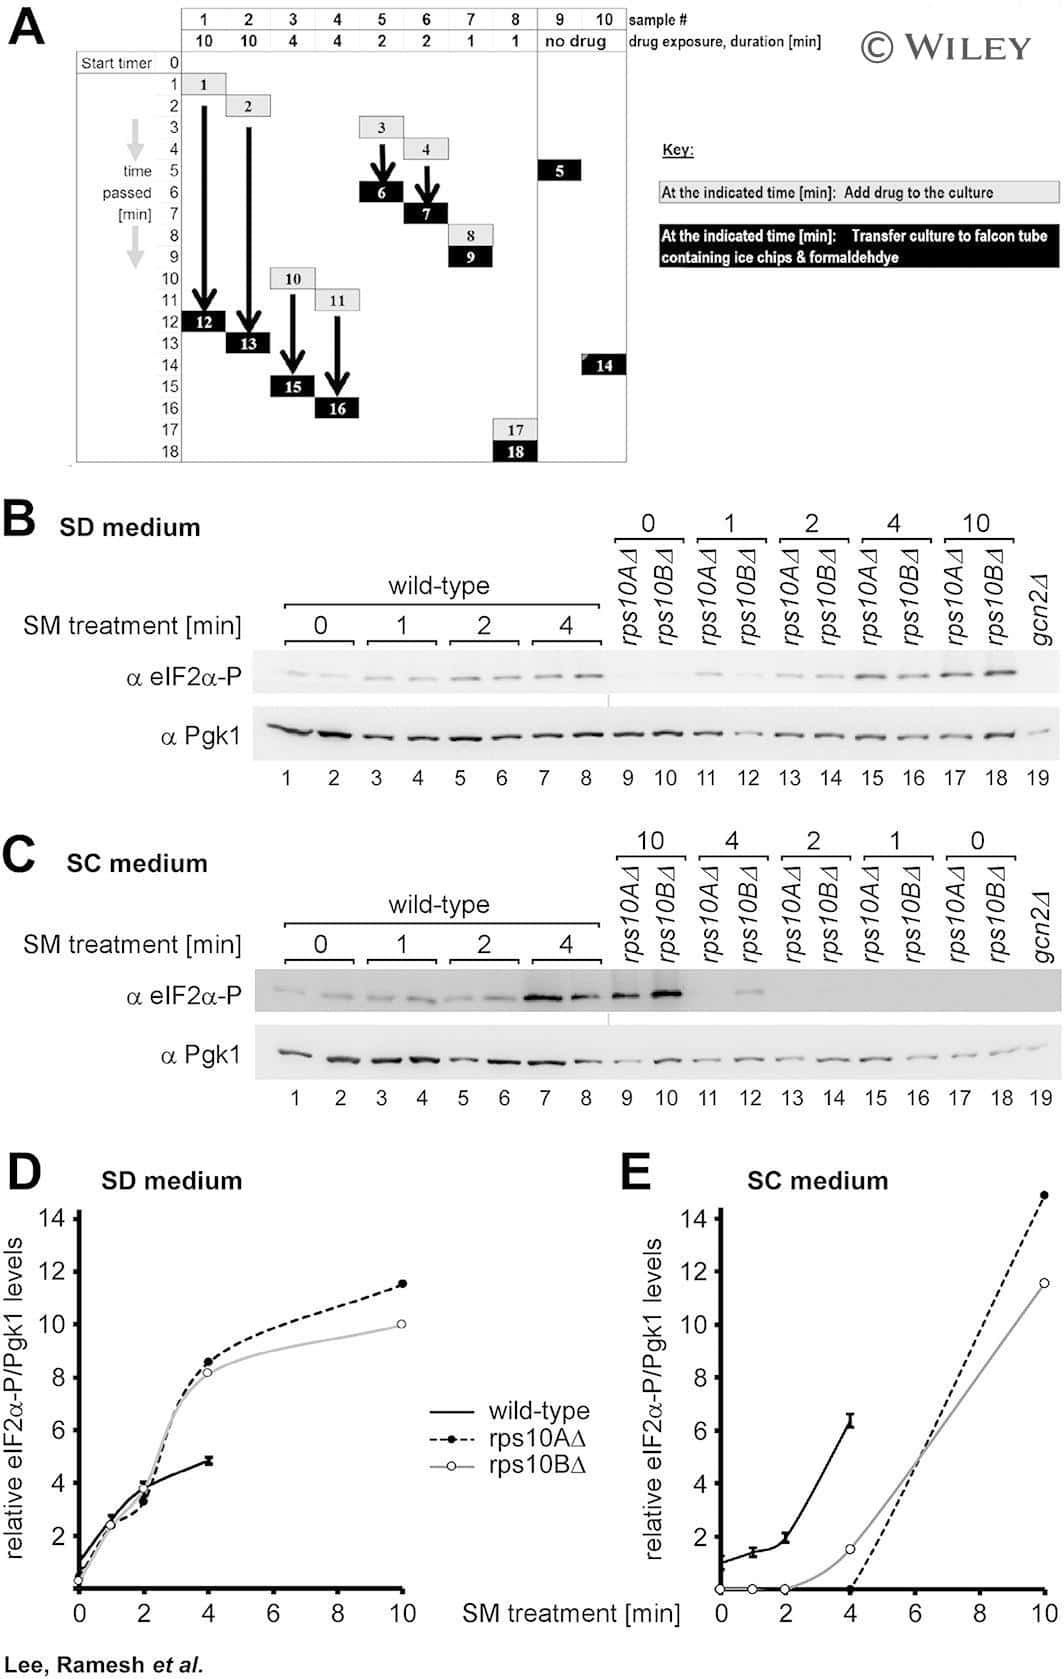
Cost-effective and rapid lysis of Saccharomyces cerevisiae cells for quantitative western blot analysis of proteins, including phosphorylated eIF2α.
Lee SJ, Ramesh R, de Boor V, Gebler JM, Silva RC, Sattlegger E
Yeast (Chichester, England) 2017 Sep;34(9):371-382
Yeast (Chichester, England) 2017 Sep;34(9):371-382
Nuclear RNA Decay Pathways Aid Rapid Remodeling of Gene Expression in Yeast.
Bresson S, Tuck A, Staneva D, Tollervey D
Molecular cell 2017 Mar 2;65(5):787-800.e5
Molecular cell 2017 Mar 2;65(5):787-800.e5
Cleavage of the SUN-domain protein Mps3 at its N-terminus regulates centrosome disjunction in budding yeast meiosis.
Li P, Jin H, Koch BA, Abblett RL, Han X, Yates JR 3rd, Yu HG
PLoS genetics 2017 Jun;13(6):e1006830
PLoS genetics 2017 Jun;13(6):e1006830
The Assembly Factor Pet117 Couples Heme a Synthase Activity to Cytochrome Oxidase Assembly.
Taylor NG, Swenson S, Harris NJ, Germany EM, Fox JL, Khalimonchuk O
The Journal of biological chemistry 2017 Feb 3;292(5):1815-1825
The Journal of biological chemistry 2017 Feb 3;292(5):1815-1825
No comments: Submit comment
Supportive validation
- Submitted by
- Invitrogen Antibodies (provider)
- Main image

- Experimental details
- Immunofluorescent analysis of PGK1 in methanol-fixed HeLa cells using a PGK1 polyclonal antibody (Product # PA5-28612) at a 1:50 dilution.
- Submitted by
- Invitrogen Antibodies (provider)
- Main image
- Experimental details
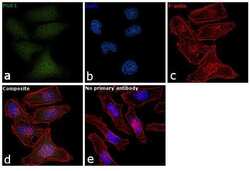
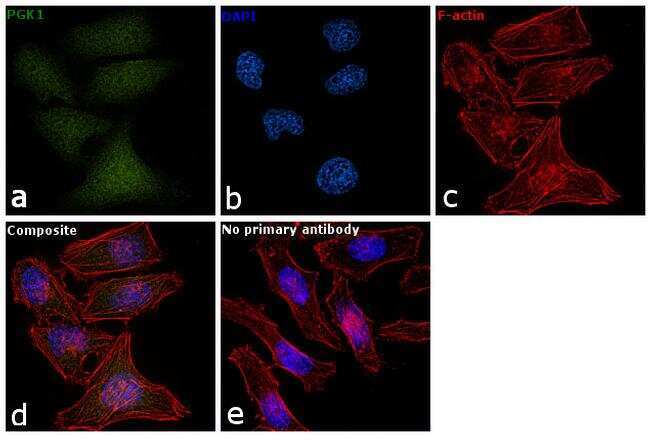
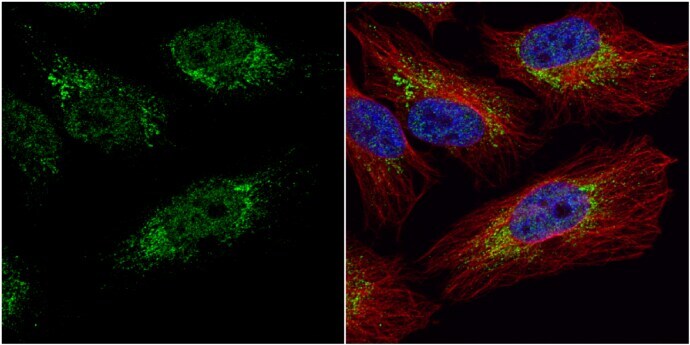
- Immunofluorescence analysis of PGK1 was performed using 70% confluent log phase HeLa cells. The cells were fixed with 4% paraformaldehyde for 10 minutes, permeabilized with 0.1% Triton™ X-100 for 15 minutes, and blocked with 1% BSA for 1 hour at room temperature. The cells were labeled with PGK1 Polyclonal Antibody (Product # PA5-28612) at 5 µg/mL in 0.1% BSA, incubated at 4 degree Celsius overnight and then labeled with Goat anti-Rabbit IgG (H+L) Superclonal™ Secondary Antibody, Alexa Fluor® 488 conjugate (Product # A27034) at a dilution of 1:2000 for 45 minutes at room temperature (Panel a: green). Nuclei (Panel b: blue) were stained with SlowFade® Gold Antifade Mountant with DAPI (Product # S36938). F-actin (Panel c: red) was stained with Rhodamine Phalloidin (Product # R415, 1:300). Panel d represents the merged image showing nucleus and cytoplasmic localization. Panel e represents control cells with no primary antibody to assess background. The images were captured at 60X magnification.
- Submitted by
- Invitrogen Antibodies (provider)
- Main image

- Experimental details
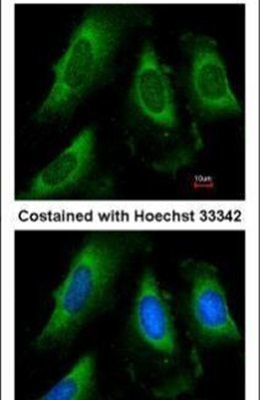
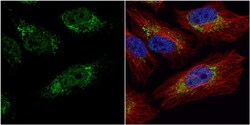
- Immunocytochemistry-Immunofluorescence analysis of PGK1 was performed in HeLa cells fixed in 4% paraformaldehyde at RT for 15 min. Green: PGK1 Polyclonal Antibody (Product # PA5-28612) diluted at 1:20. Red: alpha Tubulin, a cytoskeleton marker. Blue: Hoechst 33342 staining.

- Submitted by
- Invitrogen Antibodies (provider)
- Main image

- Experimental details
- Immunofluorescence analysis of PGK1 was performed using 70% confluent log phase HeLa cells. The cells were fixed with 4% paraformaldehyde for 10 minutes, permeabilized with 0.1% Triton™ X-100 for 15 minutes, and blocked with 1% BSA for 1 hour at room temperature. The cells were labeled with PGK1 Polyclonal Antibody (Product # PA5-28612) at 5 µg/mL in 0.1% BSA, incubated at 4 degree Celsius overnight and then labeled with Goat anti-Rabbit IgG (Heavy Chain) Superclonal™ Secondary Antibody, Alexa Fluor® 488 conjugate (Product # A27034) at a dilution of 1:2000 for 45 minutes at room temperature (Panel a: green). Nuclei (Panel b: blue) were stained with SlowFade® Gold Antifade Mountant with DAPI (Product # S36938). F-actin (Panel c: red) was stained with Rhodamine Phalloidin (Product # R415, 1:300). Panel d represents the merged image showing nucleus and cytoplasmic localization. Panel e represents control cells with no primary antibody to assess background. The images were captured at 60X magnification.

- Submitted by
- Invitrogen Antibodies (provider)
- Main image
- Experimental details
- Immunocytochemistry-Immunofluorescence analysis of PGK1 was performed in HeLa cells fixed in 4% paraformaldehyde at RT for 15 min. Green: PGK1 Polyclonal Antibody (Product # PA5-28612) diluted at 1:20. Red: alpha Tubulin, a cytoskeleton marker. Blue: Hoechst 33342 staining.
Supportive validation
- Submitted by
- Invitrogen Antibodies (provider)
- Main image
- Experimental details
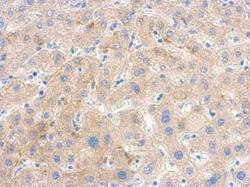
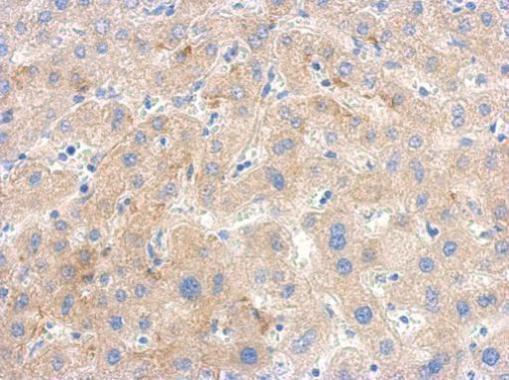
- Immunohistochemical analysis of paraffin-embedded human hepatoma, using PGK1 Polyclonal Antibody (Product # PA5-28612) antibody at 1:500 dilution. Antigen Retrieval: EDTA based buffer, pH 8.0, 15 min.
Supportive validation
- Submitted by
- Invitrogen Antibodies (provider)
- Main image
- Experimental details
- NULL

- Submitted by
- Invitrogen Antibodies (provider)
- Main image
- Experimental details
- NULL

- Submitted by
- Invitrogen Antibodies (provider)
- Main image
- Experimental details
- NULL

- Submitted by
- Invitrogen Antibodies (provider)
- Main image
- Experimental details
- NULL

- Submitted by
- Invitrogen Antibodies (provider)
- Main image

- Experimental details
- NULL
- Submitted by
- Invitrogen Antibodies (provider)
- Main image
- Experimental details
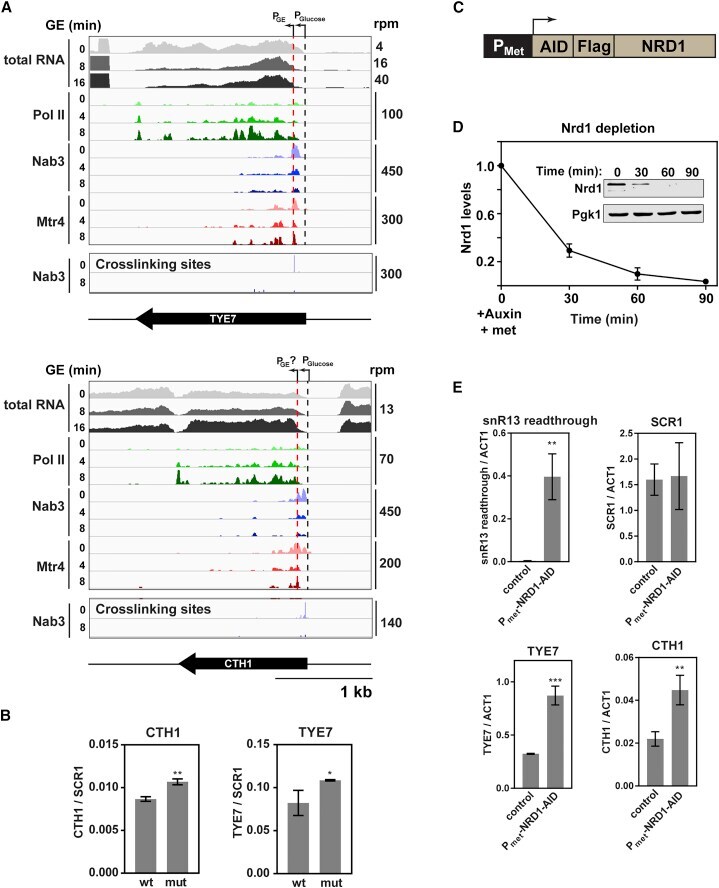
- Figure 6 Upregulated Transcripts Show Evidence of Reduced Nuclear Decay (A) Sequence reads across TYE7 and CTH1 .The top three tracks show changes in total RNA. Note the different scales. The next nine tracks show the binding profiles of Pol II, Nab3, and Mtr4 across the RNA as determined by CRAC. The bottom two tracks map the deletions (the putative site of crosslinking) from reads derived from Nab3 CRAC. The annotated TSS for both genes is marked by a black dotted line, and the red dotted line marks the putative TSS following nutrient downshift. (B) Bar graph comparing the relative abundance of wild-type (WT) TYE7 or CTH1 to mutant (mut) transcripts in which the Nab3 binding site has been removed. Transcript levels were measured by qRT-PCR and normalized to scR1. The values are averages, and error bars are SD (n = 3). (C) Schematic showing the Nrd1 depletion construct. The endogenous NRD1 gene was placed under control of the inducible P met promoter and tagged with the AID and FLAG. (D) Quantification of Nrd1 protein levels following the addition of auxin and methionine to the medium. Nrd1 protein levels were measured using the anti-FLAG antibody and normalized to Pgk1 levels. Values are averages, and error bars show SD (n = 2). Inset: western blot showing Nrd1 and Pgk1 protein levels for one of the replicates. (E) Quantification of the relative abundance of various transcripts following 90-min Nrd1 depletion relative to a wild-type control. RNA levels were assessed by qRT-
- Submitted by
- Invitrogen Antibodies (provider)
- Main image
- Experimental details
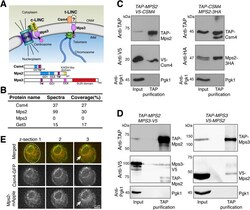
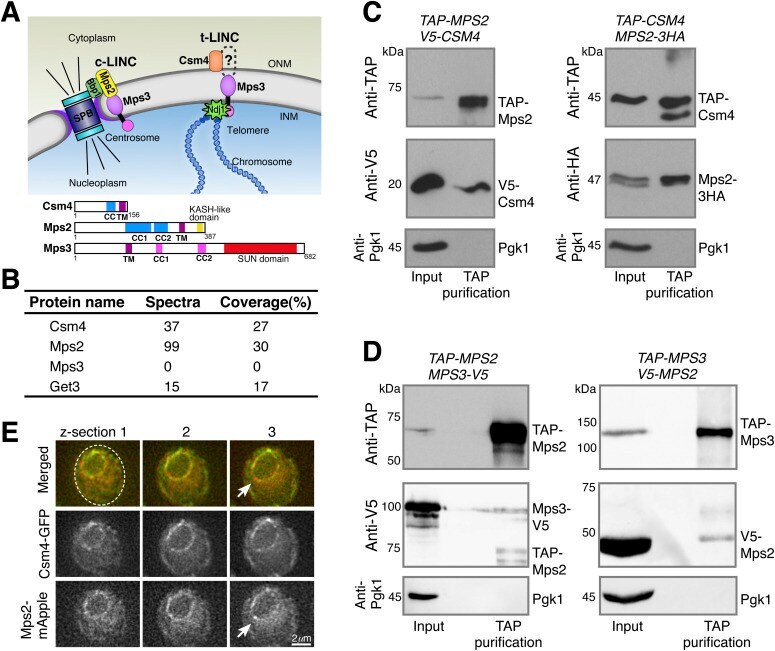
- Figure 1. Meiotic Mps2 binds to Csm4 and Mps3. (A) Schematic diagram showing the composition and location of c-LINC and t-LINC complexes in budding yeast. Domain organization of Csm4, Mps2, and Mps3 is shown at the bottom. (B) List of representative proteins copurified with TAP-Csm4. (C) Reciprocal immunoprecipitation showing Mps2-Csm4 interaction. The level of Pgk1 serves as a negative control for affinity purification. (D) Reciprocal immunoprecipitation showing Mps2-Mps3 interaction. Note that the anti-V5 antibody also recognizes TAP-Mps2. At least two biological replicates were performed. (E) Localization of Mps2 and Csm4 at prophase I. Three continuous optical sections are shown. Arrows point to the putative localization of Mps2 to the spindle pole body. Note that both Csm4 and Mps2 localize to the nuclear periphery. Dashed oval shows the overall cell shape. Red, Mps2-mApple; green, Csm4-GFP. CC, coiled coil; INM, inner nuclear membrane; ONM, outer nuclear membrane; TM, transmembrane domain.
- Submitted by
- Invitrogen Antibodies (provider)
- Main image
- Experimental details
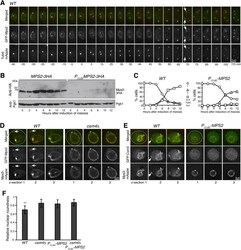
- Figure 2. Mps2 is required for meiotic cell progression and regulates Csm4 localization. (A) Time-lapse fluorescence microscopy showing GFP-Mps2 localization during meiosis. Tub4-mApple serves as a marker for the spindle pole body (SPB). Projected images of 12 z-sections are shown. Arrows point to the newly duplicated SPBs in meiosis II. Time in minutes is shown at the bottom. Time zero refers to the onset of SPB separation in meiosis I. Note the uneven localization of Mps2 to the nuclear periphery in meiosis I. Red, Tub4-mApple; green, GFP-Mps2. (B) Protein level of Mps2 in budding yeast meiosis. Yeast cells were induced to undergo synchronous meiosis; cell aliquots were withdrawn at indicated times. The level of Mps2-3HA was probed by an anti-HA antibody. The level of Pgk1 serves as a loading control. Note that Mps2 was largely depleted in P CLB2 -MPS2 cells. (C) SPB separation in wild-type ( WT ) and P CLB2 -MPS2 cells during meiosis. Tub4-mApple serves as a marker for the SPB. At least 100 cells were counted at each time point. Three biological replicates were performed, shown is a representative. Note that P CLB2 -MPS2 cells were stopped with only two SPBs. (D) Colocalization of Mps2 and Mps3. Note that GFP-Mps2 (green) and Mps3-mApple (red) remain bound to the nuclear periphery in the csm4 Delta cell. (E) Mps2 is required for nuclear localization of Csm4. Note that the nucleus becomes a sphere in the P CLB2 -MPS2 cell. Three continuous optical sections are shown in (D,
- Submitted by
- Invitrogen Antibodies (provider)
- Main image

- Experimental details
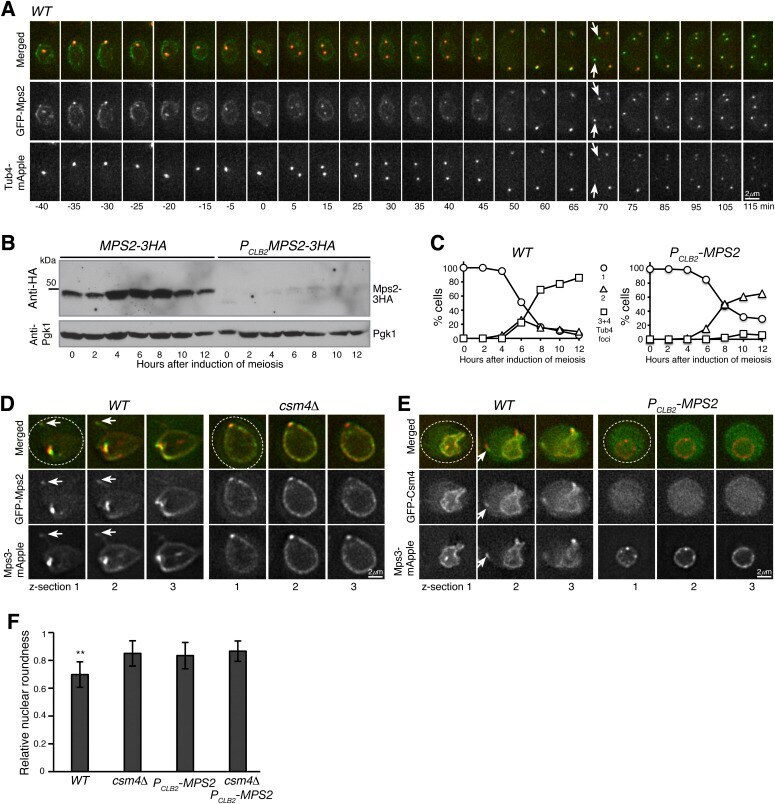
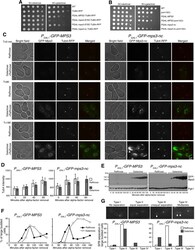
- Figure 5. Ectopic production of Csm4 reconstitutes t-LINC complex in mitosis. (A) Genetic interaction between MPS2 and CSM4 . 10-fold diluted yeast cells were spotted onto glucose or galactose medium. Note that ectopic expression of CSM4 in the galactose medium is toxic to the vegetative yeast cell. (B) Schematic diagram showing the experimental procedure for panels (C, D, E). (C) Western blotting showing induced production of Csm4 in the galactose medium. V5-Csm4 was probed by an anti-V5 antibody. The level of Pgk1 serves as a loading control. (D) Formation of the Mps3 patch in the daughter cell in the presence of Csm4. Tub4-mApple (red) marks the spindle pole body. Projected images of 12 z-sections are shown. Arrows point to the Mps3-GFP (green) patch in daughter cells. (E) Quantification of budding index. Cell aliquots were withdrawn at indicated times, and budding morphology was determined by phase-contrast microscopy. More than 200 cells were counted at each time point in both raffinose and galactose treatments. (F) Impact of actin polymerization on Mps3 patch formation. Schematic diagram at the top shows the experimental procedure. Fluorescence microscopy was performed 15 min after the treatments to visualize Mps3-GFP patch formation as in panel (C). Lat B, latrunculin B. M, mother cell; SC, synthetic complete.
- Submitted by
- Invitrogen Antibodies (provider)
- Main image

- Experimental details
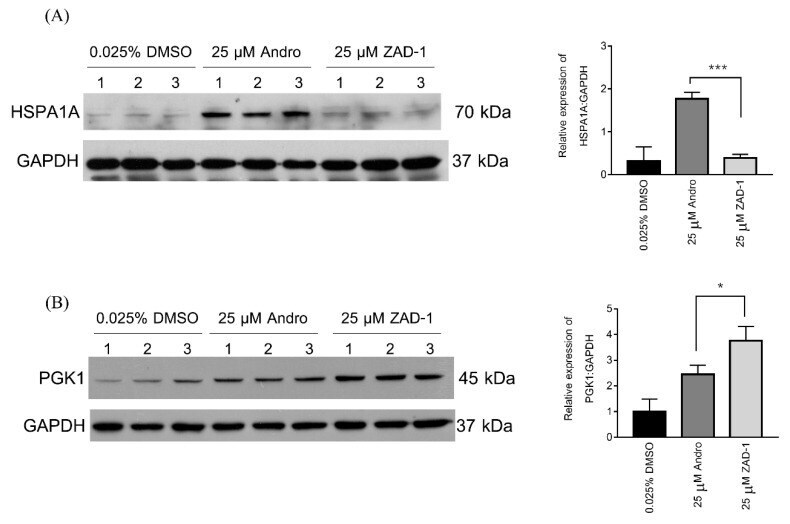
- Figure 6 Consistent with the spot intensity data from the 2D-PAGE gels ( Table 2 ). Validation of proteins differentially expressed after treatment with 25 uM ZAD-1 or andrographolide using 0.025% DMSO as a control. A549 cells were treated with vehicle (0.025% DMS0) or 25 uM ZAD-1 or andrographolide and after 24 h, proteins were extracted then subjected to Western blot analysis to determine the expression level of ( A ) HSPA1A or ( B ) PGK1. Glyceraldehyde 3-phosphate dehydrogenase (GAPDH) was used as a loading control. Experiments were undertaken independently in triplicate. The intensity of protein bands were quantitated by image J image analysis. The error bars show mean +- SD (* means p -value < 0.05 and *** means p -value < 0.001).
- Submitted by
- Invitrogen Antibodies (provider)
- Main image

- Experimental details
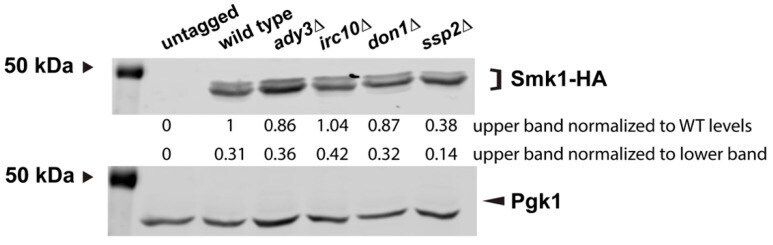
- Figure 5 Smk1 post-translational modification does not require the leading edge protein complex members ADY3 , IRC10 , and DON1 . Immunoblot of protein extracts examining Smk1-HA in an untagged strain lacking Smk1-HA (LH177), Smk1-HA (LH178), ady3 (LH1126), irc10 (LH1127), don1 (LH1128), and ssp2 (LH1129). Pgk1 is used as a loading control. The 50 kDa band from the Precision Plus Protein Markers (BioRad) is indicated on the left of each blot. The upper quantification corresponds to densitometry, in which the slower migrating (upper) Smk1-HA band was first normalized to Pgk1 levels, followed by the normalization of the slower migrating Smk1-HA band in each mutant to wild-type levels of expression. The lower quantification corresponds to densitometry, in which the slower migrating Smk1-HA band was normalized to the faster migrating Smk1-HA band for each genotype.
- Submitted by
- Invitrogen Antibodies (provider)
- Main image
- Experimental details
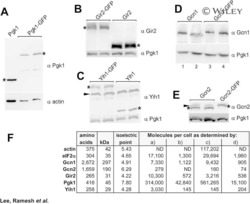
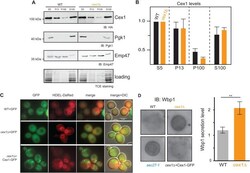
- Fig. 4. Cex1 is associated to membrane fractions, and its deletion leads to defective trafficking of Wbp1, an ER protein having a di-lysine COPI sorting signal. (A) Subcellular fractionation of WT (SEY6210) and cex1 Delta mutant strain, expressing the Cex1-HA fusion protein. Immunodetection of Cex1-HA in each fraction was done using anti-HA antibodies. Presence of cytosolic proteins in the different fraction was assessed by detecting the soluble Pgk1 protein, and ER as well as ER-Golgi vesicles resident protein by the integral membrane protein Emp47. Protein loading was controlled by TCE staining. (B) Cex1 protein levels detected in the P13, P100 and S100 fractions in A were measured using the total lysate (S5) as standard for each strain. Three independent replicates ( n =3) were used. Standard deviation is shown. Statistical analyses using the t -test was done; ** P
- Submitted by
- Invitrogen Antibodies (provider)
- Main image
- Experimental details
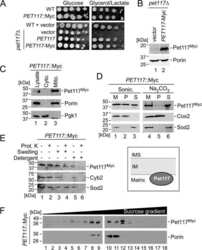
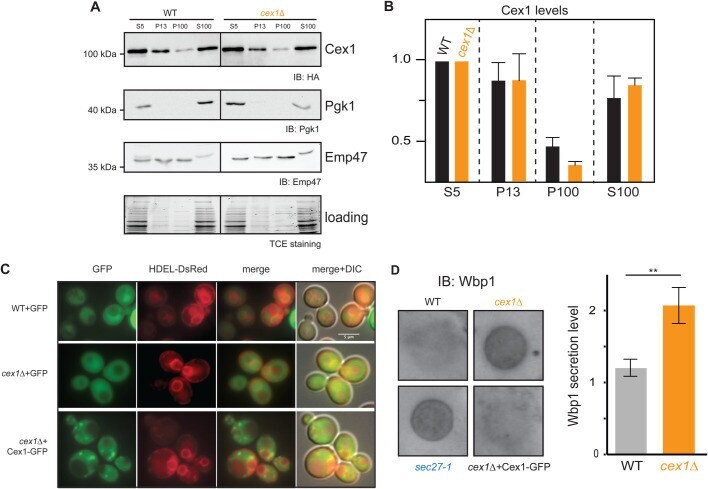
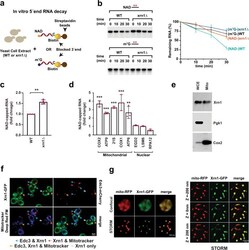
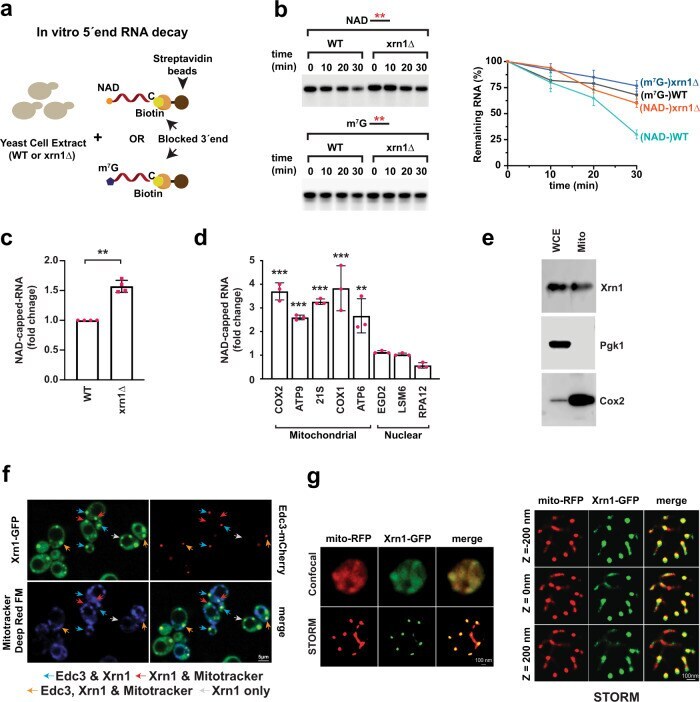
- Xrn1 deNADs NAD-capped RNAs in cells. a Schematic illustration of in vitro 5'-end RNA decay. b Time-course decay analysis of uniformly 32 P-labeled m 7 G- or NAD-capped RNA in the presence of cell extract prepared from WT or xrn1Delta strains. The remaining RNA was quantified and plotted from n = 3 independent experiments (+-SD denoted by error bars). Labeling as in the legend to Fig. 2 . c Total NAD-capped RNA levels from WT and xrn1Delta were detected by NAD-capQ. Data represents average from n = 4 independent experiments. Error bars represent +-SEM; two sided unpaired t test; ** p = 0.0036). d qRT-PCR quantification of NAD-capped mRNA. NAD-capped RNA was enriched by NAD-capture, eluted from the beads, reverse transcribed and detected with gene-specific primers. Data are presented relative to the WT cells set to 1 and derived from n = 3 independent NAD-capture experiments; mean +- SEM; two-sided unpaired t test; ** p < 0.001, *** p < 0.0001. e Purified mitochondria derived from a strain harboring Xrn1 with a C-terminus Strep-tag II was analyzed by Western blot analysis with an anti-Strep-tag antibody. Western blotting analysis of whole cell extract (WCE) and extract prepared from purified mitochondria (mito) using Pgk1 (cytoplasmic protein) and Cox2 (mitochondrial protein) to determine the purity of mitochondria. Source data for panels b, c and d are provided in Source Data File . f Xrn1 knock-in strain containing the gene encoding green fluorescence protein (GFP) in frame
- Submitted by
- Invitrogen Antibodies (provider)
- Main image

- Experimental details
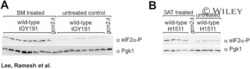
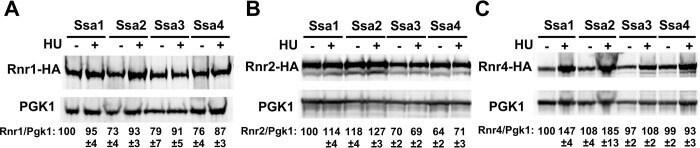
- 10.1371/journal.pgen.1010079.g002 Fig 2 Steady-state levels of RNR small subunits are dependent on Ssa paralogs. ssa1-4Delta cells expressing either Ssa1, 2, 3 or 4 and endogenously tagged Rnr1-HA, Rnr2-HA or Rnr4-HA were grown to exponential phase and were either left untreated or were treated with 200mM HU for 3 hours. Cell extracts were obtained, resolved on SDS-PAGE gels and analyzed by immunoblotting with anti-HA and PGK1 antibodies. PGK1 was used as a loading control. The ratio of RNR subunit/PGK was quantified and determined from three replicate experiments.
- Submitted by
- Invitrogen Antibodies (provider)
- Main image
- Experimental details
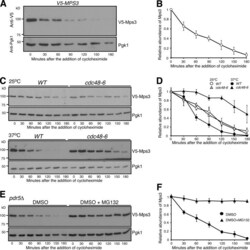
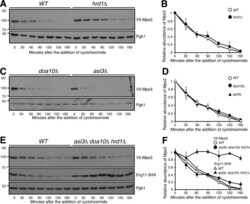
- Figure 1. Proteasome-dependent degradation of Mps3. (A and B) CHX-chase experiment showing Mps3 half-life. Yeast cells were grown to the exponential phase, then CHX was added to the culture media. Cell aliquots were withdrawn at indicated times, and protein extracts were prepared for Western blotting. An anti-V5 antibody was used to probe V5-Mps3. The level of Pgk1 serves as a loading control. Time zero is the point of CHX addition. Quantification of Mps3 protein abundance is shown in B. Error bars represent the standard deviation from the mean of seven biological replicates. (C and D) Cdc48 regulates Mps3 degradation. Cells were grown at 25degC to the exponential phase, and CHX was then added as shown in A. To inactivate cdc48-6 , cells were shifted to 37degC for 1 h before the addition of CHX. Quantification of Mps3 protein abundance in shown in D. Samples were analyzed as in B; error bars represent the standard deviation from the mean of biological replicates ( n = 3). Notably, the half-life of Mps3 at the nonpermissive temperature increased more than twofold. (E and F) The proteasome is responsible for Mps3 turnover. Protein extracts and Western blot were prepared as in A. The use of the pdr5Delta allele allows yeast to uptake MG132, which is dissolved in DMSO. Quantification of Mps3 protein abundance in shown in F. Samples were analyzed as in B. Error bars represent the standard deviation from the mean of biological replicates ( n = 3). Note that Mps3 is stabilized in th

- Submitted by
- Invitrogen Antibodies (provider)
- Main image
- Experimental details
- Figure 4. Mps3 degradation is independent of the known ERAD and INMAD E3 ligases. (A and B) Canonical E3 ligase Hrd1 does not regulate Mps3 degradation. WT and hrd1Delta yeast cells were prepared for CHX chase as in Fig. 1 A . Quantification of Mps3 protein abundance is shown in B. Error bars represent the standard deviation from the mean of biological replicates ( n = 3). (C and D) Canonical E3 ligases Doa10 and Asi3 do not regulate Mps3 degradation. Yeast cells were prepared for CHX chase in a doa10Delta or asi3Delta background and were analyzed as in Fig. 1 A . Quantification of Mps3 protein abundance as shown in C. Error bars represent the standard deviation from the mean of biological replicates ( n = 3). (E and F) The canonical E3 ligases involved in ERAD do not regulate Mps3 degradation through redundancy. WT and asi3Deltadoa10Deltahrd1Delta yeast cells were prepared for CHX chase and analyzed as in Fig. 1 A . Erg11-3HA was used as a positive control, and Pgk1 was probed for a loading control. Quantification of Mps3 relative protein abundance is shown in F. Error bars represent the standard deviation from the mean of biological replicates ( n = 3). Note there is no change in Mps3 half-life between the WT and asi3Deltadoa10Deltahrd1Delta cells.

- Submitted by
- Invitrogen Antibodies (provider)
- Main image
- Experimental details
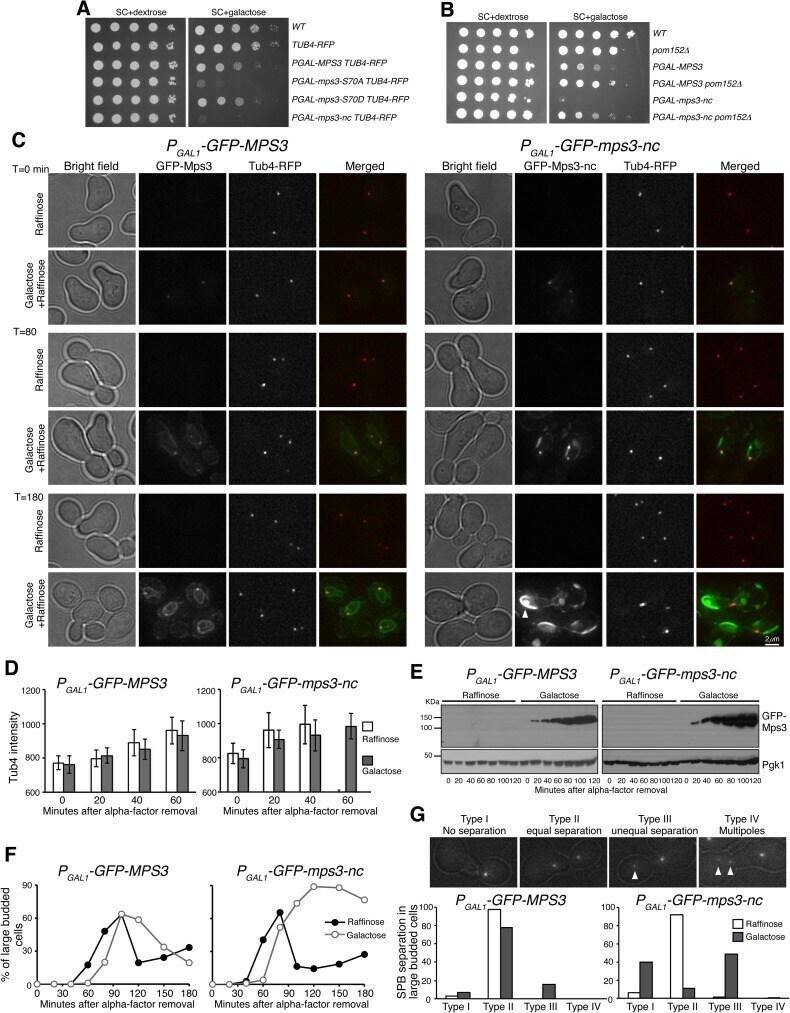
- Fig 7 Phenotypes of MPS3 overexpression and inhibition of SPB separation by noncleavable Mps3 in mitosis. ( A ) The effect of overexpression of mps3-S70A and mps3-nc on cell growth. Yeast strains were grown in YPD to saturation, tenfold diluted, and spotted onto SC+dextrose and SC+galactose plates. ( B ) Genetic interaction between mps3-nc and pom152 Delta. Tenfold serial dilutions of yeast cells were spotted onto SC+dextrose and SC+galactose plates as shown in panel A . Note that pom152 Delta partially suppressed the lethality of P GAL1 -mps3-nc expression, indicating that the toxicity caused by mps3-nc originated at the yeast centrosome. ( C ) Accumulation of noncleavable Mps3 at the nuclear periphery. Yeast cells were grown in raffinose medium and arrested at G 1 with the alpha-factor; expression of the GAL1 promoter was then induced by the addition of galactose 30 min before removal of alpha-factor. Aliquots were withdrawn at indicated times and prepared for live-cell fluorescence microscopy. Time zero is defined as the point of alpha-factor removal. Representative images from wild-type and mps3-nc cells are shown. Tub4-RFP marks the SPB. Note that SPBs failed to separate or misseparated in cells with GFP-Mps3-nc. GFP-Mps3-nc first localized to the SPB, and then accumulated at the nuclear periphery, forming protein aggregates in large budded cells (arrows). In contrast, wild-type GFP-Mps3 was concentrated at the SPB and localized evenly around the nucl
- Submitted by
- Invitrogen Antibodies (provider)
- Main image
- Experimental details
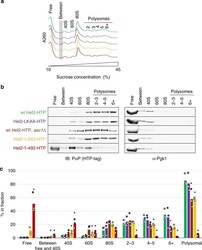
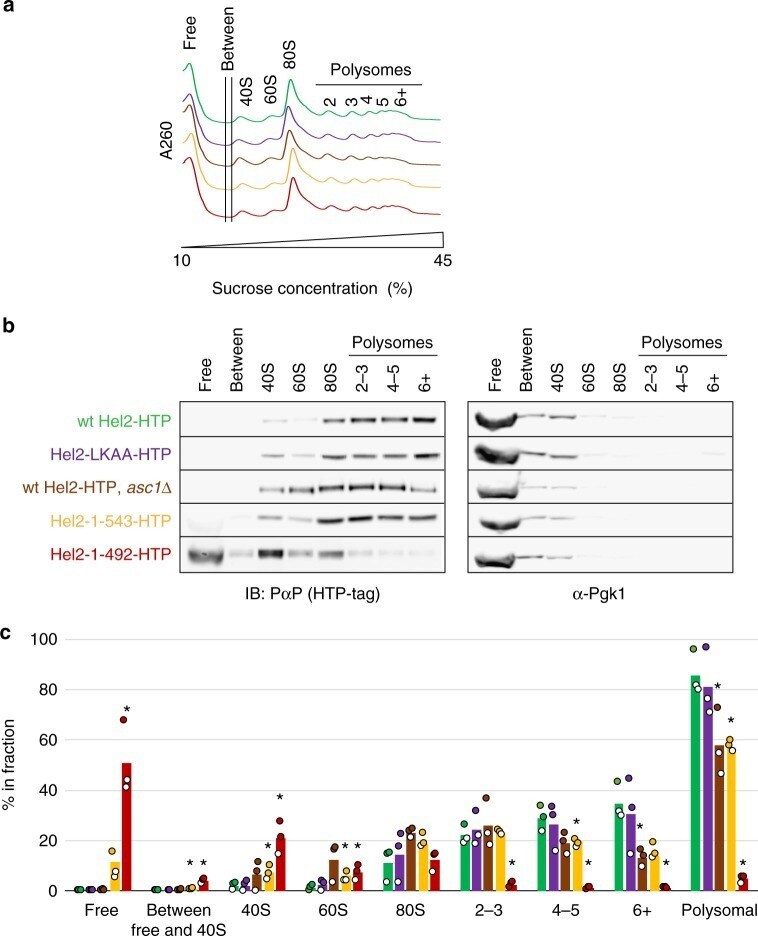
- Fig. 6 Assessment of ribosome and polysome association of different Hel2 mutants. a Representative A 260 profiles (each curve normalized to a sum of 1) of sucrose density gradients from wild-type and mutant strains (see b for colour code and Supplementary Fig. 9 for triplicate quantification of signal in different fractions. b Immunoblot analysis of tagged Hel2 content in pooled and precipitated sucrose fractions containing different sub-populations of ribosomal components, monosomes or polysomes. Membranes were probed for the HTP-tag (using peroxidase-anti-peroxidase) and for Pgk1 as a control. c Quantification of tagged Hel2 content in each pooled fraction. Data were obtained from three independent biological replicates per strain (independently isolated clones). * p < 0.05, according to Student's t test (two-tailed, paired, w.r.t. wild-type). See b for colour code
- Submitted by
- Invitrogen Antibodies (provider)
- Main image
- Experimental details
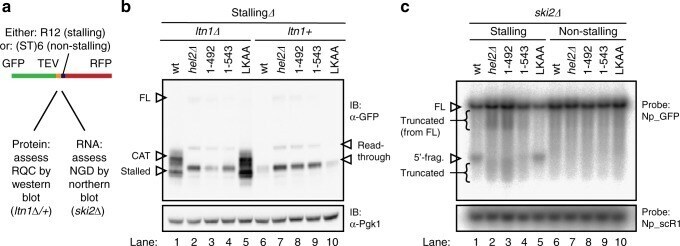
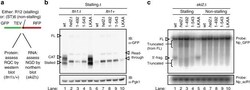
- Fig. 7 Assessing functional consequences of HEL2 deletion and mutation using a reporter system for ribosome-associated quality control (RQC) and no-go decay (NGD). a A published 23 reporter system encoding green fluorescent protein (GFP), TEV protease site, followed by a stalling (R12) or non-stalling ((ST)6) sequence and by red fluorescent protein to assess RQC and NGD. Scheme adapted from ref. 23 . b Western blot for one of the three biological replicates from independent clones is shown. Data are quantified in Supplementary Fig. 10 . Upper panel: probed with anti-GFP to visualize the reporter. Lower panel: anti-Pgk1 loading control. Migration positions are indicated for the stalled peptide (stalled) and for this peptide modified by addition of a CAT-tail (CAT). Also indicated are the major product from read-through of the stalling sequence (read-through) and the full-length protein (FL). The region around the FL product is shown in higher contrast in Supplementary Fig. 10 a and the region containing stalled and CAT products in Supplementary Fig. 10 c . c Northern blot analysis of stalling and non-stalling reporter transcripts in ski2 background using probe Np_GFP and loading control using probe Np_scR1. Autoradiograph for one of the three biological replicates from independent clones is shown. Data are quantified in Supplementary Fig. 11 . Migration positions are indicated for the full-length mRNA (FL), the expected 5' product of mRNA cleavage at the stall