Explore
 Validate
 Learn
LearnPA1-1040
antibody from Invitrogen Antibodies
Targeting: S1PR1
CD363, D1S3362, edg-1, EDG1
 Western blot Immunocytochemistry
 Immunoprecipitation Immunohistochemistry Flow cytometry Other assay
Antibody data
- Antibody Data
- Antigen structure
- References [11]
- Comments [0]
- Validations
- Western blot [2]
- Immunocytochemistry [4]
- Flow cytometry [1]
- Other assay [8]
Submit
Validation data
Reference
Comment
Report error
- Product number
- PA1-1040 - Provider product page

- Provider
- Invitrogen Antibodies
- Product name
- S1P1 Polyclonal Antibody
- Antibody type
- Polyclonal
- Antigen
- Synthetic peptide
- Description
- PA1-1040 detects S1P1 protein in transfected human and mouse cell samples. This antibody shows no cross-reactivity to S1P3. PA1-1040 has successfully been used in immuno-fluorescence, immunohistochemistry, immunoprecipitation and Western blot procedures. By Western blot, this antibody detects an ~44 kDa protein representing recombinant S1P1 from transfected HEK293 cells. Immunofluorescence data demonstrates that S1P1 is localized to the plasma membrane after staining with PA1-1040. The PA1-1040 immunogen is a synthetic peptide corresponding to residues S(359) H P Q K D D G D N P E T I(372) of mouse S1P1. This sequence is completely conserved in rat and 92% conserved in human S1P1. This peptide (Cat. # PEP-220) is available for use in neutralization and control experiments.
- Reactivity
- Human, Mouse, Rat
- Host
- Rabbit
- Isotype
- IgG
- Vial size
- 100 μg
- Concentration
- 1 mg/mL
- Storage
- -20°C, Avoid Freeze/Thaw Cycles
Submitted references Inhibition of Sphingosine-1-Phosphate Receptor 2 by JTE013 Promoted Osteogenesis by Increasing Vesicle Trafficking, Wnt/Ca(2+), and BMP/Smad Signaling.
Silencing of Sphingosine kinase 1 Affects Maturation Pathways in Mouse Neonatal Cardiomyocytes.
Novel delivery of cellular therapy to reduce ischemia reperfusion injury in kidney transplantation.
Dysregulation of sphingolipid metabolism contributes to bortezomib-induced neuropathic pain.
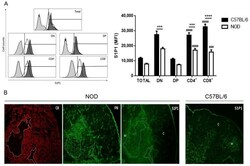
Sphingosine-1-Phosphate Receptor 1 Is Involved in Non-Obese Diabetic Mouse Thymocyte Migration Disorders.
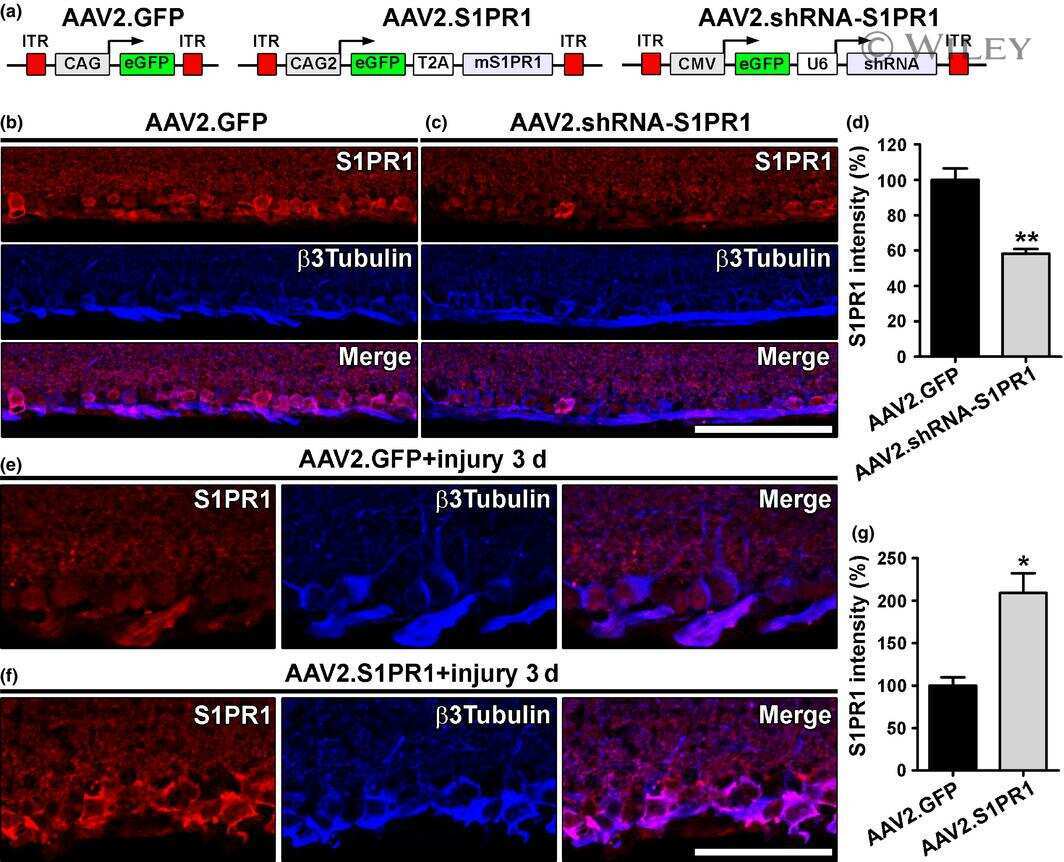
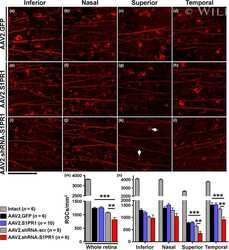
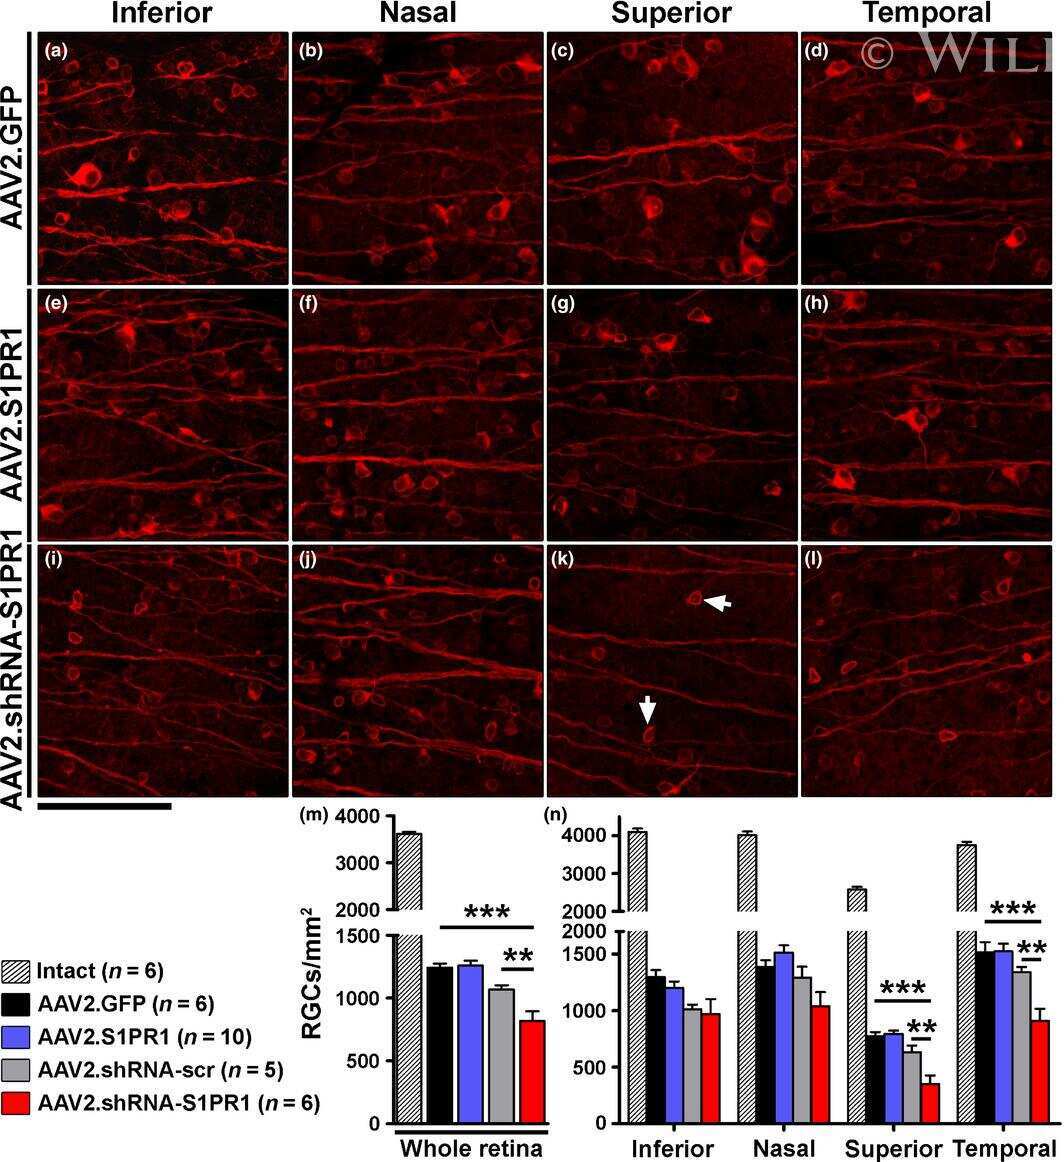
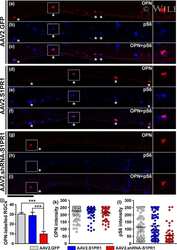
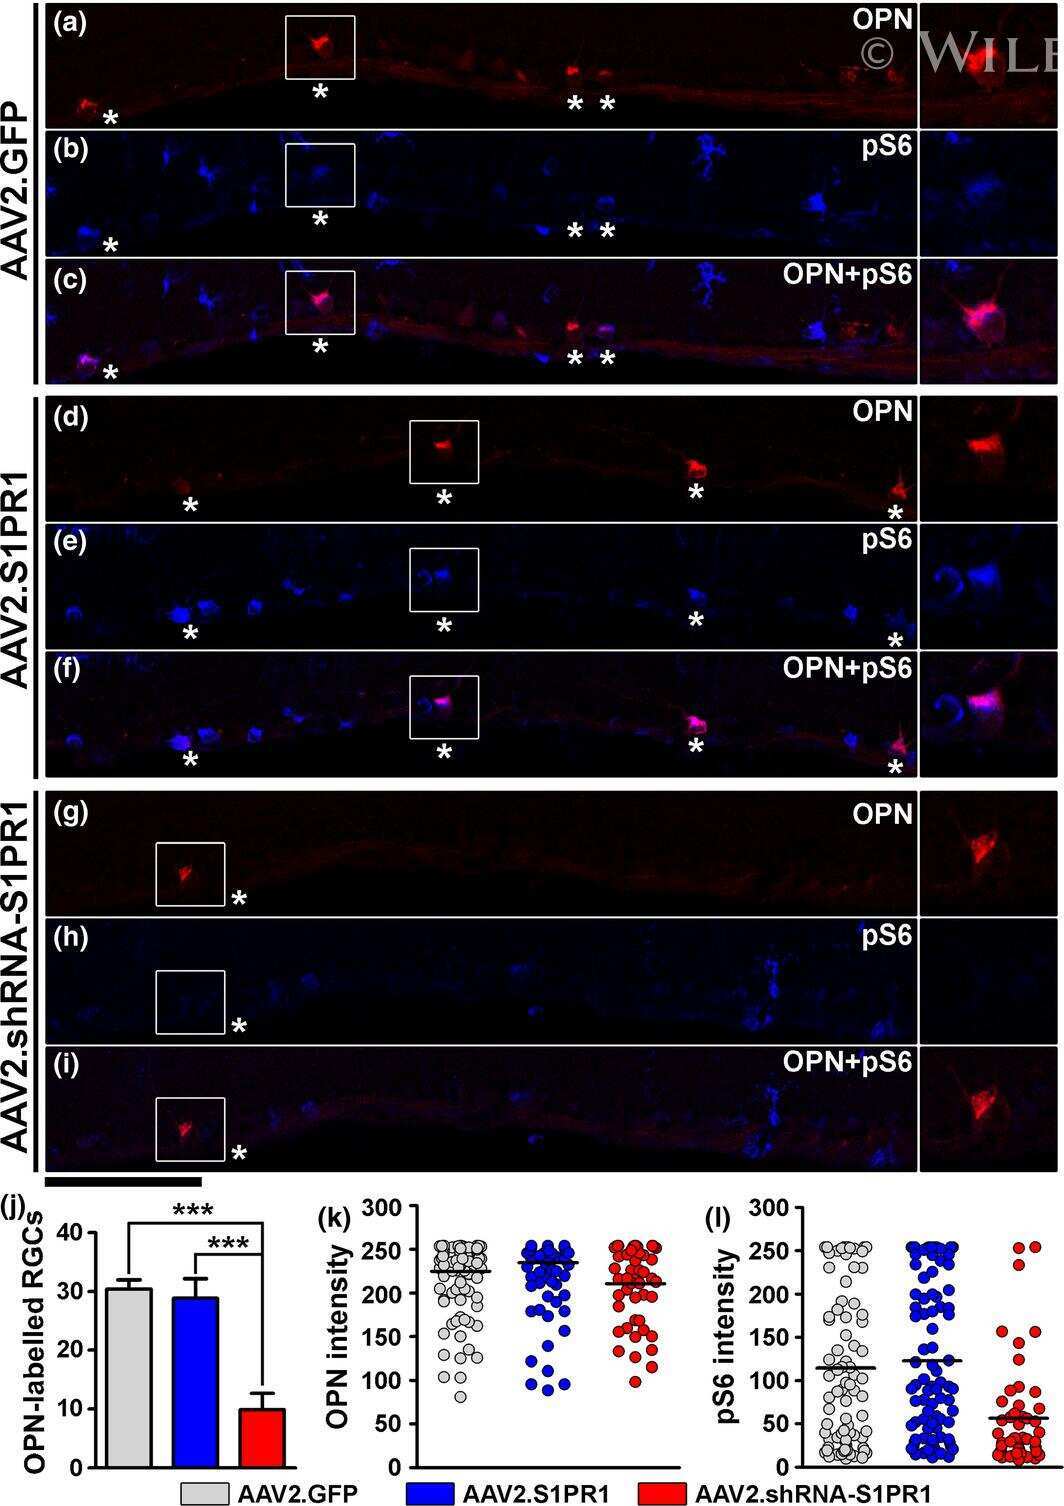
Sphingosine 1-Phosphate Receptor 1 Modulates CNTF-Induced Axonal Growth and Neuroprotection in the Mouse Visual System.
Sphingosine 1-phosphate receptor 1 is required for retinal ganglion cell survival after optic nerve trauma.
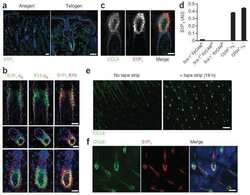
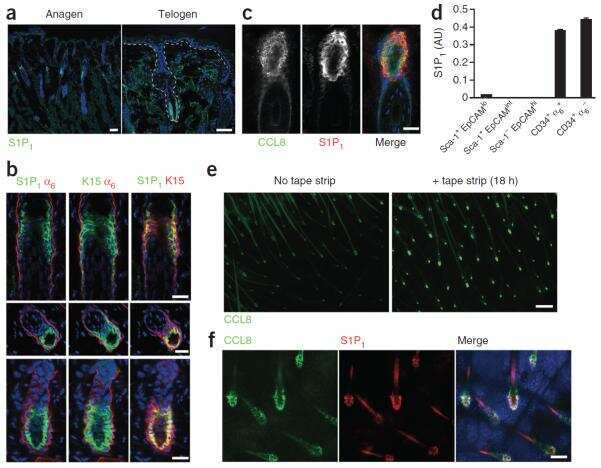
Stress-induced production of chemokines by hair follicles regulates the trafficking of dendritic cells in skin.
Sphingosine kinase 1/S1P pathway involvement in the GDNF-induced GAP43 transcription.
Sphingosine-1-phosphate receptor type 1 regulates glioma cell proliferation and correlates with patient survival.
A polysaccharide, MDG-1, induces S1P1 and bFGF expression and augments survival and angiogenesis in the ischemic heart.
Lin S, Pandruvada S, Yu H
International journal of molecular sciences 2021 Nov 8;22(21)
International journal of molecular sciences 2021 Nov 8;22(21)
Silencing of Sphingosine kinase 1 Affects Maturation Pathways in Mouse Neonatal Cardiomyocytes.
Jozefczuk E, Szczepaniak P, Guzik TJ, Siedlinski M
International journal of molecular sciences 2021 Mar 31;22(7)
International journal of molecular sciences 2021 Mar 31;22(7)
Novel delivery of cellular therapy to reduce ischemia reperfusion injury in kidney transplantation.
Thompson ER, Bates L, Ibrahim IK, Sewpaul A, Stenberg B, McNeill A, Figueiredo R, Girdlestone T, Wilkins GC, Wang L, Tingle SJ, Scott WE 3rd, de Paula Lemos H, Mellor AL, Roobrouck VD, Ting AE, Hosgood SA, Nicholson ML, Fisher AJ, Ali S, Sheerin NS, Wilson CH
American journal of transplantation : official journal of the American Society of Transplantation and the American Society of Transplant Surgeons 2021 Apr;21(4):1402-1414
American journal of transplantation : official journal of the American Society of Transplantation and the American Society of Transplant Surgeons 2021 Apr;21(4):1402-1414
Dysregulation of sphingolipid metabolism contributes to bortezomib-induced neuropathic pain.
Stockstill K, Doyle TM, Yan X, Chen Z, Janes K, Little JW, Braden K, Lauro F, Giancotti LA, Harada CM, Yadav R, Xiao WH, Lionberger JM, Neumann WL, Bennett GJ, Weng HR, Spiegel S, Salvemini D
The Journal of experimental medicine 2018 May 7;215(5):1301-1313
The Journal of experimental medicine 2018 May 7;215(5):1301-1313
Sphingosine-1-Phosphate Receptor 1 Is Involved in Non-Obese Diabetic Mouse Thymocyte Migration Disorders.
Lemos JP, Smaniotto S, Messias CV, Moreira OC, Cotta-de-Almeida V, Dardenne M, Savino W, Mendes-da-Cruz DA
International journal of molecular sciences 2018 May 12;19(5)
International journal of molecular sciences 2018 May 12;19(5)
Sphingosine 1-Phosphate Receptor 1 Modulates CNTF-Induced Axonal Growth and Neuroprotection in the Mouse Visual System.
Joly S, Dalkara D, Pernet V
Neural plasticity 2017;2017:6818970
Neural plasticity 2017;2017:6818970
Sphingosine 1-phosphate receptor 1 is required for retinal ganglion cell survival after optic nerve trauma.
Joly S, Pernet V
Journal of neurochemistry 2016 Aug;138(4):571-86
Journal of neurochemistry 2016 Aug;138(4):571-86
Stress-induced production of chemokines by hair follicles regulates the trafficking of dendritic cells in skin.
Nagao K, Kobayashi T, Moro K, Ohyama M, Adachi T, Kitashima DY, Ueha S, Horiuchi K, Tanizaki H, Kabashima K, Kubo A, Cho YH, Clausen BE, Matsushima K, Suematsu M, Furtado GC, Lira SA, Farber JM, Udey MC, Amagai M
Nature immunology 2012 Jun 24;13(8):744-52
Nature immunology 2012 Jun 24;13(8):744-52
Sphingosine kinase 1/S1P pathway involvement in the GDNF-induced GAP43 transcription.
Murakami M, Ito H, Hagiwara K, Kobayashi M, Hoshikawa A, Takagi A, Kojima T, Tamiya-Koizumi K, Sobue S, Ichihara M, Suzuki M, Banno Y, Nozawa Y, Murate T
Journal of cellular biochemistry 2011 Nov;112(11):3449-58
Journal of cellular biochemistry 2011 Nov;112(11):3449-58
Sphingosine-1-phosphate receptor type 1 regulates glioma cell proliferation and correlates with patient survival.
Yoshida Y, Nakada M, Sugimoto N, Harada T, Hayashi Y, Kita D, Uchiyama N, Hayashi Y, Yachie A, Takuwa Y, Hamada J
International journal of cancer 2010 May 15;126(10):2341-52
International journal of cancer 2010 May 15;126(10):2341-52
A polysaccharide, MDG-1, induces S1P1 and bFGF expression and augments survival and angiogenesis in the ischemic heart.
Wang S, Zhang Z, Lin X, Xu DS, Feng Y, Ding K
Glycobiology 2010 Jan;20(4):473-84
Glycobiology 2010 Jan;20(4):473-84
No comments: Submit comment
Supportive validation
- Submitted by
- Invitrogen Antibodies (provider)
- Main image

- Experimental details
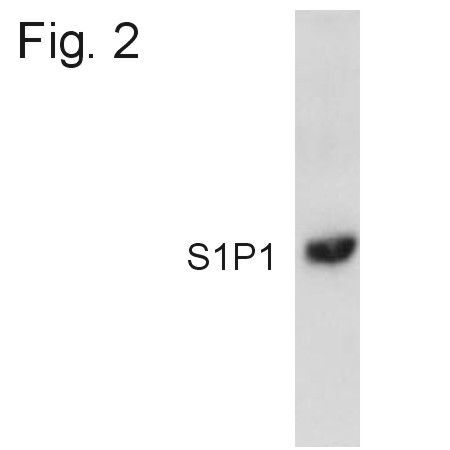
- Western blot detection of S1P1 from transfected HEK293 cell lysate using Product # PA1-1040.
- Submitted by
- Invitrogen Antibodies (provider)
- Main image

- Experimental details
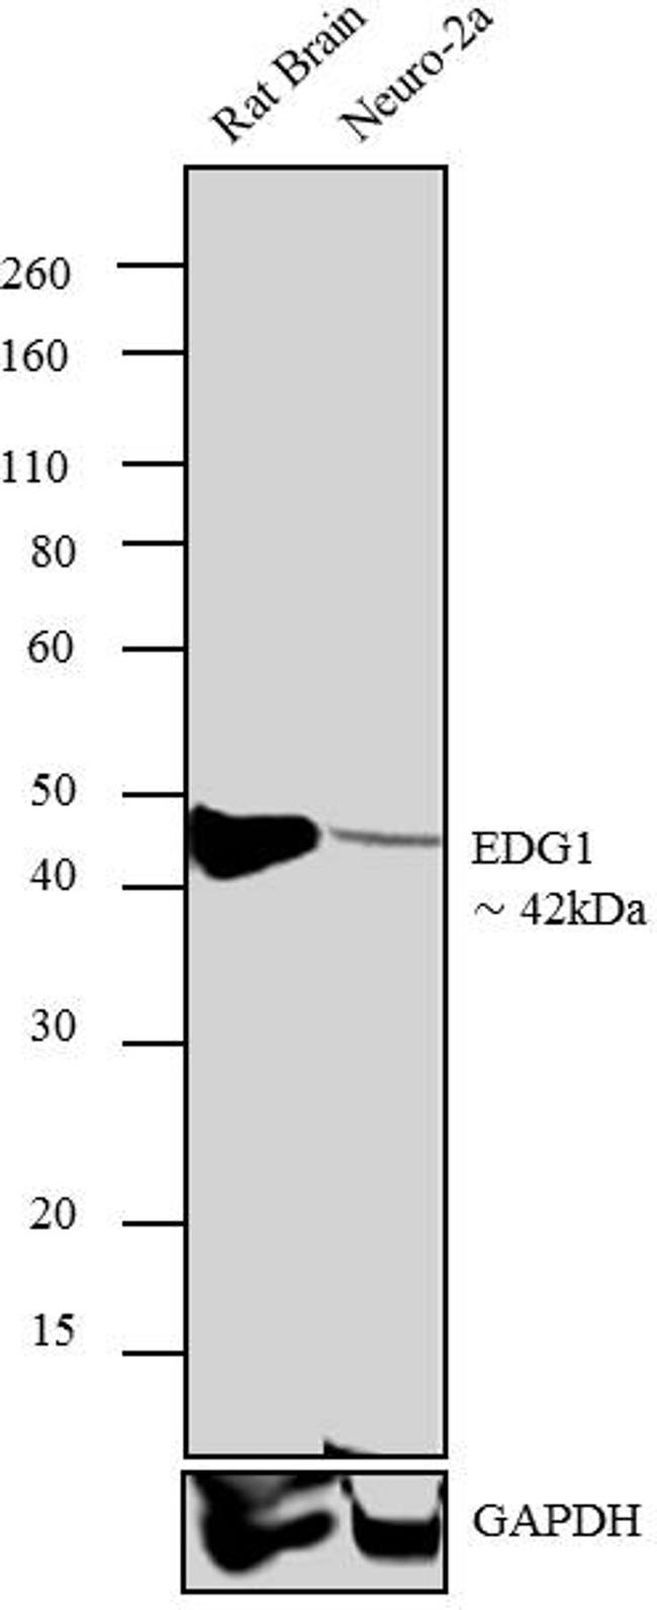
- Western blot analysis of EDG1 was performed using tissue extract and whole cell lysate of Rat Brain (Lane 1) and Neuro- 2a (Lane 2). The blots were probed with Anti- EDG1 Rabbit polyclonal Antibody (Product # PA1-1040, 2 µg/mL) and detected by chemiluminescence using Goat anti-Rabbit IgG (Heavy Chain) Superclonal™ Secondary Antibody, HRP conjugate (Product # A27036, 0.4 µg/mL, 1:2500 dilution). A ~ 42 kDa band corresponding to EDG1 was observed across tissue and cell line tested. Known quantity of protein samples were electrophoresed using Novex® NuPAGE® 4-12 % Bis-Tris gel (Product # NP0321BOX), XCell SureLock™ Electrophoresis System (Product # EI0002) and Novex® Sharp Pre-Stained Protein Standard (Product # LC5800). Resolved proteins were then transferred onto a nitrocellulose membrane with iBlot® 2 Dry Blotting System (Product # IB21001). The membrane was probed with the relevant primary and secondary Antibody using iBind™ Flex Western Starter Kit (Product # SLF2000S). Chemiluminescent detection was performed using Pierce™ ECL Western Blotting Substrate (Product # 32106).
Supportive validation
- Submitted by
- Invitrogen Antibodies (provider)
- Main image
- Experimental details
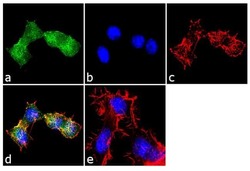
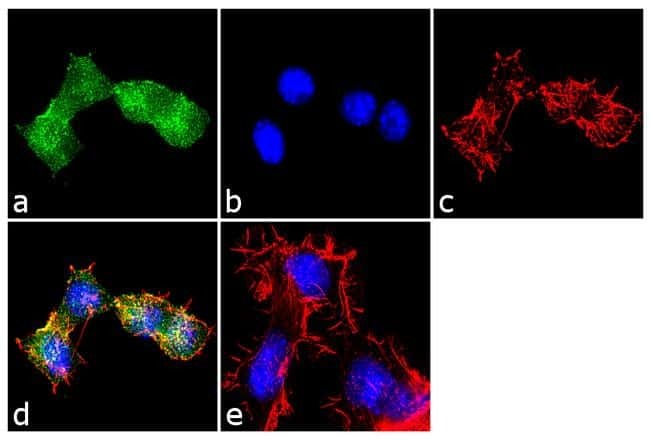
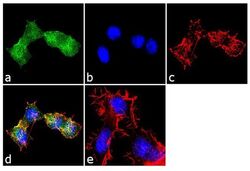
- Immunofluorescence analysis of EDG1 was performed using 70% confluent log phase Neuro-2a cells. The cells were fixed with 4% paraformaldehyde for 10 minutes, permeabilized with 0.1% Triton™ X-100 for 10 minutes, and blocked with 1% BSA for 1 hour at room temperature. The cells were labeled with EDG1 Rabbit Polyclonal Antibody (Product # PA1-1040) at 2 µg/mL in 0.1% BSA and incubated for 3 hours at room temperature and then labeled with Goat anti-Rabbit IgG (H+L) Superclonal™ Secondary Antibody, Alexa Fluor® 488 conjugate (Product # A27034) a dilution of 1:2000 for 45 minutes at room temperature (Panel a: green). Nuclei (Panel b: blue) were stained with SlowFade® Gold Antifade Mountant with DAPI (Product # S36938). F-actin (Panel c: red) was stained with Alexa Fluor® 555 Rhodamine Phalloidin (Product # R415, 1:300). Panel d represents the merged image showing localization in the membrane. Panel e shows the no primary antibody control. The images were captured at 60X magnification.
- Submitted by
- Invitrogen Antibodies (provider)
- Main image

- Experimental details
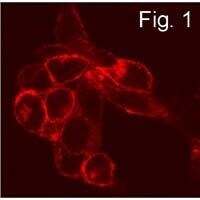
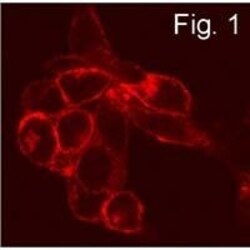
- Immunofluorescence staining of S1P1 in transfected CCL39 cells using Product # PA1-1040.
- Submitted by
- Invitrogen Antibodies (provider)
- Main image
- Experimental details
- Immunofluorescence staining of S1P1 in transfected CCL39 cells using Product # PA1-1040.

- Submitted by
- Invitrogen Antibodies (provider)
- Main image
- Experimental details
- Immunofluorescence analysis of EDG1 was performed using 70% confluent log phase Neuro-2a cells. The cells were fixed with 4% paraformaldehyde for 10 minutes, permeabilized with 0.1% Triton™ X-100 for 10 minutes, and blocked with 1% BSA for 1 hour at room temperature. The cells were labeled with EDG1 Rabbit Polyclonal Antibody (Product # PA1-1040) at 2 µg/mL in 0.1% BSA and incubated for 3 hours at room temperature and then labeled with Goat anti-Rabbit IgG (Heavy Chain) Superclonal™ Secondary Antibody, Alexa Fluor® 488 conjugate (Product # A27034) a dilution of 1:2000 for 45 minutes at room temperature (Panel a: green). Nuclei (Panel b: blue) were stained with SlowFade® Gold Antifade Mountant with DAPI (Product # S36938). F-actin (Panel c: red) was stained with Alexa Fluor® 555 Rhodamine Phalloidin (Product # R415, 1:300). Panel d represents the merged image showing localization in the membrane. Panel e shows the no primary antibody control. The images were captured at 60X magnification.

Supportive validation
- Submitted by
- Invitrogen Antibodies (provider)
- Main image
- Experimental details
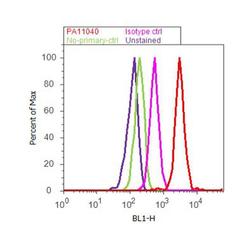
- Flow cytometry analysis of EDG1 was performed using SH-SY5Y cells. Cells were fixed with 70% ethanol for 10 minutes, permeabilized with 0.25% Triton™ X-100 for 20 minutes, and blocked with 5% BSA for 30 minutes at room temperature. Cells were labeled with EDG1 Rabbit Polyclonal Antibody (PA1-1040, red histogram) or with rabbit isotype control (pink histogram) at 3-5 ug/million cells in 2.5% BSA. After incubation at room temperature for 2 hours, the cells were labeled with Alexa Fluor® 488 Goat Anti-Rabbit Secondary Antibody (A11008) at a dilution of 1:400 for 30 minutes at room temperature. The representative 10,000 cells were acquired and analyzed for each sample using an Attune® Acoustic Focusing Cytometer. The purple histogram represents unstained control cells and the green histogram represents no-primary-antibody control..

Supportive validation
- Submitted by
- Invitrogen Antibodies (provider)
- Main image
- Experimental details
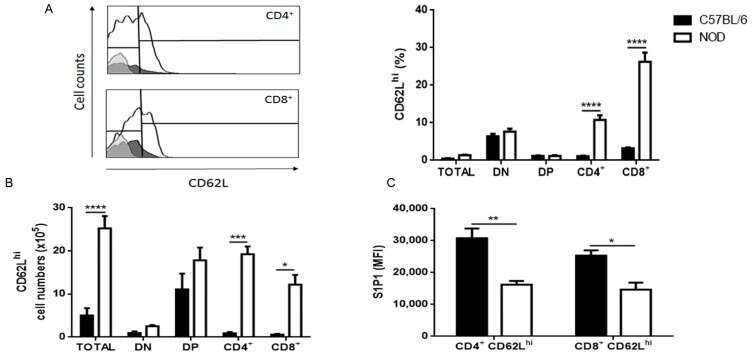
- Figure 2 NOD CD62L hi mature thymocytes have decreased expression of S1P1. The graphs show CD62L, S1P1 and CD49e expression in CD4/CD8-defined thymocyte subpopulations in C57BL/6 (black bars) and NOD (white bars) mice, analyzed by flow cytometry. ( A ) CD62L relative cell numbers (%); ( B ) CD62L absolute cell numbers; ( C ) S1P1 expression in CD4 + CD62L hi and CD8 + CD62L hi subpopulations; ( D ) CD49e expression in CD4 + CD62L hi and CD8 + CD62L hi subpopulations, ( E ) percentage of CD4 + and CD8 + CD62L hi cells expressing CD49e; ( F ) S1P1 expression in CD4 + CD62L hi CD49e - and CD8 + CD62L hi CD49e - cells; and ( G ) S1P1 expression in CD4 + CD62L hi CD49e + and CD8 + CD62L hi CD49e + cells. Histograms show the CD62L ( A ) and CD49e ( D ) staining in NOD (white curve) and C57BL/6 (black curve) CD4 + and CD8 + SP thymocytes. The grey curves represent the negative staining control for C57BL/6. The region marks the positive staining in the case of CD49e and the neg/lo vs. hi (negative/ low vs. high) populations in the CD62L histograms. Total = total thymocytes; DN = CD4 - CD8 - double-negative; DP = CD4 + CD8 + double-positive; CD4 + = CD4 + CD8 - single-positive; CD8 + = CD4 - CD8 + single-positive; MFI = median fluorescence intensity; % = relative cell numbers. Results are expressed as mean +- SEM and were analyzed by 2-way ANOVA followed by Tukey's post-test. Differences were considered statistically significant when * p < 0.05; ** p < 0.01; *** p < 0.001; **** p < 0.
- Submitted by
- Invitrogen Antibodies (provider)
- Main image
- Experimental details
- NULL
- Submitted by
- Invitrogen Antibodies (provider)
- Main image
- Experimental details
- NULL
- Submitted by
- Invitrogen Antibodies (provider)
- Main image
- Experimental details
- NULL
- Submitted by
- Invitrogen Antibodies (provider)
- Main image
- Experimental details
- NULL
- Submitted by
- Invitrogen Antibodies (provider)
- Main image
- Experimental details
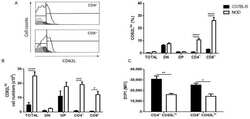
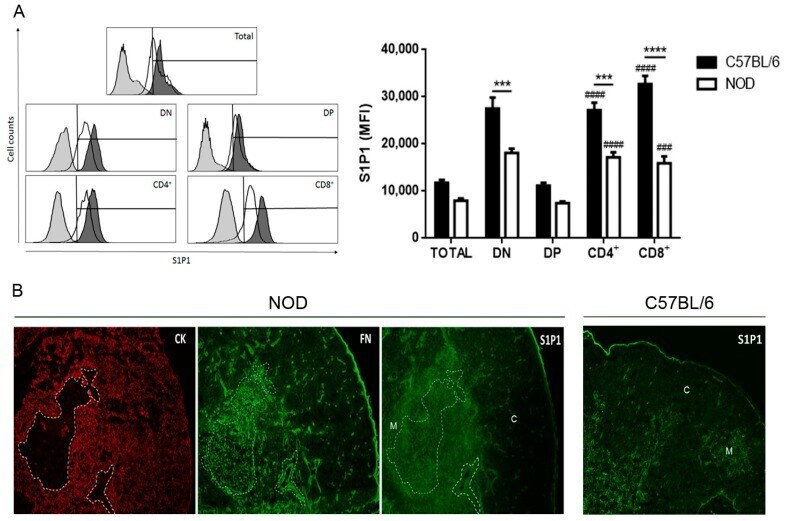
- Figure 1 Decreased expression of sphingosine-1-phosphate (S1P1) in non-obese diabetic (NOD) mouse thymocytes. Panel ( A ) shows the S1P1 expression in CD4/CD8-defined thymocyte subpopulations in C57BL/6 (black bars) and NOD (white bars) mice, analyzed by flow cytometry. The histograms show the S1P1 representative staining in NOD (white curve) and C57BL/6 (black curve) thymocyte subpopulations. Grey curves represent the negative staining control for C57BL/6 and the region marks the positive staining. Total = total thymocytes; DN = CD4 - CD8 - double-negative; DP = CD4 + CD8 + double-positive; CD4 + = CD4 + CD8 - single-positive; CD8 + = CD4 - CD8 + single-positive; MFI = median fluorescence intensity. Results are expressed as mean +- SEM and were analyzed by 2-way ANOVA followed by Tukey's post-test. Differences were considered statistically significant when *** or ### p < 0.001; **** or #### p < 0.0001. Asterisks represent statistical significance between C57BL/6 and NOD subpopulations; hash marks represent statistical significance between DP and SP subpopulations in the same mouse strain, after evaluating 3 C57BL/6 and 4 NOD thymi. ( B ) immunohistochemistry showing the S1P1, fibronectin (FN) and cytokeratin (CK) expression profile in NOD and S1P1 expression in C57BL/6 thymus sections. The white dashed lines delimit the giant PVS. C = cortical region; M = medullary region. Three thymi per group were evaluated, with 1 cryosection being analyzed. Original magnif
- Submitted by
- Invitrogen Antibodies (provider)
- Main image
- Experimental details
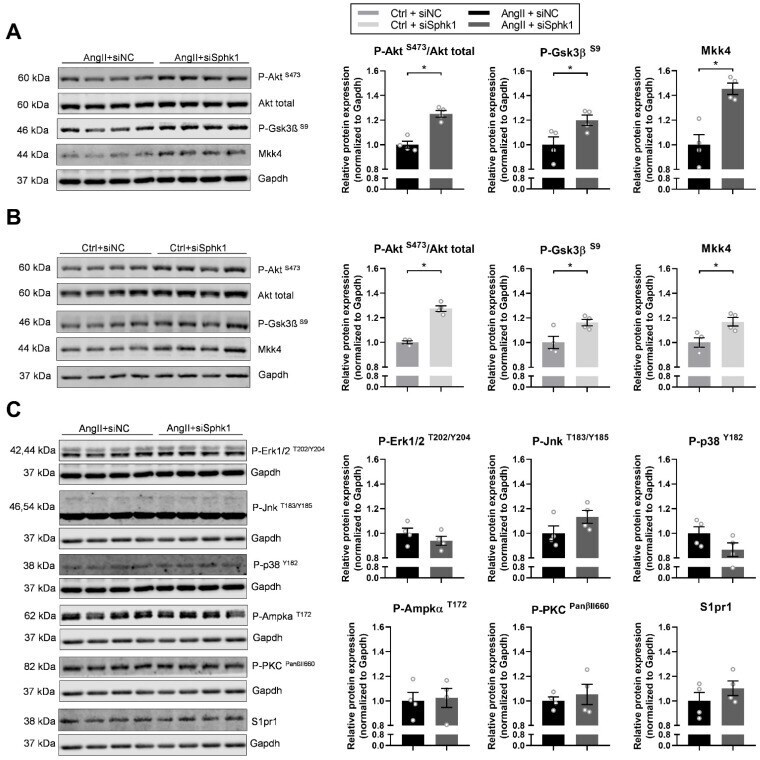
- Figure 3 Key signaling pathways mediating the effects of Sphk1 silencing in neonatal CMs. ( A ) Western blot and densitometric analysis of the expression of P-Akt S473 , phosphorylated glycogen synthase kinase 3 beta (P-Gsk3beta S9 ) and mitogen-activated protein kinase (MAPK) kinase 4 (Mkk4) in siSphk1- or siNC-transfected and AngII- or ( B ) Ctrl-treated (24 h) neonatal CMs. Protein expression was normalized to GAPDH. ( C ) Western blot and densitometric analysis of the expression of phosphorylated extracellular signal-regulated kinases 1/2 (P-Erk1/2 T202/Y204 ), phosphorylated c-Jun N -terminal kinases (P-Jnk T183/Y185 ), phosphorylated p38 mitogen-activated protein kinase (P-p38 Y182 ), phosphorylated 5''AMP-activated protein kinase alpha (P-Ampkalpha T172 ), phosphorylated protein kinase C (P-PKC PanbetaII660 ) and S1P receptor type 1 (S1pr1) in siSphk1- or siNC-transfected and AngII-treated (24 h) neonatal CMs. Protein expression was normalized to GAPDH. All data are represented as means +- SEM. * p < 0.05.
- Submitted by
- Invitrogen Antibodies (provider)
- Main image
- Experimental details
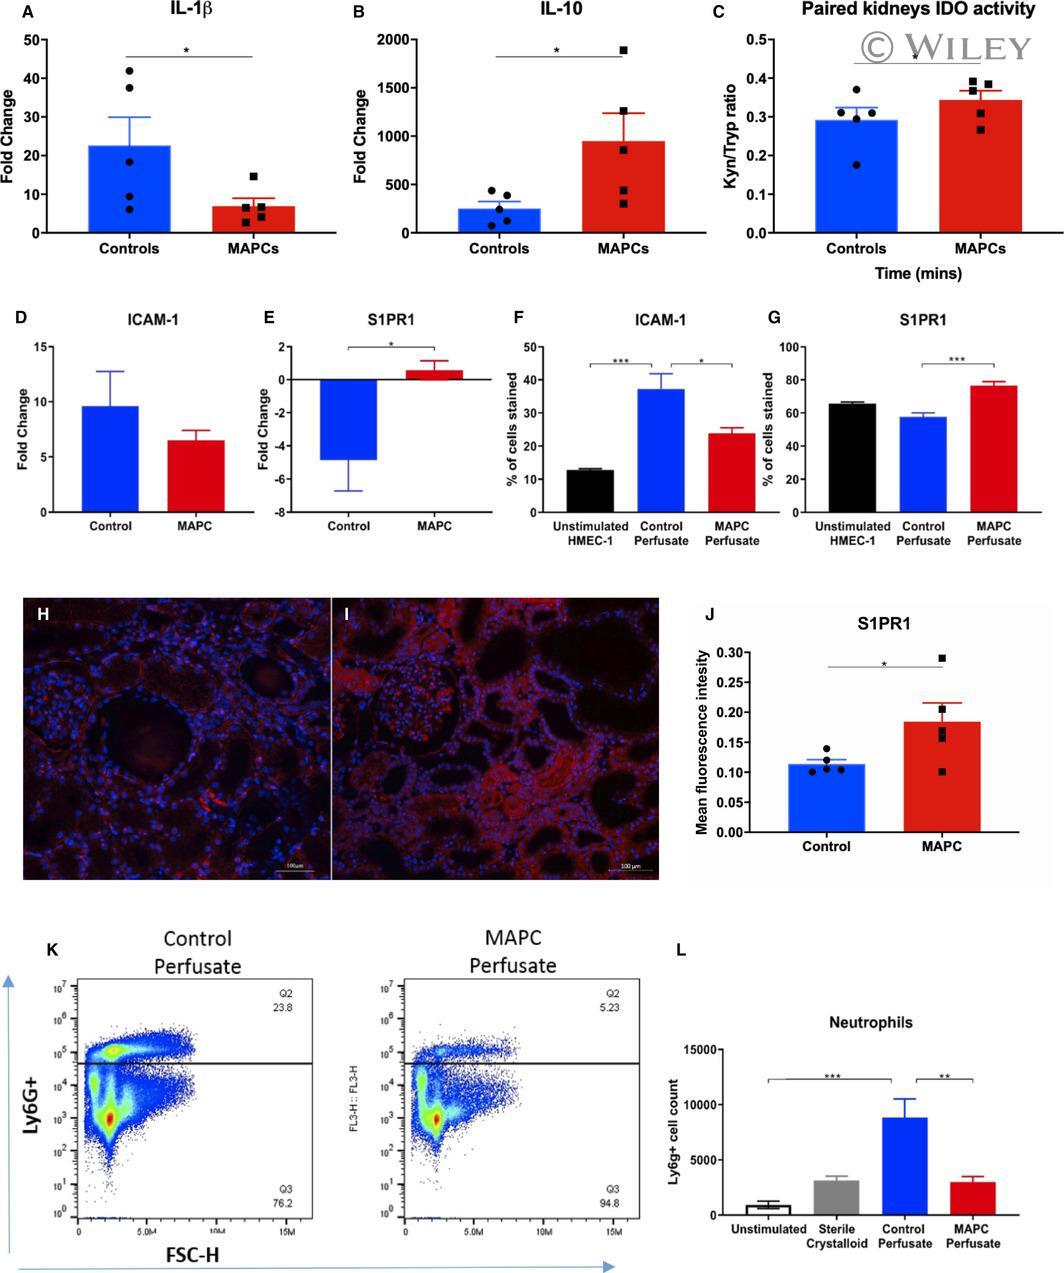
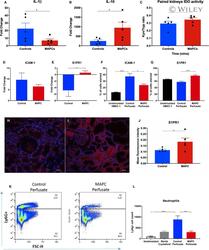
- 2 FIGURE Evaluating the immunomodulatory capability of MAPC therapy during kidney NMP. Panels A and B depict significant results from custom Mesoscale Discovery(tm) panel analyzing perfusate cytokine concentrations comparing control (blue) with MAPC-treated (red) NMP kidneys. Results are expressed as the mean fold change calculated relative to time zero. Panel A demonstrates a significant decreased expression of cytokine IL-1beta, paired t test, n = 5pairs, * P < .05 (MAPC-treated mean fold change 6.9 +- 2.1 vs control 26.8 +- 7.7). Panel B demonstrates a significant increase IL-10 in MAPC group, paired t test, n = 5 pairs, * P < .05 (MAPC-treated mean fold change 949.4 +- 288.6 vs control 252.9 +- 71.3). Panel C compares IDO activity in paired kidneys after 7 hours of NMP, paired t test, n = 5 pairs, * P < .05 (MAPC-treated K/T ratio 0.34 +- 0.02 vs control 0.29 +- 0.03). Panels D and E depict qPCR results from perfusate stimulated HMEC-1 cells (control kidneys vs MAPC treated). Panel D demonstrates ICAM-1 gene expression, paired t test, n = 5 pairs, p = ns (MAPC treated mean fold change on qPCR 9.6 +- 3.1 vs 6.5 +- 0.9). Panel E S1PR1 gene expression, paired t test, * P < .05 (MAPC treated mean fold change on qPCR -4.9 +- 1.7 vs control 0.6 +- 0.6). Panels F and G depict perfusate stimulated HMEC-1 cells immunohistochemistry staining for ICAM-1 and SIPR1 protein expression (control vs MAPC treated). Graph F demonstrates comparison of ICAM-1 protein expression between treatm