 Explore
 Validate
 Learn
LearnMA1-012
antibody from Invitrogen Antibodies
Targeting: NRAS
N-ras
 Western blot
 Immunocytochemistry Immunoprecipitation Immunohistochemistry
 Flow cytometry Other assay
Antibody data
- Antibody Data
- Antigen structure
- References [0]
- Comments [0]
- Validations
- Immunocytochemistry [8]
- Immunoprecipitation [1]
- Immunohistochemistry [3]
- Other assay [8]
Submit
Validation data
Reference
Comment
Report error
- Product number
- MA1-012 - Provider product page

- Provider
- Invitrogen Antibodies
- Product name
- Pan Ras Monoclonal Antibody (Ras10)
- Antibody type
- Monoclonal
- Antigen
- Purifed from natural sources
- Description
- This antibody recognizes normal p21, activated p21, and p21 from each of the Harvey, Kirsten and N-ras families.
- Reactivity
- Human, Mouse
- Host
- Mouse
- Isotype
- IgG
- Antibody clone number
- Ras10
- Vial size
- 100 μg
- Concentration
- 1 mg/mL
- Storage
- -20°C, Avoid Freeze/Thaw Cycles
No comments: Submit comment
Supportive validation
- Submitted by
- Invitrogen Antibodies (provider)
- Main image

- Experimental details
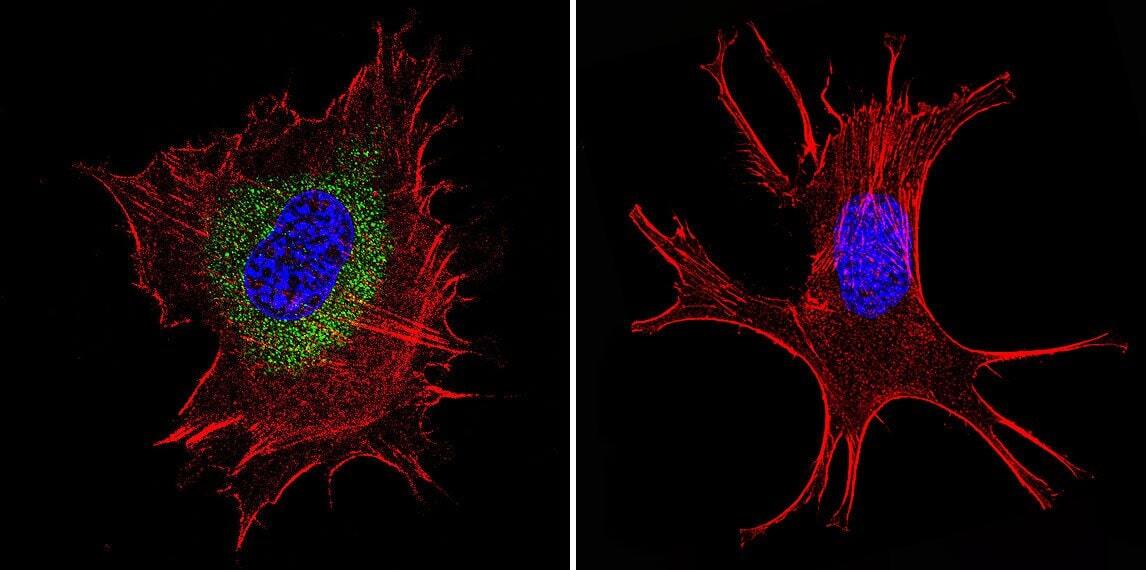
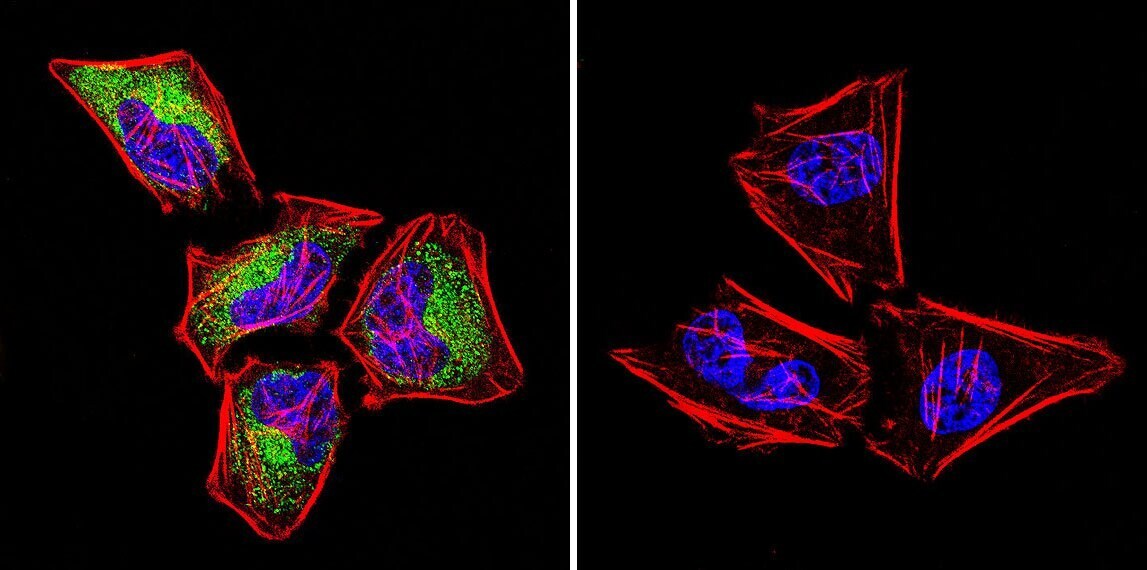
- Immunofluorescent analysis of Ras in HeLa Cells. Cells were grown on chamber slides and fixed with formaldehyde prior to staining. Cells were probed without (control) or with a Ras monoclonal antibody (Product # MA1-012) at a dilution of 1:100 overnight at 4 C, washed with PBS and incubated with a DyLight-488 conjugated secondary antibody (Product # 35503). Ras staining (green), F-Actin staining with Phalloidin (red) and nuclei with DAPI (blue) is shown. Images were taken at 60X magnification.

- Submitted by
- Invitrogen Antibodies (provider)
- Main image

- Experimental details
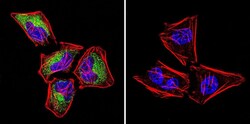
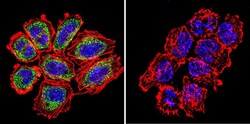
- Immunofluorescent analysis of Ras in NCI-H460 Cells. Cells were grown on chamber slides and fixed with formaldehyde prior to staining. Cells were probed without (control) or with a Ras monoclonal antibody (Product # MA1-012) at a dilution of 1:100 overnight at 4 C, washed with PBS and incubated with a DyLight-488 conjugated secondary antibody (Product # 35503). Ras staining (green), F-Actin staining with Phalloidin (red) and nuclei with DAPI (blue) is shown. Images were taken at 60X magnification.

- Submitted by
- Invitrogen Antibodies (provider)
- Main image

- Experimental details
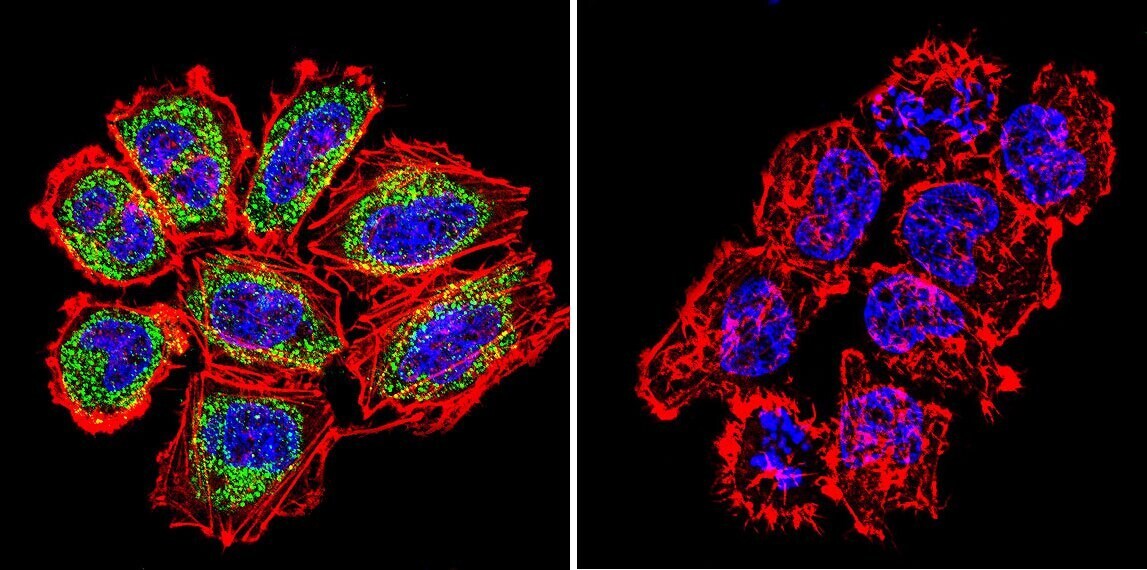
- Immunofluorescent analysis of Ras in NIH-3T3 Cells. Cells were grown on chamber slides and fixed with formaldehyde prior to staining. Cells were probed without (control) or with a Ras monoclonal antibody (Product # MA1-012) at a dilution of 1:100 overnight at 4 C, washed with PBS and incubated with a DyLight-488 conjugated secondary antibody (Product # 35503). Ras staining (green), F-Actin staining with Phalloidin (red) and nuclei with DAPI (blue) is shown. Images were taken at 60X magnification.
- Submitted by
- Invitrogen Antibodies (provider)
- Main image
- Experimental details
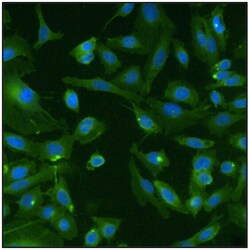
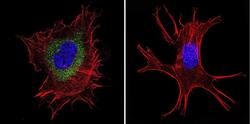
- Immunofluorescent analysis of Ras (green) in U20S cells. Formalin fixed cells were permeabilized with 0.1% Triton X-100 in TBS for 10 minutes at room temperature. Cells were then blocked with 5% normal goat serum (Product # 31873) for 15 minutes at room temperature. Cells were then probed with a mouse monoclonal antibody recognizing Ras (Product # MA1-012), at a dilution of 1:100 for at least 1 hour at room temperature. Cells were then washed with PBS and incubated with DyLight 488 goat-anti-mouse secondary antibody (Product # 35502) at a dilution of 1:400 for 30 minutes at room temperature. Nuclei (blue) were stained with Hoechst 33342 dye (Product # 62249). Images were taken on a Thermo Scientific ArrayScan at 20X magnification.
- Submitted by
- Invitrogen Antibodies (provider)
- Main image

- Experimental details
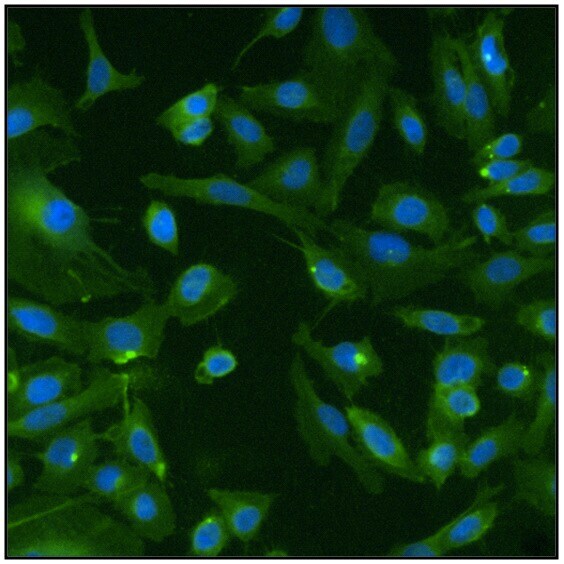
- Immunofluorescent analysis of Ras (green) in U20S cells. Formalin fixed cells were permeabilized with 0.1% Triton X-100 in TBS for 10 minutes at room temperature. Cells were then blocked with 5% normal goat serum (Product # 31873) for 15 minutes at room temperature. Cells were then probed with a mouse monoclonal antibody recognizing Ras (Product # MA1-012), at a dilution of 1:100 for at least 1 hour at room temperature. Cells were then washed with PBS and incubated with DyLight 488 goat-anti-mouse secondary antibody (Product # 35502) at a dilution of 1:400 for 30 minutes at room temperature. Nuclei (blue) were stained with Hoechst 33342 dye (Product # 62249). Images were taken on a Thermo Scientific ArrayScan at 20X magnification.

- Submitted by
- Invitrogen Antibodies (provider)
- Main image
- Experimental details
- Immunofluorescent analysis of Ras in HeLa Cells. Cells were grown on chamber slides and fixed with formaldehyde prior to staining. Cells were probed without (control) or with a Ras monoclonal antibody (Product # MA1-012) at a dilution of 1:100 overnight at 4 C, washed with PBS and incubated with a DyLight-488 conjugated secondary antibody (Product # 35503). Ras staining (green), F-Actin staining with Phalloidin (red) and nuclei with DAPI (blue) is shown. Images were taken at 60X magnification.
- Submitted by
- Invitrogen Antibodies (provider)
- Main image
- Experimental details
- Immunofluorescent analysis of Ras in NCI-H460 Cells. Cells were grown on chamber slides and fixed with formaldehyde prior to staining. Cells were probed without (control) or with a Ras monoclonal antibody (Product # MA1-012) at a dilution of 1:100 overnight at 4 C, washed with PBS and incubated with a DyLight-488 conjugated secondary antibody (Product # 35503). Ras staining (green), F-Actin staining with Phalloidin (red) and nuclei with DAPI (blue) is shown. Images were taken at 60X magnification.
- Submitted by
- Invitrogen Antibodies (provider)
- Main image
- Experimental details
- Immunofluorescent analysis of Ras in NIH-3T3 Cells. Cells were grown on chamber slides and fixed with formaldehyde prior to staining. Cells were probed without (control) or with a Ras monoclonal antibody (Product # MA1-012) at a dilution of 1:100 overnight at 4 C, washed with PBS and incubated with a DyLight-488 conjugated secondary antibody (Product # 35503). Ras staining (green), F-Actin staining with Phalloidin (red) and nuclei with DAPI (blue) is shown. Images were taken at 60X magnification.

Supportive validation
- Submitted by
- Invitrogen Antibodies (provider)
- Main image

- Experimental details
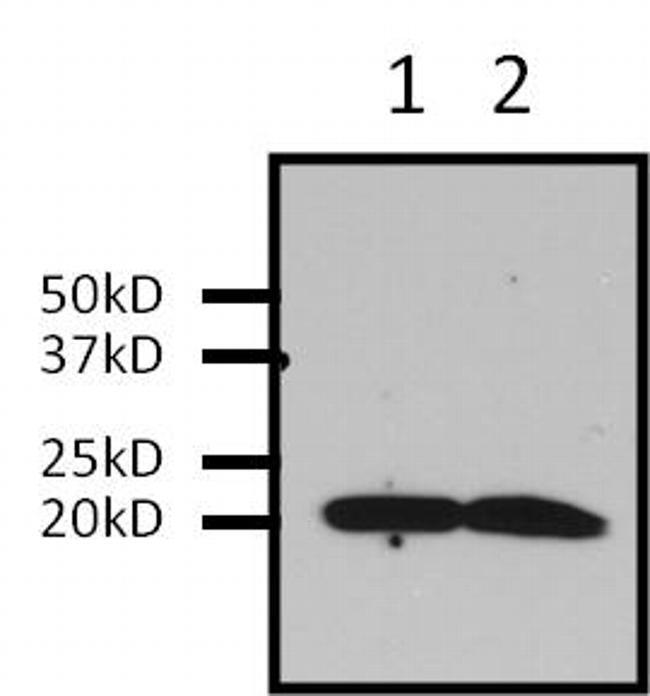
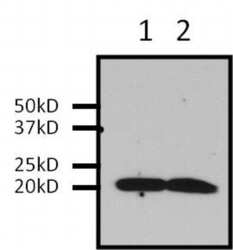
- Immunoprecipitation of Ras was performed on U2-OS cells. Antigen-antibody complexes were formed by incubating 500 µg of U2-0S whole cell lysate with 2 µg of a Ras monoclonal antibody (Product # MA1-012) overnight on a rocking platform at 4°C. The immune complexes were captured on 50 µL Protein A/G Plus Agarose (Product # 20423), washed extensively, and eluted with 5X Lane Marker Reducing Sample Buffer (Product # 39000). U2-OS whole cell lysate (Lane 1) and IP sample (Lane 2) were resolved on a 4-20% Tris-HCl polyacrylamide gel, transferred to a PVDF membrane, and blocked with 5% BSA/TBS-0.1%Tween for at least 1 hour. The membrane was probed with a Ras monoclonal antibody (Product # MA1-012) at a dilution of 1:1000 overnight at 4°C, washed in TBST, and probed with Clean-Blot IP Detection Reagent (Product # 21230) at a dilution of 1:2000 for at least 1 hour. Chemiluminescent detection was performed using SuperSignal West Pico (Product # 34080).
Supportive validation
- Submitted by
- Invitrogen Antibodies (provider)
- Main image
- Experimental details
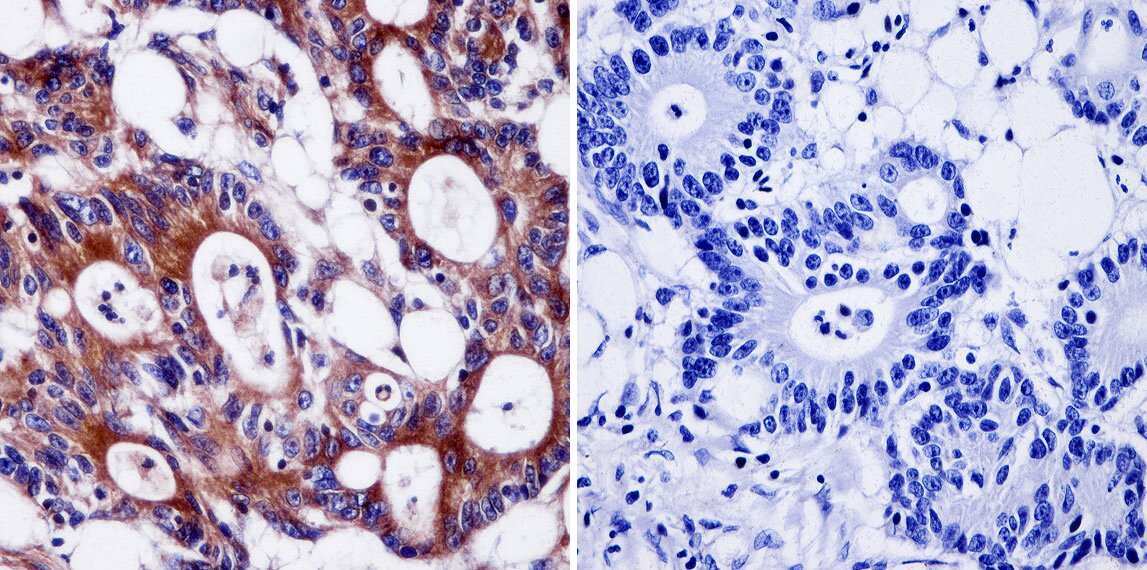
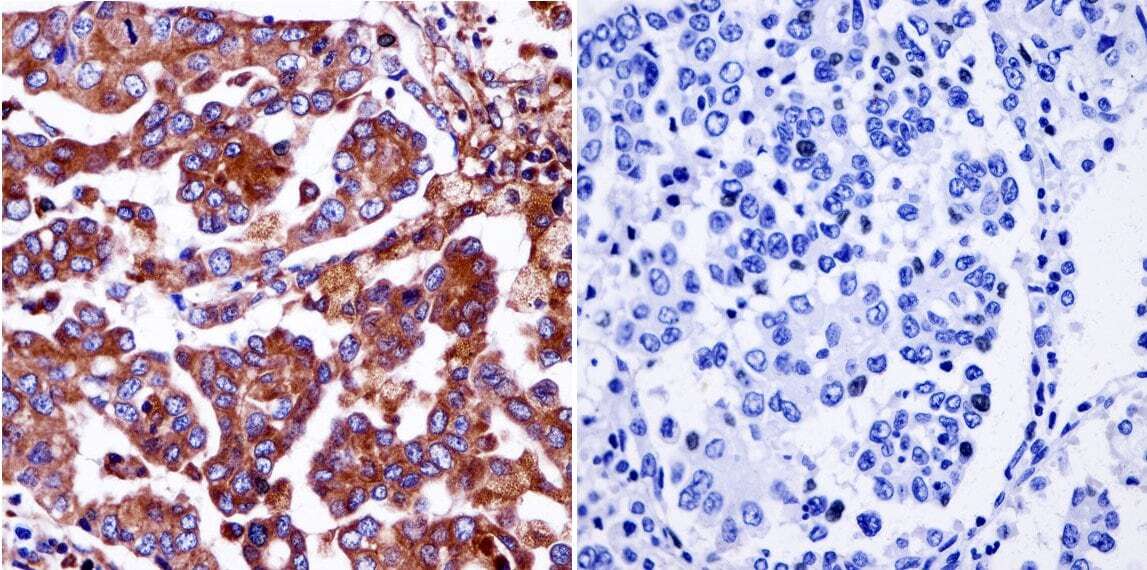
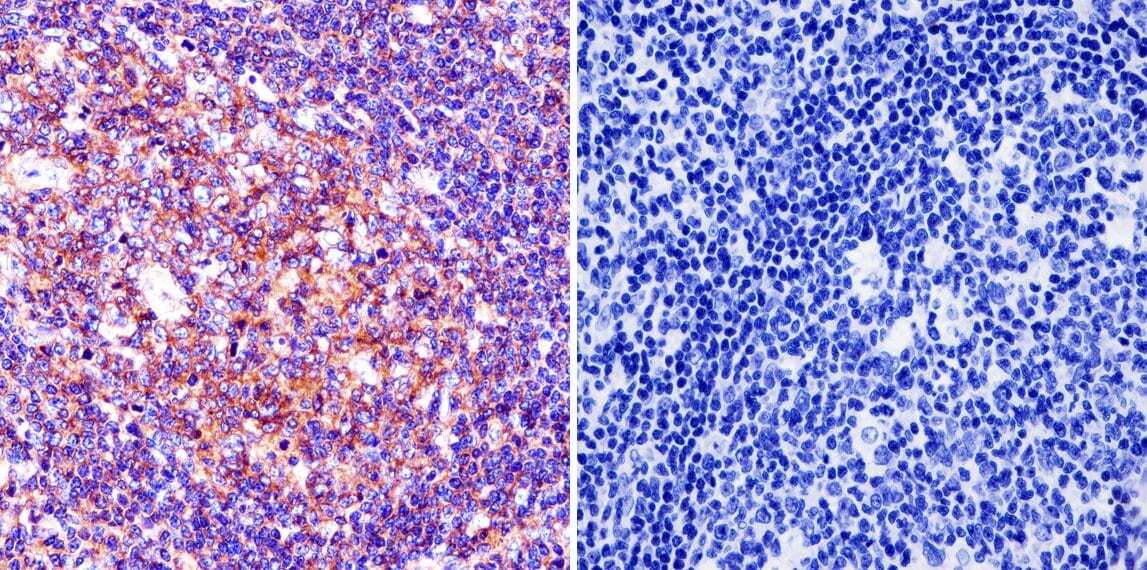
- Immunohistochemistry was performed on cancer biopsies of deparaffinized Human colon carcinoma tissue. To expose target proteins, heat induced antigen retrieval was performed using 10mM sodium citrate (pH6.0) buffer, microwaved for 8-15 minutes. Following antigen retrieval tissues were blocked in 3% BSA-PBS for 30 minutes at room temperature and probed with a Ras monoclonal antibody (Product # MA1-012) at a dilution of 1:200 or without primary antibody (negative control) overnight at 4°C in a humidified chamber. Tissues were washed with PBST and endogenous peroxidase activity was quenched with a peroxidase suppressor. Detection was performed using a biotin-conjugated secondary antibody and SA-HRP, followed by colorimetric detection using DAB. Tissues were counterstained with hematoxylin and prepped for mounting.
- Submitted by
- Invitrogen Antibodies (provider)
- Main image
- Experimental details
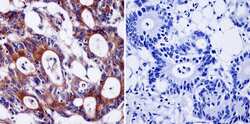
- Immunohistochemistry was performed on cancer biopsies of deparaffinized Human lung adenocarcinoma tissue. To expose target proteins, heat induced antigen retrieval was performed using 10mM sodium citrate (pH6.0) buffer, microwaved for 8-15 minutes. Following antigen retrieval tissues were blocked in 3% BSA-PBS for 30 minutes at room temperature and probed with a Ras monoclonal antibody (Product # MA1-012) at a dilution of 1:200 or without primary antibody (negative control) overnight at 4°C in a humidified chamber. Tissues were washed with PBST and endogenous peroxidase activity was quenched with a peroxidase suppressor. Detection was performed using a biotin-conjugated secondary antibody and SA-HRP, followed by colorimetric detection using DAB. Tissues were counterstained with hematoxylin and prepped for mounting.
- Submitted by
- Invitrogen Antibodies (provider)
- Main image
- Experimental details
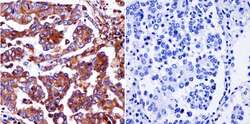
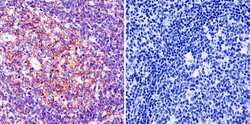
- Immunohistochemistry was performed on normal biopsies of deparaffinized Human tonsil tissue. To expose target proteins, heat induced antigen retrieval was performed using 10mM sodium citrate (pH6.0) buffer, microwaved for 8-15 minutes. Following antigen retrieval tissues were blocked in 3% BSA-PBS for 30 minutes at room temperature and probed with a Ras monoclonal antibody (Product # MA1-012) at a dilution of 1:100 or without primary antibody (negative control) overnight at 4°C in a humidified chamber. Tissues were washed with PBST and endogenous peroxidase activity was quenched with a peroxidase suppressor. Detection was performed using a biotin-conjugated secondary antibody and SA-HRP, followed by colorimetric detection using DAB. Tissues were counterstained with hematoxylin and prepped for mounting.
Supportive validation
- Submitted by
- Invitrogen Antibodies (provider)
- Main image
- Experimental details
- Immunoprecipitation of Ras was performed on U2-OS cells. Antigen-antibody complexes were formed by incubating 500 µg of U2-0S whole cell lysate with 2 µg of a Ras monoclonal antibody (Product # MA1-012) overnight on a rocking platform at 4°C. The immune complexes were captured on 50 µL Protein A/G Plus Agarose (Product # 20423), washed extensively, and eluted with 5X Lane Marker Reducing Sample Buffer (Product # 39000). U2-OS whole cell lysate (Lane 1) and IP sample (Lane 2) were resolved on a 4-20% Tris-HCl polyacrylamide gel, transferred to a PVDF membrane, and blocked with 5% BSA/TBS-0.1%Tween for at least 1 hour. The membrane was probed with a Ras monoclonal antibody (Product # MA1-012) at a dilution of 1:1000 overnight at 4°C, washed in TBST, and probed with Clean-Blot IP Detection Reagent (Product # 21230) at a dilution of 1:2000 for at least 1 hour. Chemiluminescent detection was performed using SuperSignal West Pico (Product # 34080).

- Submitted by
- Invitrogen Antibodies (provider)
- Main image
- Experimental details
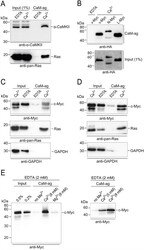
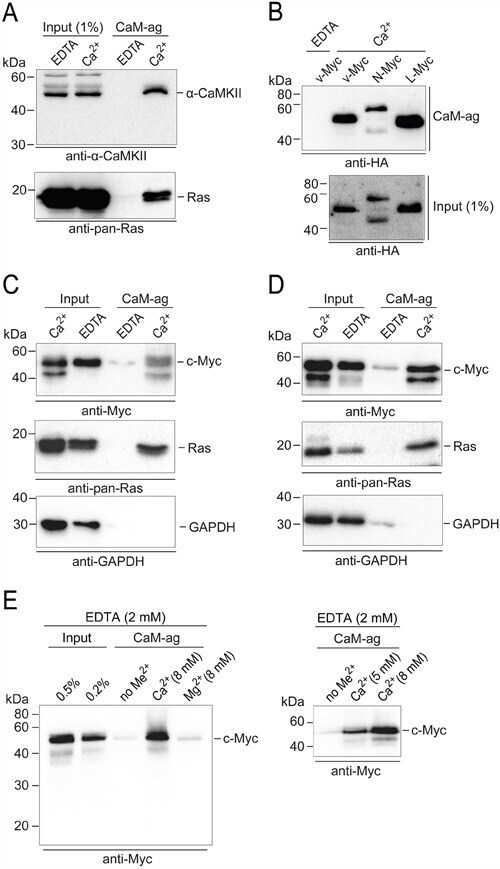
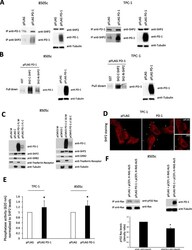
- Figure 4 PPI of CaM and Myc family members Whole cell extracts of distinct cell lines and tissues were used in CaM-agarose (CaM-ag) pull-down experiments. A. For comparison, authentic CaM binding partners were analyzed first. Endogenous CaM-dependent protein kinase from whole mouse brain extracts was detected using monoclonal antibodies directed against alpha-CAMKII. Ras proteins were analyzed in extracts from the human colon adenocarcinoma cell line SW480 using monoclonal anti-pan-Ras antibodies. B. To analyze the binding of distinct Myc-family members to CaM, HA-tagged v-Myc, N-Myc, and L-Myc proteins were overexpressed in QT6 cells. Whole cell extracts were prepared and subjected to CaM-ag binding assays. Proteins eluted from the affinity matrix ( upper panel ) and aliquots of whole cell extracts ( lower panel ) were analyzed by immunoblotting using HA-specific antibodies. C. Endogenous c-Myc proteins were analyzed in CaM-ag binding assays using extracts from SW480 cells and monoclonal anti-c-Myc antibodies. For direct comparison, Ras proteins were analyzed from the same extracts using monoclonal anti-pan-Ras antibodies. GAPDH was used as a negative control, using monoclonal anti-GAPDH antibodies. Input: 0.25% (Ca 2+ ), or 0.1% (EDTA). D. Analyses as in (C) of endogenous c-Myc proteins from the human embryonic kidney cell line HEK293. All binding assays were done in the presence of 2 mM EDTA, or 0.5 mM CaCl 2 (Ca 2+ ). E. Left panel : CaM-ag binding analysis of endogenous
- Submitted by
- Invitrogen Antibodies (provider)
- Main image

- Experimental details
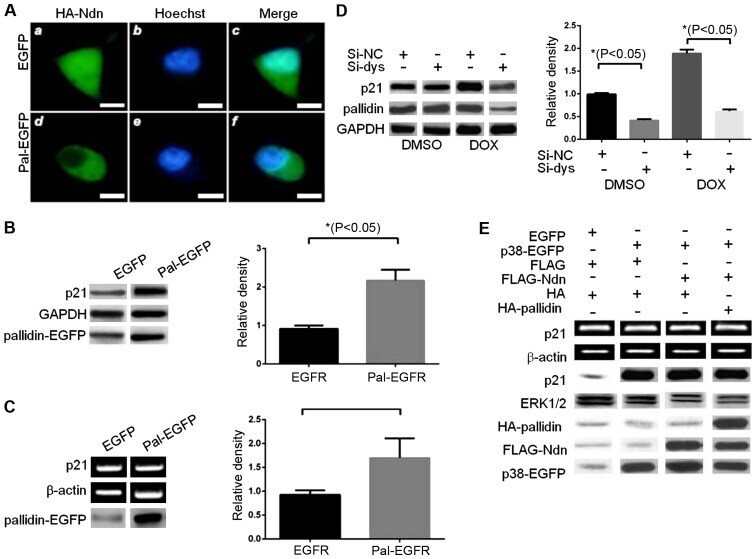
- Figure 2. Pallidin changes HA-Ndn localization and influences the transcriptional activity of p38. (A) The immunofluorescence results showed that overexpression of pallidin-EGFP caused HA-Ndn to disappear from the nucleus and be present only in the cytoplasm of the transfected cells. (B and C) Overexpression of pallidin-EGFP in the HCT116 p38 wild-type cell line increased the endogenous p21 protein (western blot analysis) and mRNA (quantitative PCR) levels. (D) The small RNA interference method was used to decrease the expression level of endogenous pallidin and observe the effect on the expression level of the endogenous p21 protein in the HCT116 p38 +/+ cell line. The decrease in p21 protein was significant even upon activation of endogenous p38 transcription by doxorubicin (DOX). (E) Different combinations of overexpressing plasmids were transfected into HCT116 p38 -/- cells. Pallidin was able to reverse the decrease of the p21 protein and RNA levels in the HCT116 p38 -/- cell line as a result of its inhibitory effect on HDAC3.
- Submitted by
- Invitrogen Antibodies (provider)
- Main image
- Experimental details
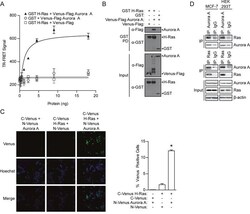
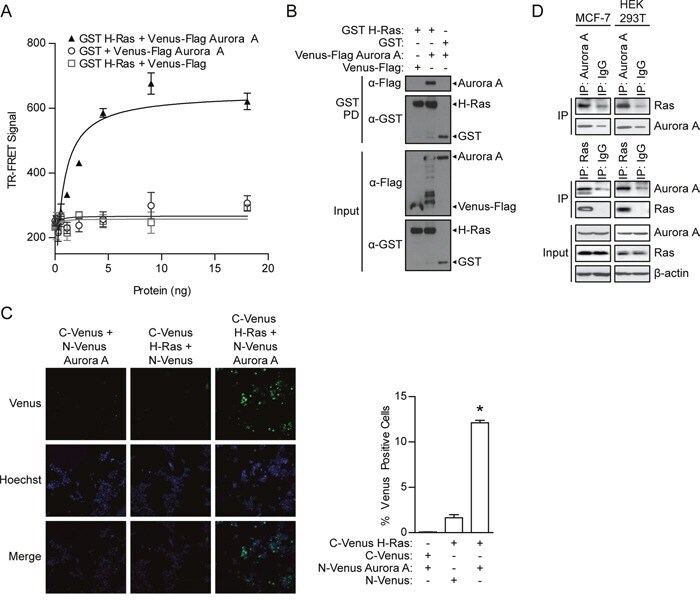
- Figure 1 Detection of the Aurora A/H-Ras interaction A . TR-FRET assay performed using lysates from HEK 293T cells in which GST H-Ras was co-expressed with Venus-Flag Aurora A or vector controls. TR-FRET signal calculated as X/Y*Z; Tb ex 340 nm; Tb em 486 nm (X); Venus em 520 nm (Y); Z = 10 4 ). TR-FRET signals were recorded using an EnVision multilabel plate reader. Data shown are average signals with SD from duplicate samples. B . GST pull-down assay conducted after GST H-Ras complexes were isolated from HEK 293T cell lysates with co-expressed Venus-Flag Aurora or appropriate controls. The presence of Venus-Flag Aurora A in the GST H-Ras protein complex (GST PD) and protein expression levels in the cell lysate (Input) was detected by Western blotting using anti-Flag or anti-GST antibody, respectively. C . A Venus protein-fragment complementation (Venus PCA) assay was conducted in living HEK 293T cells co-expressing N-Venus Aurora A and C-Venus H-Ras or vector controls. Interaction between tagged proteins allowed reconstitution of fluorescent Venus protein. The percentage of Venus positive cells was quantified by fluorescence imaging and scoring from two independent experiments. The percentage represents the number of cells with positive interactions compared to the total number of cells (determined by Hoechst staining). Representative images: Venus (positive protein-protein interaction), Hoechst (nucleus), Merge (overlap of Venus and Hoechst signals). D . Co-immunoprecipita
- Submitted by
- Invitrogen Antibodies (provider)
- Main image
- Experimental details
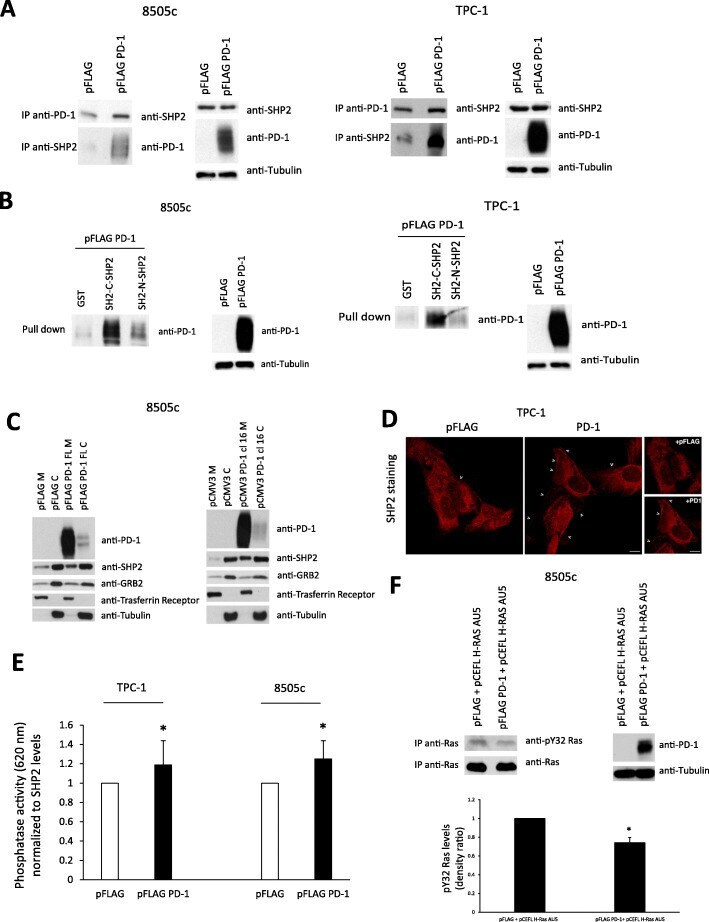
- Fig. 4 Effects of intrinsic PD-1 on SHP2 localization and functions. a. Total cell protein extracts from 8505c and TPC-1 cells transiently transfected with pFLAG PD-1 or the empty vector (pFLAG) were subjected to immunoprecipitation followed by western blotting with the indicated antibodies. A representative experiment is shown. b. Total protein extracts from 8505c and TPC-1 cells transiently transfected with pFLAG-PD-1 were subjected to an in vitro pull-down assay using the indicated recombinant proteins. Bound proteins were immunoblotted with antibody against PD-1. A representative experiment is shown. c. 8505c cells transiently transfected with PD-1 (pFLAG PD-1) or stably overexpressing PD-1 (pCMV3 PD-1 cl16) and the relative control cells were harvested and subjected to cell protein fractionation. Membrane (M) and cytoplasmic (C) protein fractions were immunoblotted with the indicated antibodies. Transferrin receptor or tubulin levels were used as normalization of membrane and cytosolic fractions, respectively. A representative experiment is shown. d. Immunofluorescence microscopy of TPC-1 cells, transiently transfected with pFLAG PD-1 or the empty vector, stained with an antibody specific for SHP2. A representative experiment is shown. Arrows indicate the surface signal of SHP2. Bars, 5 mum. e. SHP2 phosphatase activity assay on TPC-1 and 8505c cells transiently transfected with PD-1 (pFLAG PD-1) and the relative control (pFLAG), assessed by using a specific SHP2 phospho
- Submitted by
- Invitrogen Antibodies (provider)
- Main image
- Experimental details
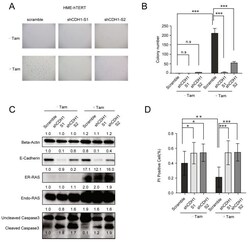
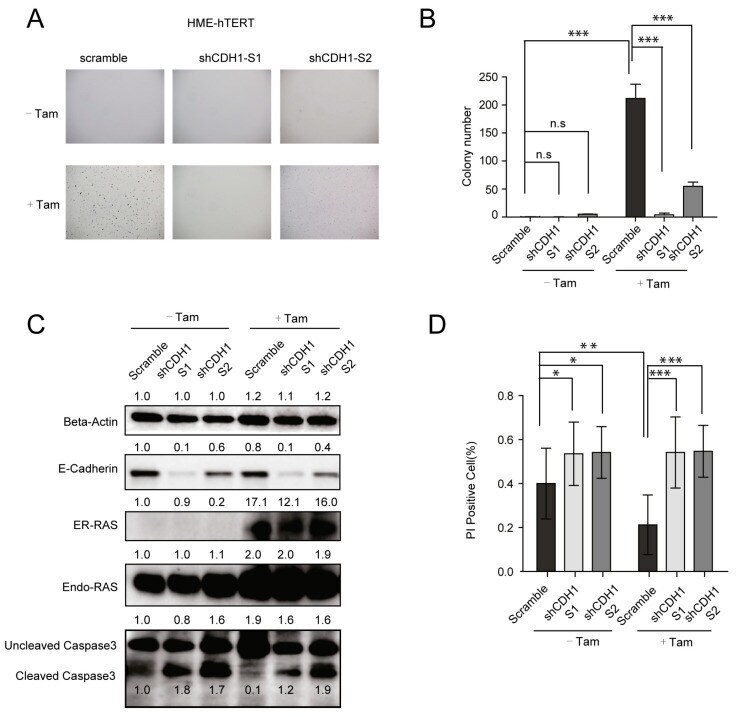
- Figure 3 The upregulation of E-cadherin (CDH1) in HME-hTERT is necessary for cell survival and oncogenic RAS-stimulated proliferation under the soft-agar growth conditions. ( A ) Representative microscopic images of soft-agar colonies of HME-hTERT cells expressing ER-tagged CA-NRAS inducible by tamoxifen and expressing either a control shRNA (scramble) or two different shRNAs targeting CDH1. ( B ) Quantitation of the data from the experiment in panel A. The data represent the mean and SD of colony counts from five representative microscopic fields from the indicated condition. The study was repeated 3 times with similar results. *** p
- Submitted by
- Invitrogen Antibodies (provider)
- Main image
- Experimental details
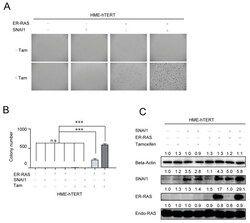
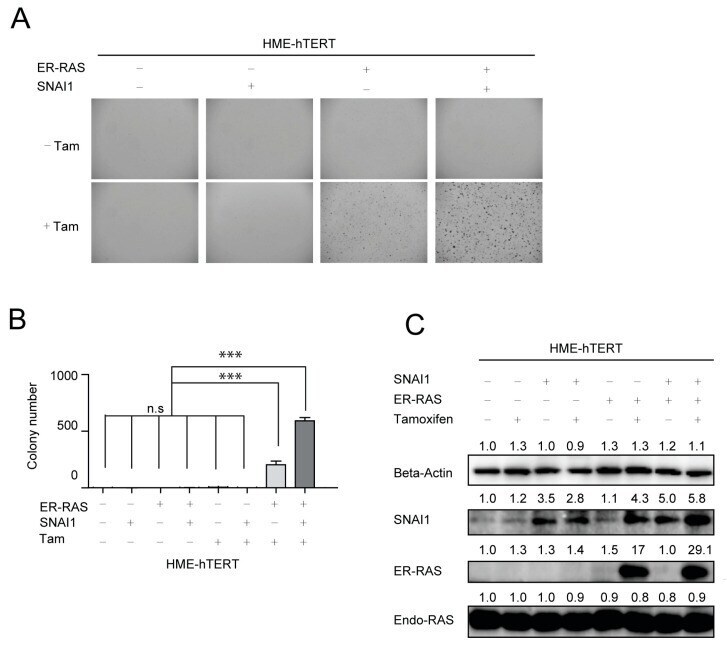
- Figure 4 Mutant-RAS-driven cell proliferation in soft agar requires the upregulation of epithelial-mesenchymal transition (EMT). ( A ) Representative microscopic images of HME-hTERT cells grown in soft agar with or without the exogenous expression of CA-NRAS and/or SNAI1. ( B ) Quantitation of the data from panel A. Data are presented as mean +- SD of the number of colonies counted in three separate fields from each condition *** p
- Submitted by
- Invitrogen Antibodies (provider)
- Main image
- Experimental details
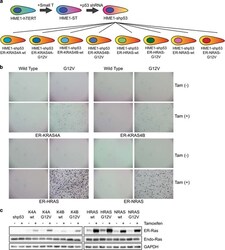
- Figure 1 HME1-shp53 cells can be transformed by all four RAS-G12V mutant isoforms, but not by their wild-type counterparts. ( a ) Illustration of the scheme for creation of the HME1-shp53 cell line by sequential addition of SV40 small T antigen, shRNA against p53, and ER-tagged wild-type or G12V-mutant RAS isoforms into HME1-hTERT cells. 26 , 27 The parental HME1-hTERT (ATCC CRL-4010(tm)) cells were obtained from American Type Cell Culture (ATCC) and mycoplasma-free. Stable expression of genes was achieved by transduction with retroviral expression vectors pBABE-hygro (for SV40 Small T Antigen), pRetroSuper (for shRNA against p53) or pBABE-puro (for all forms of RAS) 28 , 29 with viruses generated via calcium phosphate transfection, 30 followed by stable selection using 20 mug/ml hygromycin for pBABE-hygro (Invitrogen, Carlsbad, CA, USA), 5 mug/ml blasticidin for pRetroSuper (Sigma Aldrich, St Louis, MO, USA), and 5 mug/ml puromycin (Sigma Aldrich) for pBABE-puro. Ras isoforms were cloned using primers listed in Supplementary Table S1 . G12V mutations were introduced using QuikChange Site-Directed Mutagenesis Kit (Agilent Technologies) and the targeting oligonucleotides are listed in Supplementary Table S1 . ( b ) HME1-shp53 cells expressing wild-type or ER-tagged G12V mutant of KRAS4A, KRAS4B, HRAS and NRAS as shown in ( a ) were cultured in soft agar in the presence or absence of 500 n M tamoxifen (Sigma Aldrich) for 14 days, and subsequently stained using methylthi
