Explore
 Validate
 Learn
LearnMA5-15056
antibody from Invitrogen Antibodies
Targeting: FOSB
AP-1, DKFZp686C0818, G0S3, GOS3, GOSB, MGC42291
 Western blot Immunocytochemistry
 Immunoprecipitation Immunohistochemistry Flow cytometry Chromatin Immunoprecipitation Other assay
Antibody data
- Antibody Data
- Antigen structure
- References [1]
- Comments [0]
- Validations
- Western blot [1]
- Immunocytochemistry [2]
- Immunohistochemistry [1]
- Other assay [2]
Submit
Validation data
Reference
Comment
Report error
- Product number
- MA5-15056 - Provider product page

- Provider
- Invitrogen Antibodies
- Product name
- FosB Monoclonal Antibody (H.234.10)
- Antibody type
- Monoclonal
- Antigen
- Synthetic peptide
- Description
- It is not recommended to aliquot this antibody. This antibody is not cross-reactive with other Fos proteins, including c-fos, FRA1 and FRA2.
- Reactivity
- Human, Mouse, Rat
- Host
- Rabbit
- Isotype
- IgG
- Antibody clone number
- H.234.10
- Vial size
- 100 μL
- Concentration
- 107 μg/mL
- Storage
- -20°C
Submitted references Glutamate triggers the expression of functional ionotropic and metabotropic glutamate receptors in mast cells.
Alim MA, Grujic M, Ackerman PW, Kristiansson P, Eliasson P, Peterson M, Pejler G
Cellular & molecular immunology 2021 Oct;18(10):2383-2392
Cellular & molecular immunology 2021 Oct;18(10):2383-2392
No comments: Submit comment
Supportive validation
- Submitted by
- Invitrogen Antibodies (provider)
- Main image
- Experimental details
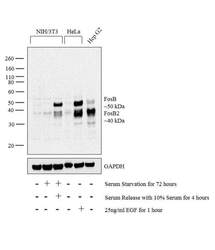
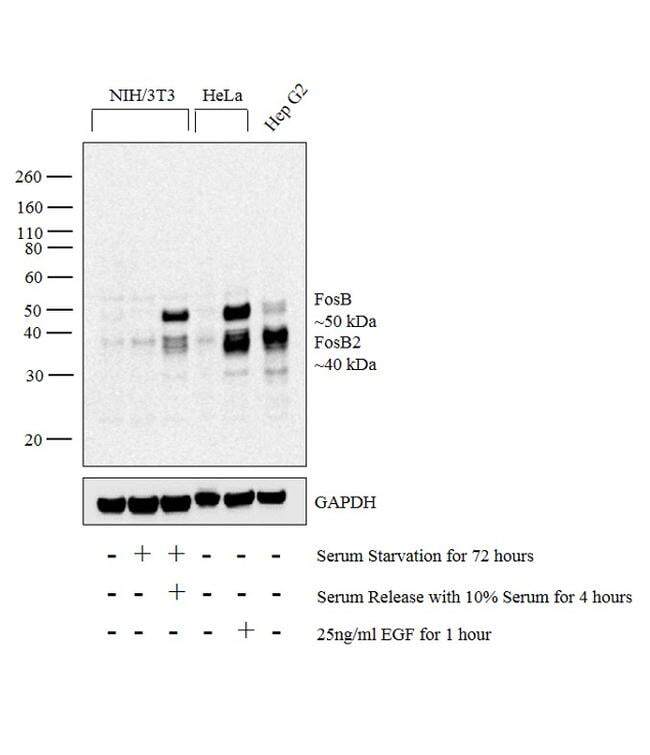
- Western blot analysis was performed on nuclear enriched cell extracts (30 µg lysate) of NIH/3T3 (Lane 1), NIH/3T3 Serum Starved (72 hours) (Lane 2), NIH/3T3 Serum Starved (72 hours) followed by Serum Release (10% serum for 4 hours) (Lane 3), HeLa (Lane 4), HeLa treated with EGF (25 ng/mL for 1 hour) (Lane 5) and Hep G2 (Lane 6). The blot was probed with Anti-FosB Monoclonal Antibody (H.234.10) (Product # MA5-15056, 1:500 dilution) and detected by chemiluminescence using Goat anti-Rabbit IgG (Heavy Chain) Superclonal™ Secondary Antibody, HRP conjugate (Product # A27036, 0.25 µg/mL, 1:4000 dilution). A 50 kDa band corresponding to FosB and a 40 kDa corresponding to FosB2 was observed across the cell lines tested and was enhanced upon treatment.
Supportive validation
- Submitted by
- Invitrogen Antibodies (provider)
- Main image

- Experimental details
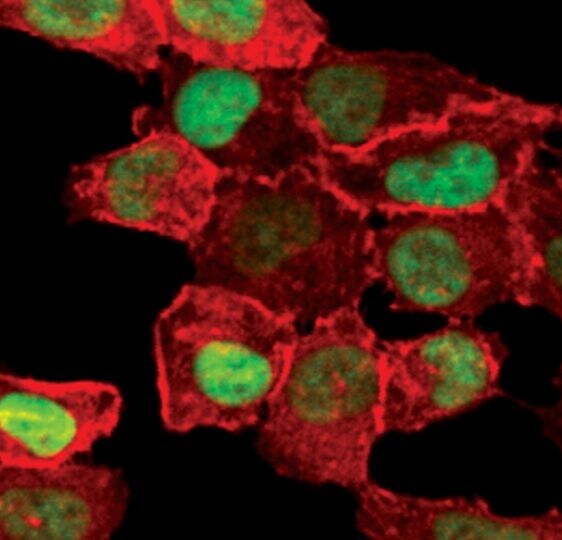
- Immunofluorescent analysis of FosB in HeLa cells using a FosB monoclonal antibody (Product # MA5-15056) (green). Actin filaments are labeled with a fluorescent red phalloidin.

- Submitted by
- Invitrogen Antibodies (provider)
- Main image

- Experimental details
- Immunofluorescent analysis of FosB in HeLa cells using a FosB monoclonal antibody (Product # MA5-15056) (green). Actin filaments are labeled with a fluorescent red phalloidin.
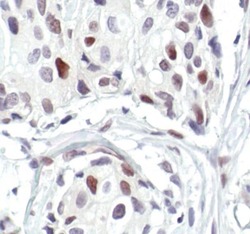
Supportive validation
- Submitted by
- Invitrogen Antibodies (provider)
- Main image
- Experimental details
- Immunohistochemical analysis of FosB in paraffin-embedded human breast carcinoma using a FosB monoclonal antibody (Product # MA5-15056) in the presence of control peptide (left) or FosB blocking peptide (right).

Supportive validation
- Submitted by
- Invitrogen Antibodies (provider)
- Main image
- Experimental details
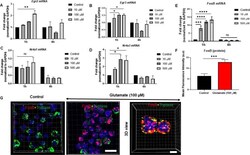
- Fig. 6 Glutamate induces the expression of transcription factors and nuclear receptors. MCs (1 x 10 6 /ml) were exposed to glutamate (10, 100, or 500 uM) for 1 h, 4 h, or 24 h. a - e Relative mRNA levels (fold change) for Egr2, Egr3, Nr4a1, Nr4a3, and FosB were quantified by qPCR. The relative mRNA levels of targets were normalized to the housekeeping gene GAPDH. g Visualization of FosB protein in control- and glutamate-treated MCs using confocal microscopy. Cells were costained for FosB, tryptase (MC granule marker), and DAPI (nuclear marker). f Quantification of FosB staining in control and glutamate-treated MCs. Scale bars: 25 mum. Data represent mean values +- SEM ( n = 3). Significance was calculated with an unpaired t -test with Welch's correction. *** p

- Submitted by
- Invitrogen Antibodies (provider)
- Main image
- Experimental details
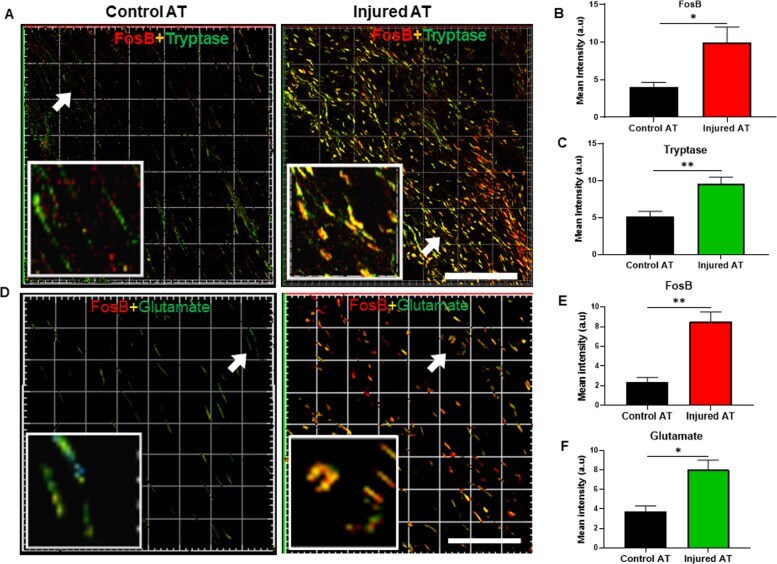
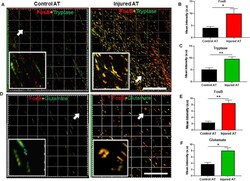
- Fig. 8 Colocalization of FosB, MC tryptase, and glutamate in an injured tendon. a Immunofluorescence image showing colocalization of FosB and MC tryptase (Mcpt6) in an injured Achilles tendon (AT). Note the abundance of cells double positive for tryptase (MCs) and FosB in the injured, but not in control, tissues. b , c Quantification of FosB and tryptase staining in the control and injured ATs. d Immunofluorescence images showing colocalization of FosB and glutamate in the control and injured ATs. Note the abundance of cells double positive for FosB and glutamate in the injured, but not in the control, ATs. e , f Quantification of FosB and glutamate staining in the control and injured tendons. * p